

Introduction
Inorganic and organic contaminants are tenacious and non-biodegradable; therefore, reducing widespread water contamination typically involves major challenges [1]. Additionally, new pollutants, such as dyes, might cause environmental and health problems [2]. The textile and printing sectors produced and consumed many million tons per year [3, 4]. There is a lot of interest in the treatment of effluent azo dye pollution [5, 6].
As effective methods to treat wastewater or water sources, adsorption and membrane technologies, biological treatments, and advanced oxidation techniques are all among the most common techniques for the treatment of contaminants and the remediation of water. Some disadvantages of such chemical treatments include the requirement of extra chemicals, increased formation of sludge, the need to remove excess color, and chemical oxygen consumption [7]. Membrane technology is used successfully in a variety of manufacturing sectors. It is an appropriate separation technique used to treat and purify liquids. It is crucial in the process of cleaning water compared to other technologies, such as photocatalysis. For their catalytic properties, metal nanoparticles are the subject of extensive investigation [8]. Zinc oxide is used to process rubber, clean wastewater, and act as a fungicide due to its strong catalytic efficacy and potent adsorption capacity [9]. Strong support was given to the main advantages of plant-mediated nanoparticle synthesis [10]. Biodegradable materials are almost completely used in these environmentally friendly techniques [11]. Furthermore, the characteristics of ZnO NPs may depend on the sources of the plant precursors due to the wide variations in the chemical composition of plant extracts.
Several phytochemicals, including polysaccharides and polyphenols, were reported to be present in almost all plant extracts. These phytochemicals are crucial for functioning as bioreducing and biocapping reagents during the synthesis of ZnO nanoparticles. Zinc oxide has outstanding photochemical reactivity and effectively eliminates pollutants [12].
The aim of this work is to synthesize and characterize new membranes based on nanoparticles and implement hybrid membranes and photocatalytic processes in an integrated system for the degradation of pollutants-containing solutions. Many industrial sectors can use this technology: for the purification of wastewater, in the textile industry, the food industry, and the pharmaceutical sector. As a result, catalytic membrane reactors are considered a potential technology in various industrial fields, including biotechnology, the pharmaceutical sector, petrochemicals, chemical plants, energy, and environmental applications. This process is an innovative alternative for sustainable growth that depends on the design strategy to gain benefits in manufacturing and processing. (i) Synthesis of membranes coupled with nanoparticles to use in-situ photocatalytic processes was tested for the first time in the degradation of pollutants, (ii) Application of an integrated treatment system. The integrated system will lead to the implementation of processes in biotechnology, the pharmaceutical sector, petrochemicals, chemical plants, energy, and environmental applications. The system eventually aims for the recovery of water sources from effluents and the re-use of water back into the industrial process system. The incorporation of membrane techniques into the treatment processes of liquid effluents loaded with metal ions has emerged. Filtration membranes (microfiltration, ultrafiltration, nanofiltration, reverse osmosis, pervaporation, and electro-membrane techniques) would be used for this purpose with questionable efficiency and selectivity. Indeed, many industrial sectors use this technology: for the purification of wastewater, in the textile industry, the food industry, and the pharmaceutical sector. Recently, significant research efforts have been devoted to catalytic membrane reactors, as types of membrane reactors, considered multifunctional catalytic reactors fusing membrane-based separation and chemical reaction into a single unit. Proper design of the catalytic membrane reactor leads to improved efficiency, reagent conversion, and lower downstream separation costs.
The purpose of this work is to depollute wastewater using membrane ultrafiltration technology. The present study was designed to test the following hypotheses:
(1) The catalytic properties of biodegradable materials resulting from the green synthesis process;
(2) The treatment method by ZnO NPs coupled with CA membranes has reliability and efficiency in depolluting organic and mineral contaminants.
Materials and Methods
Materials: Methyl orange, polyethylene glycol (PEG 1000), and dimethylformamide (DMF) (CAS 68-12-2) and CA (CAS 9004-35-7) were given by Dae-Jung Chemicals and Sigma-Aldrich, respectively. The addition of HCl (0.1 M) and NaOH (0.1 M) solutions kept the pH of the solution at the desired levels. All prepared solutions were made with distilled water, and all experiments were carried out at room temperature.
Plant collection and extraction: Fresh fenugreek plant leaves were brought into the laboratory. To eliminate attached particles, the plant leaves were carefully cleaned with tap water and then washed with distilled water. In a glass beaker, 20 grams of leaves were heated through 100 ml of deionized water for 30 min at 80ºC. After cooling the extract, it was filtered through Whattman filter paper. The leaf extract was stored in a refrigerator for further ZnO-NP synthesis.
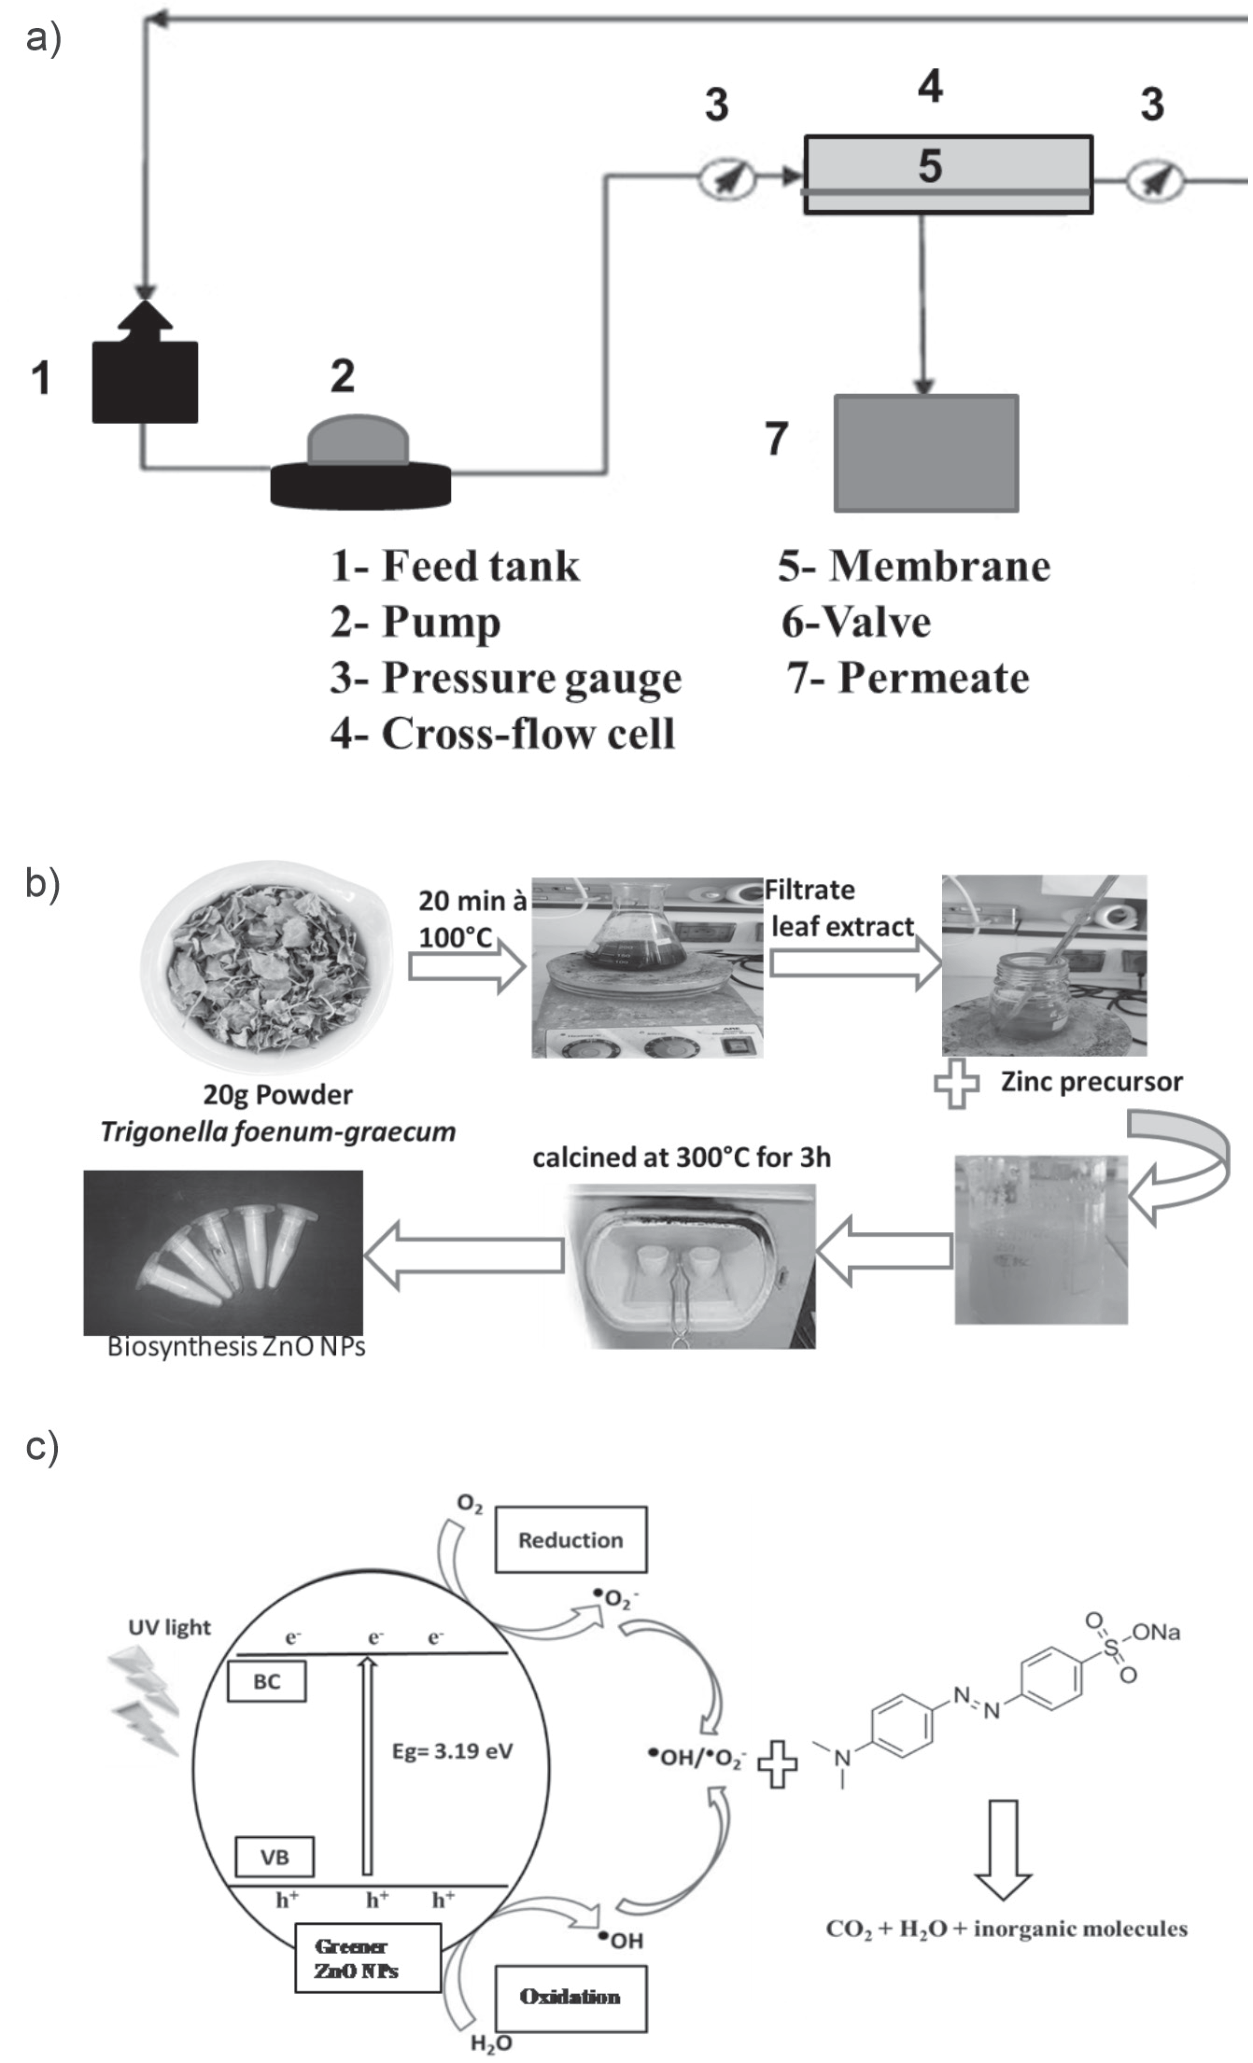
Green synthesis process: The aqueous extract of the plant was used to reduce zinc to ZnO NPs. Briefly, a heated stirrer was used to boil twenty milliliters of fenugreek aqueous leaf extract at 60-80ºC. Once the extract attained 100ºC, 5 g of zinc sulfate hephydrate (Zn (SO4)2·7H2O) was added. The above solution was heated at the same temperature until it was lowered to a light yellowish paste. The paste was introduced dropwise into a ceramic crucible, located in a muffle furnace, and dried and calcined for 3 hours at 300ºC. As a result, a dry, pale yellowish powder was formed.
AC/ZnO UF membrane preparation: Synthesis of a membrane coupled with ZnO NPs was performed according to the method described by Alhalili et al. [13].
Photocatalytic Activity: To test the photocatalytic activity of ZnO NPs, we add 25 ppm Malachite dye to 100 mL of distilled water. The initial concentration (20 mL) was removed from the solution, and the remaining solution of 0.1 g of ZnO-NPs catalyst was added to 80 mL of dye solution. To maintain the adsorption-desorption equilibrium, the solution was installed in the dark for 30 minutes, afterward exposed to UV light, and samples were taken every 15 minutes. To remove the catalyst from the samples, centrifugation at 10.000 rpm for 15 minutes was used. The degradation of dye was monitored using a UV visible spectrophotometer. The removal rate of dye was estimated using the following formula (Eq. 1):
Where C0 is the initial concentration of the dye and C is the concentration after a time interval.
Analysis of ZnO NPs and membrane characterization: X-ray diffraction (XRD), Fourier transform infrared spectroscopy (FTIR), and scanning electron microscopy (SEM) were used to assess the optical and structural characteristics of ZnO NPs. The functional groups affiliated with the surfaces of nanoparticles and other surface chemical residues of ZnO NPs were investigated using FTIR spectroscopic analysis. The obtained powder of ZnO NPs was examined using FTIR analysis with a scan range of 4000-400 cm−1. The shape and size of ZnO NPs obtained by fenugreek leaf extract were determined using SEM analysis. The XRD was performed using a Bruker AXS, Germany (Model D8 Advanced) diffractometer within the scanning range of 20-80° (2θ) using Cu Ka radiations of wavelength 1.5406 Å. XRD was used to detect phase and characterize the crystal structure of ZnO NPs. The Debye-Scherrer formula (Eq. 2) was used to evaluate the crystalline size (D) of the prepared ZnO NPs:
where k (value 0.9) is the shape factor and λ is the X-ray wavelength of 1.5419 Å, β is the full width at half maximum (FWHM) in radian, and θ is the Bragg angle in radian.
To determine the properties of the generated membranes, a variety of characterization techniques were used. The functional groups on the membrane surface could be determined using the FT-IR spectroscopic apparatus with IR (Model: Perkin Elmer Spectrum RX I). The contact angle is used to gauge the hydrophobicity of the membranes. It is determined using a Theta optical blood pressure monitor and an automated liquid pumping system. The membrane porosity (%), which is computed as the difference between the volume of voids contained in the membrane and the total volume of the membrane, was measured using the gravimetric technique, as previously described [14]. The method involves weighing the membrane in both dry and wet conditions (kerosene for 24 hours). The porosity was determined using Eq. (3):
Where: ε is the membrane porosity (%); Ww is the weight of the wet membrane; Wd is the weight of the dry membrane; ρi is the kerosene density (i.e., 0.82 g cm-3); and ρp is the CA density (i.e., 1.28 g cm-3).
The membrane’s water content was assessed after soaking in water for 12 hours. After being weighed, the membranes were wiped with blotting paper. The dry membrane mass was separated from the wet membranes, which were then dried for two hours at 60ºC in a vacuum dryer. The percentage water content was obtained using Eq. (4).
Where Ww is the weight of the wet membrane and Wd is the weight of the dry membrane.
For each membrane, three measurements were performed, and then the average value and standard deviation were calculated.
Filtration application: A crossflow system was used to evaluate the membrane’s properties (Scheme 1). The permeate flux Jw (L/h m2) was measured as a function of the transmembrane pressure, P (bar), which was changed from 0 to 5 bar, to ascertain the membrane’s water permeability, Lp (L/h m2 bar). Using Equations (5) and (6), the following values for flux Jw and permeability Lp were calculated:
Where Q is the quantity of permeate (L); A is the effective membrane area (m2); and ∆t is the operation time (h).
The transmembrane pressure used for the Malachite rejection studies ranged from 3 to 6 bars. Between pH 3 and pH 11, at a feed concentration of 50 ppm, the impact of feed pH on dye rejection was examined. From 0.3 to 1.1 g.L-1, the ionic strength was changed to examine its impact. Additionally, the impact of dye concentration was examined from 25 to 75 ppm. Eq. (7) was used to determine the dye rejection R (%):
Where Cp and Cf are the concentrations of permeate and feed solutions, respectively.
The permeate concentration was measured by an ultraviolet (UV)-visible spectrophotometer (Lamba 2, PerkinElmer) using quartz cells. All measurements were made at the wavelength corresponding to the maximum absorbance (λmax) for Malachite, which was 465 nm.
Cleanability and recovery of the membrane: the dye retention and recovery of the CA membrane without ZnO NPs (M0) and the CA membrane with ZnO NPs (M1) were determined after backwashing. A pressure of 4 bars with a concentration of Malachite dye (25 mg/L), pH 3, and 0.5 mg/L NaCl was used after cleaning. Flushing was performed with distilled water. The effectiveness of the cleaning protocol was calculated using the dye retention recovery ratio: DRR = Dc/Do, where: Dc = Retention after cleaning the membrane; Do = Retention of the virgin membrane.
Statistical analysis: All results presented are the means of three independent replicates. The data was subjected to statistical analysis by a statistical package SPSS v17. The mean difference comparison between the treatments was analyzed by t-test or analysis of variance (ANOVA) and subsequently by the Tukey HSD test at P<0.05.
Results and Discussion
ZnO Nanoparticles (NPs) Characterization
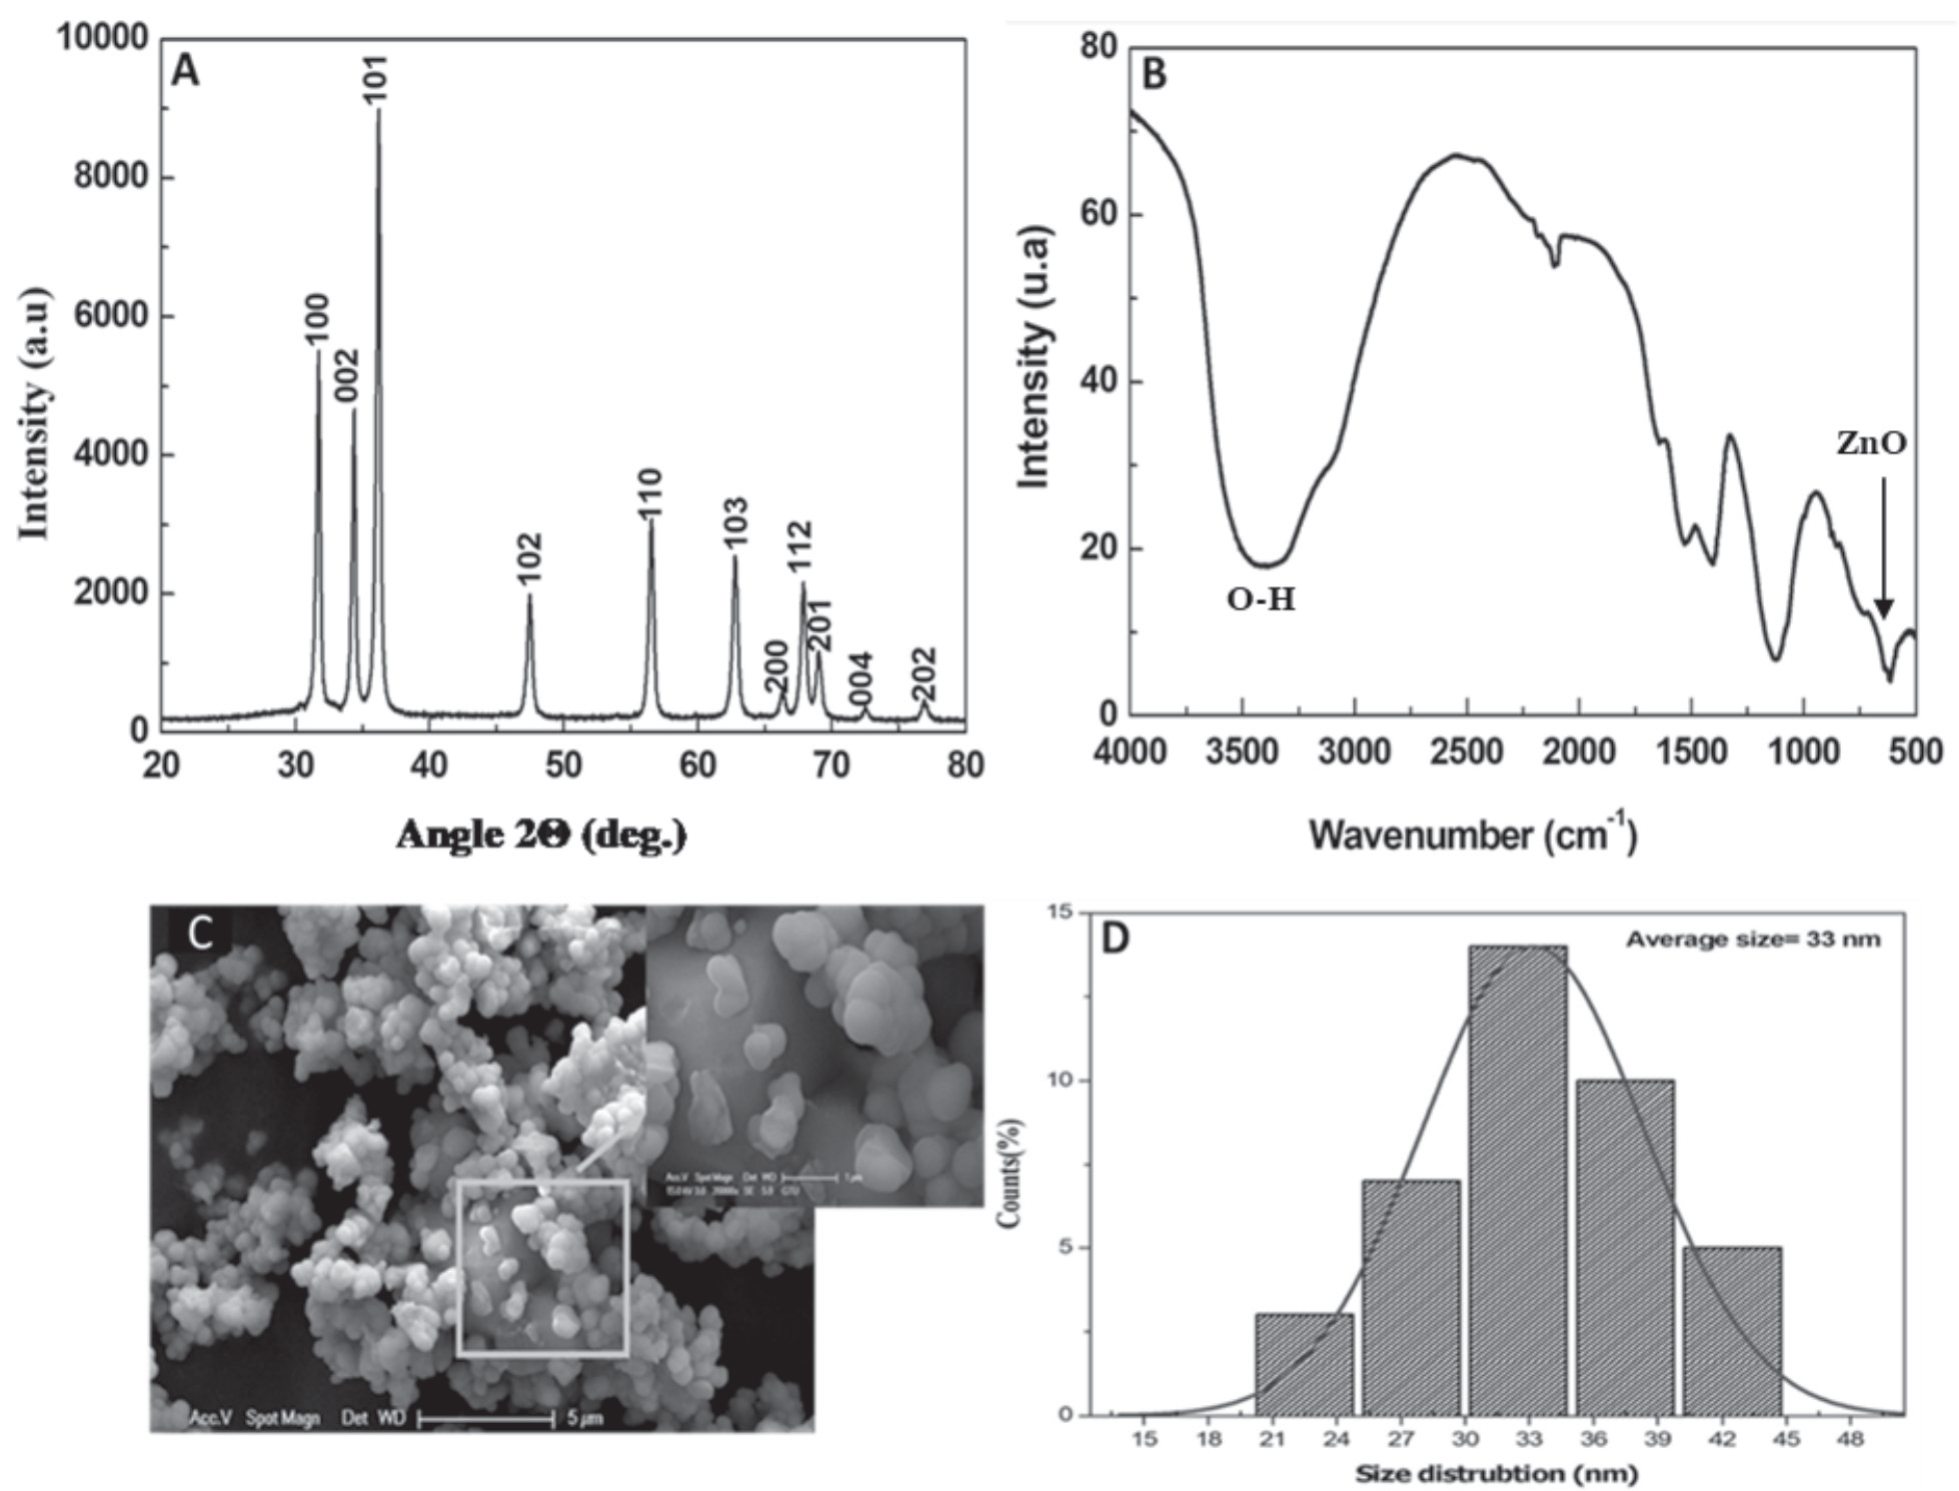
In the present study, a color shift from yellowish to white designed the formation of ZnO NPs through fenugreek leaf extracts. Zn ions were converted to ZnO NPs by flavonoids and phenolic compounds. The solution’s color suddenly changed after several hours, revealing that the ZnO salt had been completely bioreduced into NPs (Fig. 1). The structural characteristics of the synthesized ZnO NPs were defined using an X-ray diffractometer, which is employed to determine the nanoparticles’ ZnO structure phase. As shown in Fig. 2A, the X-ray diffraction pattern of zinc oxide nanoparticles demonstrates distinct line broadening of the X-ray diffraction peaks, suggesting that the obtained powder was of nanometric size. In addition, the XRD pattern of ZnO NPs demonstrates an intense peak that clearly shows the purification and crystalline structure of biosynthesized ZnO NPs. The 2Ө angles of the diffraction peaks were situated at ~ 31.63°, 34.30°, 36.22°, 47.88°, 56.87°, 62.99°, 66.44°, 67.85°, 69.11°, and 72.56° linked to the (100), (002), (101), (102), (110), (103), (200), (112), (201), (004), (202) and (104) planes of hexagonal Wurtzite structure of ZnO NPs (JCPDS 36-1451), respectively. The above peaks are like those discovered in earlier studies [15]. All the sharp peaks were found to be ZnO-NPs, and no such impurities were discovered in the green synthesis product. The particle diameter measured for more intense peaks corresponding to 101 planes located at position 36.22° using Scherer’s formula was found to be about 34 nm. According to the FTIR spectrum evaluated at a scan range of 4000-400 cm-1, the functional groups responsible for the formation of ZnO NPs with fenugreek leaf extract were described. The appearance of zinc oxides is affirmed by the peak at 520 cm-1 [16, 17]. The peaks at 865, 1105, and 3445 cm-1 correspond to the existence of CH, C-OH, and OH groups, which indicate the ability to bind to zinc and possibly lead to the reduction of zinc ions (Fig. 2B). The presence of these functional groups describes their importance in the bioreduction and capping activities connected with NP synthesis. The microscopic analysis confirms the formation of zinc oxide nanoparticles, which were found to be spherical in shape. Some of the ZnO NP nanoparticles were agglomerated, as confirmed by the SEM image in Fig. 2C). The particle size distribution curve of ZnO NPs is shown in Fig. 2D), and the size of the particles of the ZnO NPs is in the order of 34 nm.
Photocatalytic Test
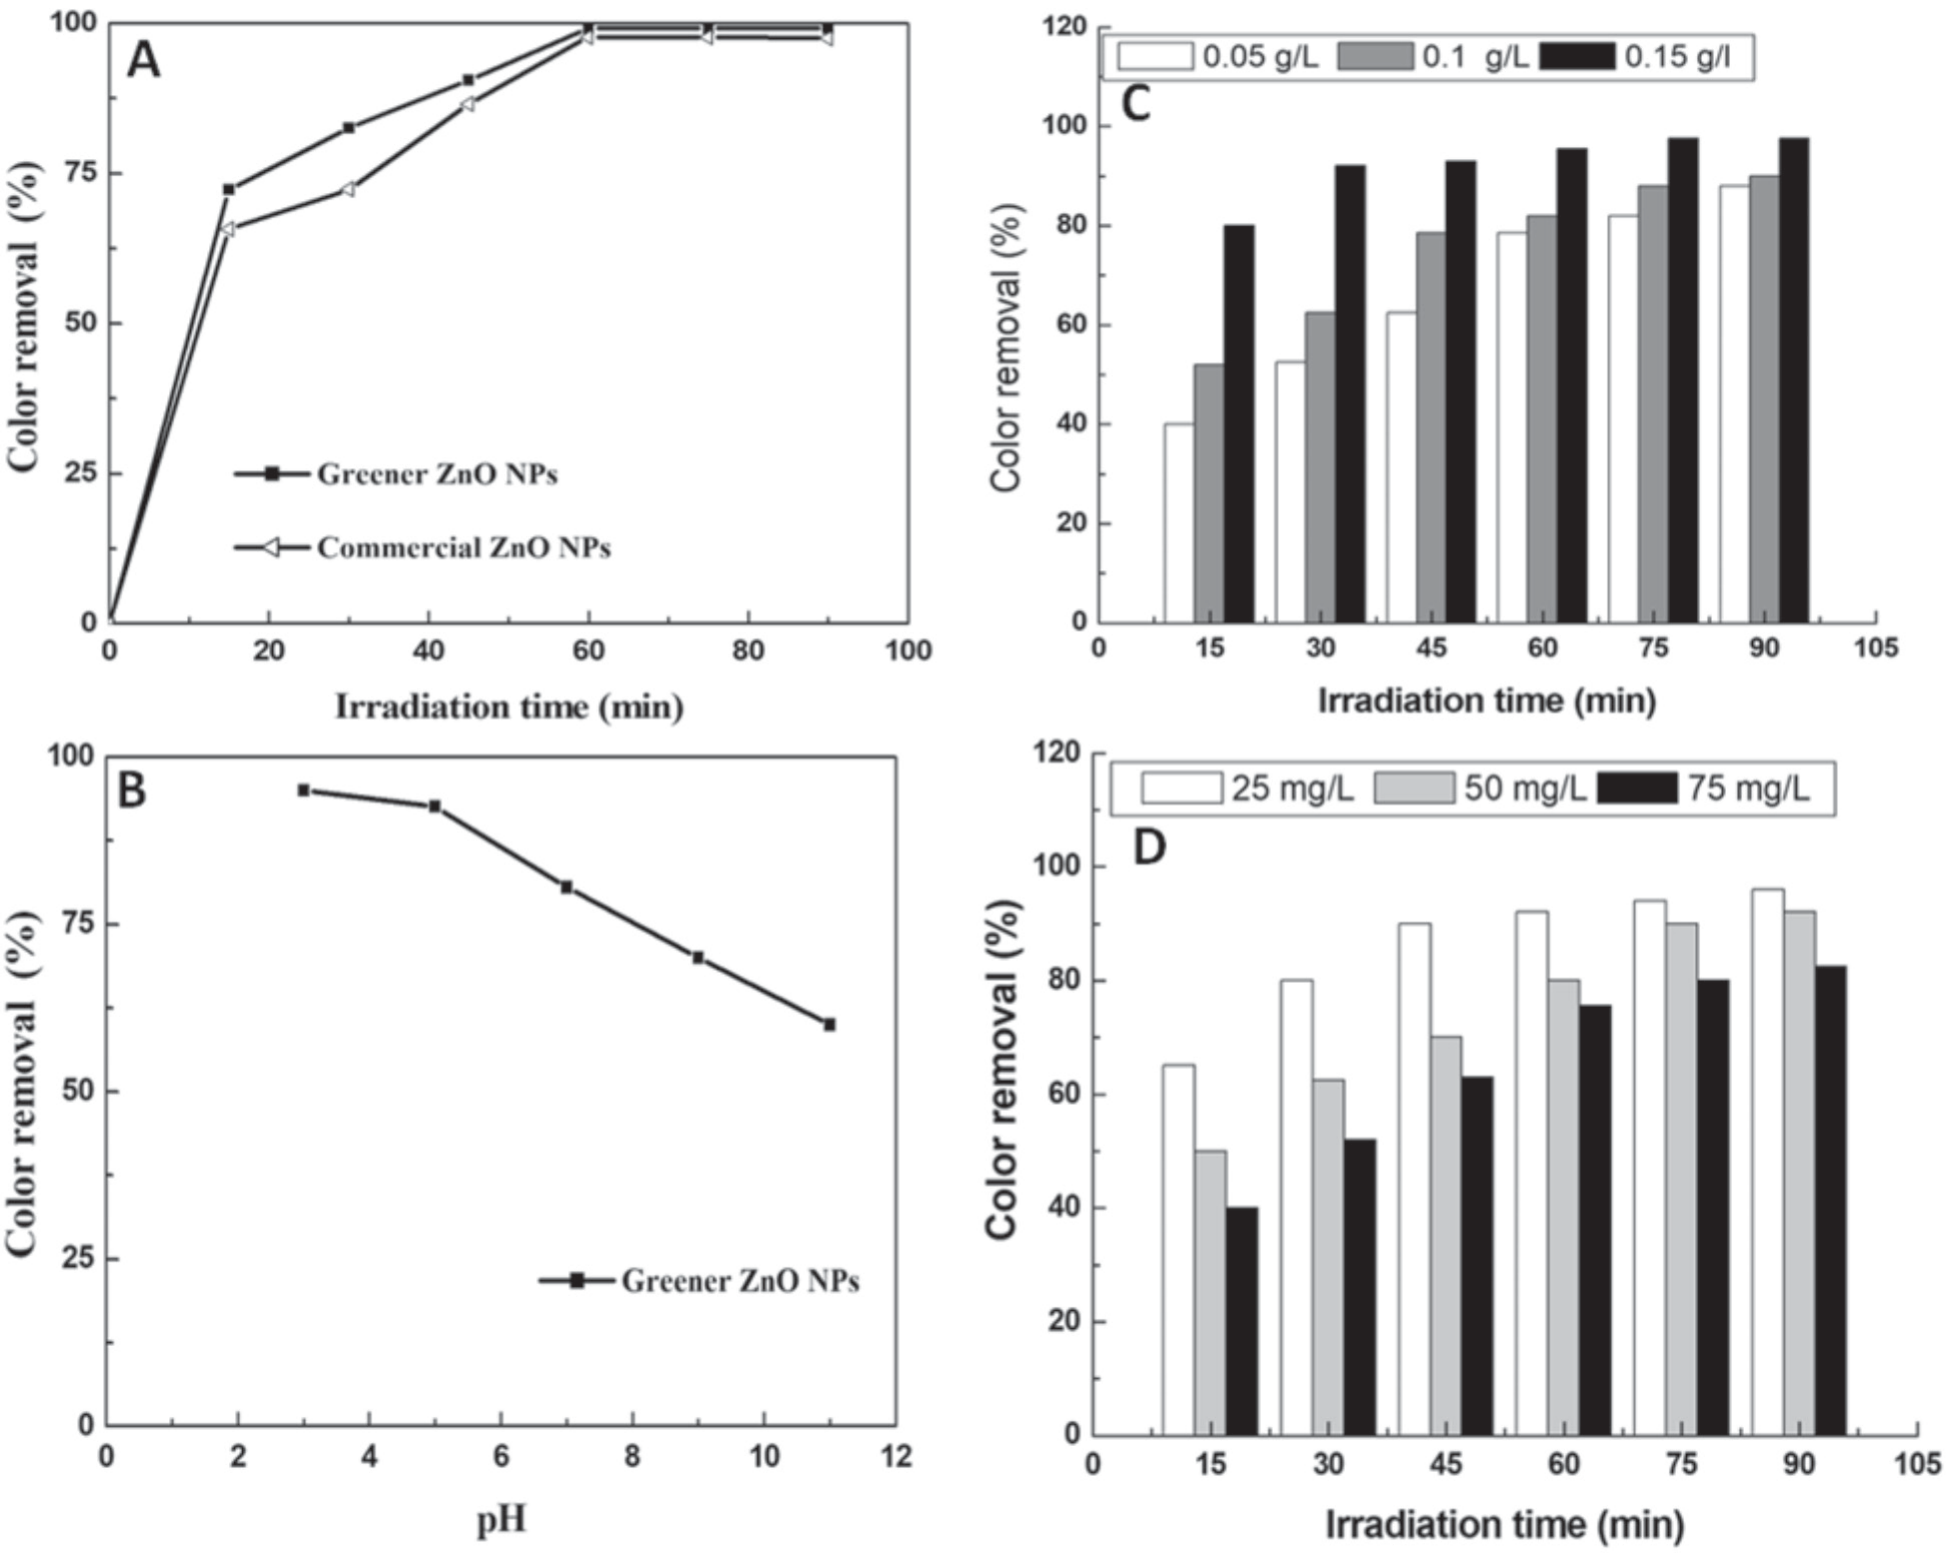
ZnO NPs are being used to analyze the degradation property of Malachite in an aqueous medium under UV light illumination for photocatalytic activity. The pH, catalyst loading, and dye concentration were used to evaluate the greener catalyst’s functional usefulness in comparison to commercial ZnO. In both samples, the catalyst concentration was 0.15 g/L. Similarly, degradation percentages were reported after the 60-min irradiation time (Fig. 3A). This was a significant advancement in the synthesis of ZnO because the resources used in its creation were naturally present, and the simple synthesis method did not necessitate any other inorganic materials. Studies [18-21] demonstrate the photocatalytic activities of ZnO NPs in plant extracts. When ZnO NPs absorb photons with energies greater than their band gap energy, photocatalytic activities are triggered by lighting [15, 17].
pH Effect
The pH of a solution is a useful characteristic for analyzing photocatalytic activity because it provides information about the surface property [22, 23]. Photocatalytic efficiency is significantly influenced by the material’s surface charge characteristics, the charge of the molecules, their adsorption on the photocatalyst surface, and the number of reactive species [24, 25]. Fig. 3B) depicts the impact of changing the pH of the initial MO solution from 2 to 11 for an initial MO concentration of 25 mg/L over a ZnO photocatalyst (0.15 g/L) and under UV irradiation. When the pH increases, the photodegradation efficiency decreases, suggesting that the dye solution’s initial pH affects organic molecules attaching to the semiconductor surface. It appears that pH values near the zero-point charge pH are preferred for dye photodegradation and subsequent adsorption. The percentage of dye removal increased as pH values decreased and peaked at an acidic pH. At lower pH values, the surfaces of the catalysts were strongly protonated and became positively charged, attracting dye cations more electrostatically to the catalyst surface as the number of oxidizing holes increased, resulting in enhanced decolorization of MO dye. Positive holes are considered the dominant oxidation species at an acidic pH, whereas hydroxyl radicals are considered the predominant species at a neutral or alkaline pH [26, 27]. The maximum degradation of MO dye using a ZnO photocatalyst at pH 2 was 96%.
Catalyst Loading Effect
The loading of the catalyst is an essential factor in achieving a successful photodegradation process. To determine the catalyst loadings in degradation experimental studies, various doses, ranging from 0.05 g/L to 0.15 g/L, were used (Fig. 3C). Nevertheless, as the catalyst loading was reduced, the degradation rate slowed. Using 0.05 g/L or 0.1 g/L had no discernible effect on the rate of degradation. In contrast, when the amount of catalyst is increased to 0.15 g/L, the degradation is fast in the first 15 minutes and achieves 92% color removal after around 30 minutes of irradiation. By increasing the number of active sites on the photocatalyst surface, which also increases the amount of hydroxyl and superoxide radicals, the % of dye removal increases as ZnO concentration increases [28, 29].
Initial Dye Concentration Effect
A similar experiment was carried out by maintaining the dose of catalyst stable while increasing the concentration of dye solution from 25 mg/L to 75 mg/L (Fig. 3D). All experiments (except for 75 mg/L) achieved nearly 96% color removal. The degradation rate was considerably affected by dye concentration. As a result, for the remaining photodegradation percentages of nanoparticle ZnO NPs, the dye concentration was fixed at 25 mg/L. As an outcome, it is expected that increasing the concentration of MO will enhance with oxidizing agents, improving the degradation process. In contrast, the efficiency of the dye’s degradation increases as the initial concentration increases [17].
Plausible mechanisms: By incorporating micrometer and nanometer sized inorganic oxide particles into the polymeric casting solution or by synthesizing them on-site, organic-inorganic hybrid membranes can be made. Few researchers have noted the combination of organic polymers with inorganic substances such as alumina, titanium, silica, etc. The assembly of engineered nanoparticles on the surface of porous membranes or the mixing of them with polymeric casting solution are two methods used in recent years to construct nano inorganic mixed matrix membranes. The type of attachment bonds between the polymer chains and inorganic phases in the composite fabric, as well as the degree of cross-linking of the polymeric matrix, will affect the membrane’s structure. We have focused on creating inexpensive, inorganic membranes with a decent yield and performance as their main characteristics. During the manufacture of membranes, interactions between the surface of nanoparticles and polymer chains and/ or solvents result in membranes with the desired structure. These structural alterations produce optimal selectivity and permeability for gas separation as well as adequate performance in membranes for nano and ultrafiltration. The other goal is to control membrane fouling that is brought on by hydrophilic functional groups of nanoparticles. The inorganic phase’s presence can also be employed to limit the polymer chains’ molecular motions and increase the mean distance between them. Limited molecular movements and a favorable rise in the mean distance between chains can lead to simultaneous improvements in membrane porosity, stability, and performance. Fig. 1C depicts the plausible photocatalytic degradation mechanism of MO by ZnO NPs under UV light. Once the ZnO NPs were exposed to UV light, conduction band electrons (e-) and valence band holes (h+) were established on the catalyst’s surface. The holes formed extremely reactive hydroxyl radicals (•OH) when they reacted with water, while oxygen created a superoxide radical anion (•O 2–). As an outcome, the strong radicals •OH and •O2- were primarily responsible for the degradation and fading of MO dye, as published in many previous papers [18, 19]. Therefore, the ZnO NPs’ large surface area resulted in excellent photocatalytic activity.
Membrane Characterization
Fourier Transform-Infrared Spectroscopy Analysis
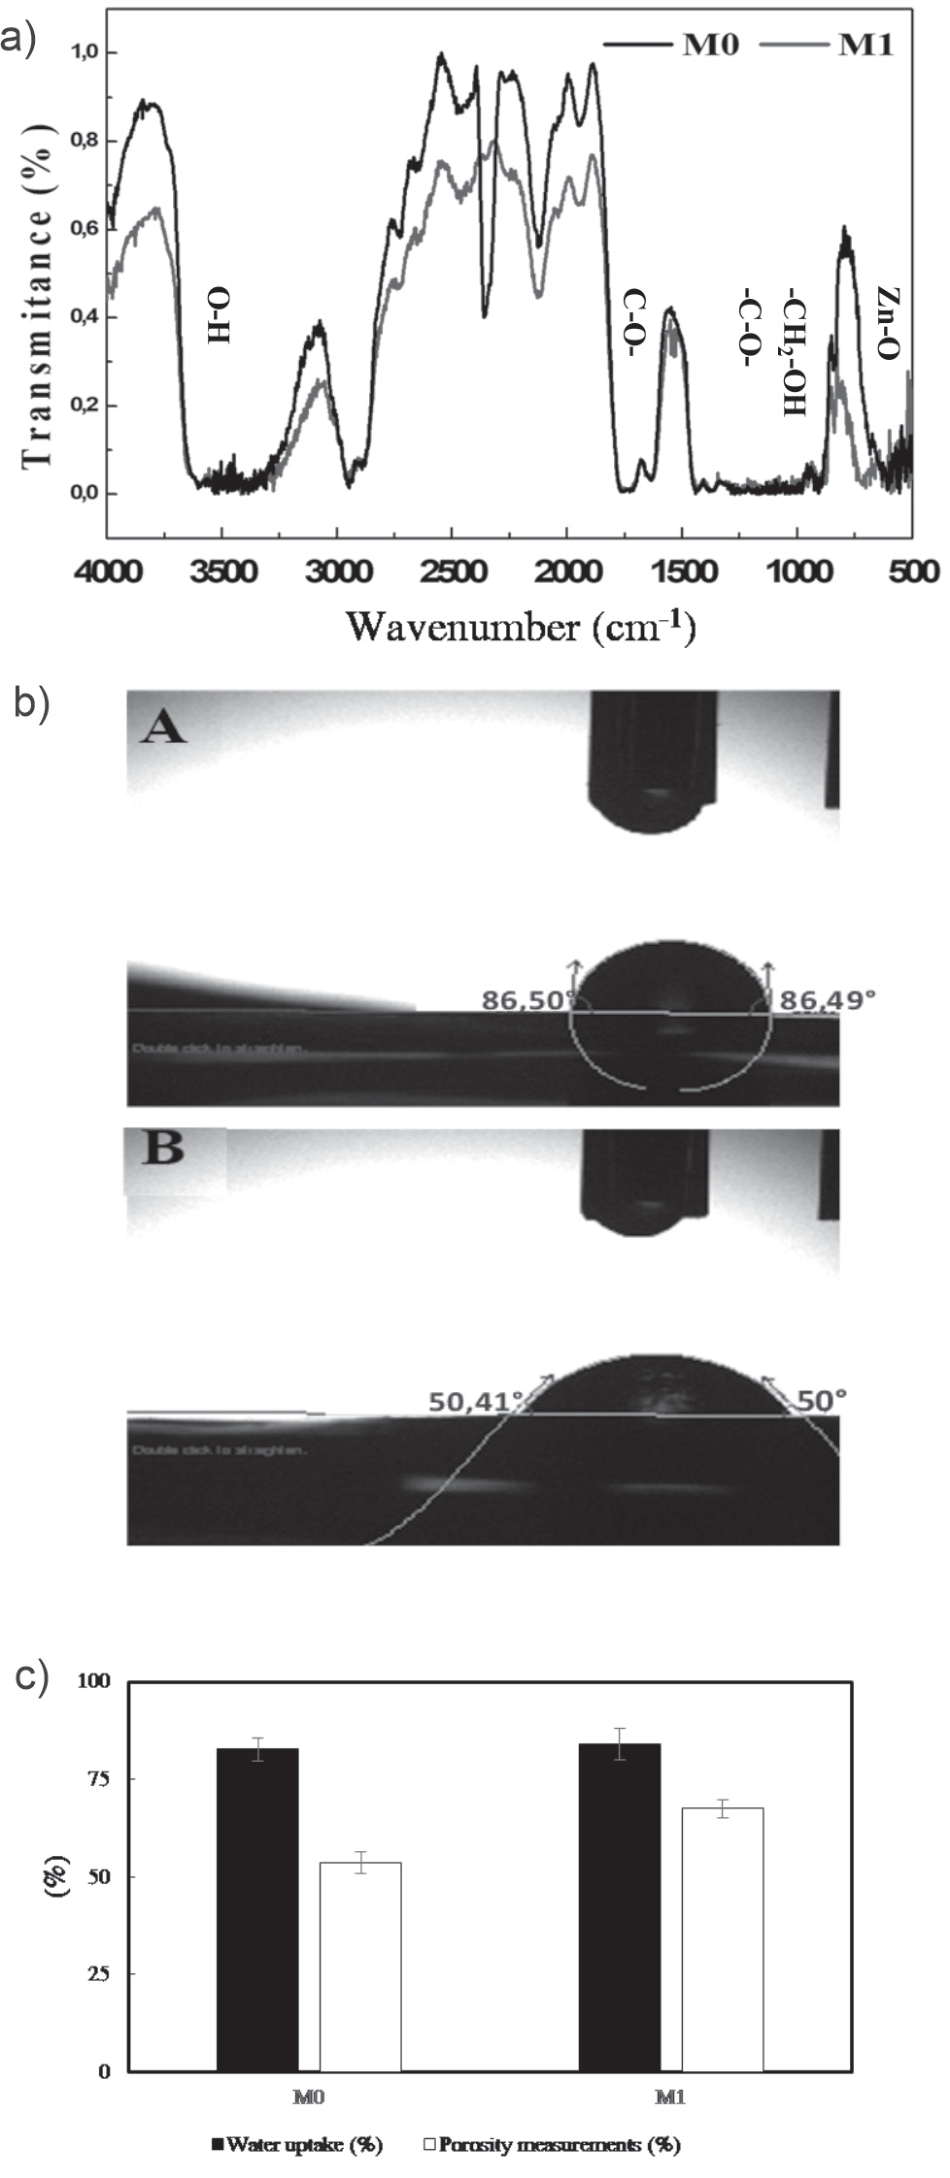
Although IR spectroscopy is a very potent characterization method for detecting chemical groups and gaining a plethora of microscopic information on their conformation and potential interactions, it was employed to confirm the impact of biosynthesized ZnO NPs on the vibration characteristics of membranes. The FTIR spectra of CA nanocomposite membranes (M0 and M1) are shown in Fig. 4A). ZnO NPs were incorporated as a modifier oxide. DMF and PEG 1000 were used as additives in the matrix (i.e., CA). The addition of ZnO NPs is intended to improve the thermal properties, hardness, and density of the membranes. We observed the emergence of a high-intensity wide band in the wave number range of 2900-3500 cm-1. The band might be related to the hydroxyl groups’ stretching vibration [30]. Additionally, a medium-intensity band that appears at 720 cm-1 is connected to the stretching vibrations of Zn-O [13].
Water Contact Angle Measurement
One of the crucial characteristics of membranes that could have an impact on their ability to flow and resist fouling is their surface hydrophilicity. As shown in Fig. 4B), the addition of ZnO NP regularly reduces the contact angle of the integrated membranes. The presence of biosynthesized nanoparticles increased the hydrophilicity of the membranes because the low angle of contact indicated a high hydrophilicity. The contact angle was reduced from 86° to 50° for membranes composed of CA complexed with 0.05 g of ZnO NPs. Other studies have shown that the presence of nanoparticles induces a lower aggregation and high hydrophilicity [13, 31].
Water content and porosity study: The results of Fig. 4C) show that the addition of ZnO increases the porosity. Gaps are created in the polymer matrix due to the separation of the polymer chains caused by the presence of NPs, which increases the water flow. The ZnO oxide induces the hydrophilicity of the membrane surface [13, 32].
Scanning Electron Microscopy (SEM) Analysis
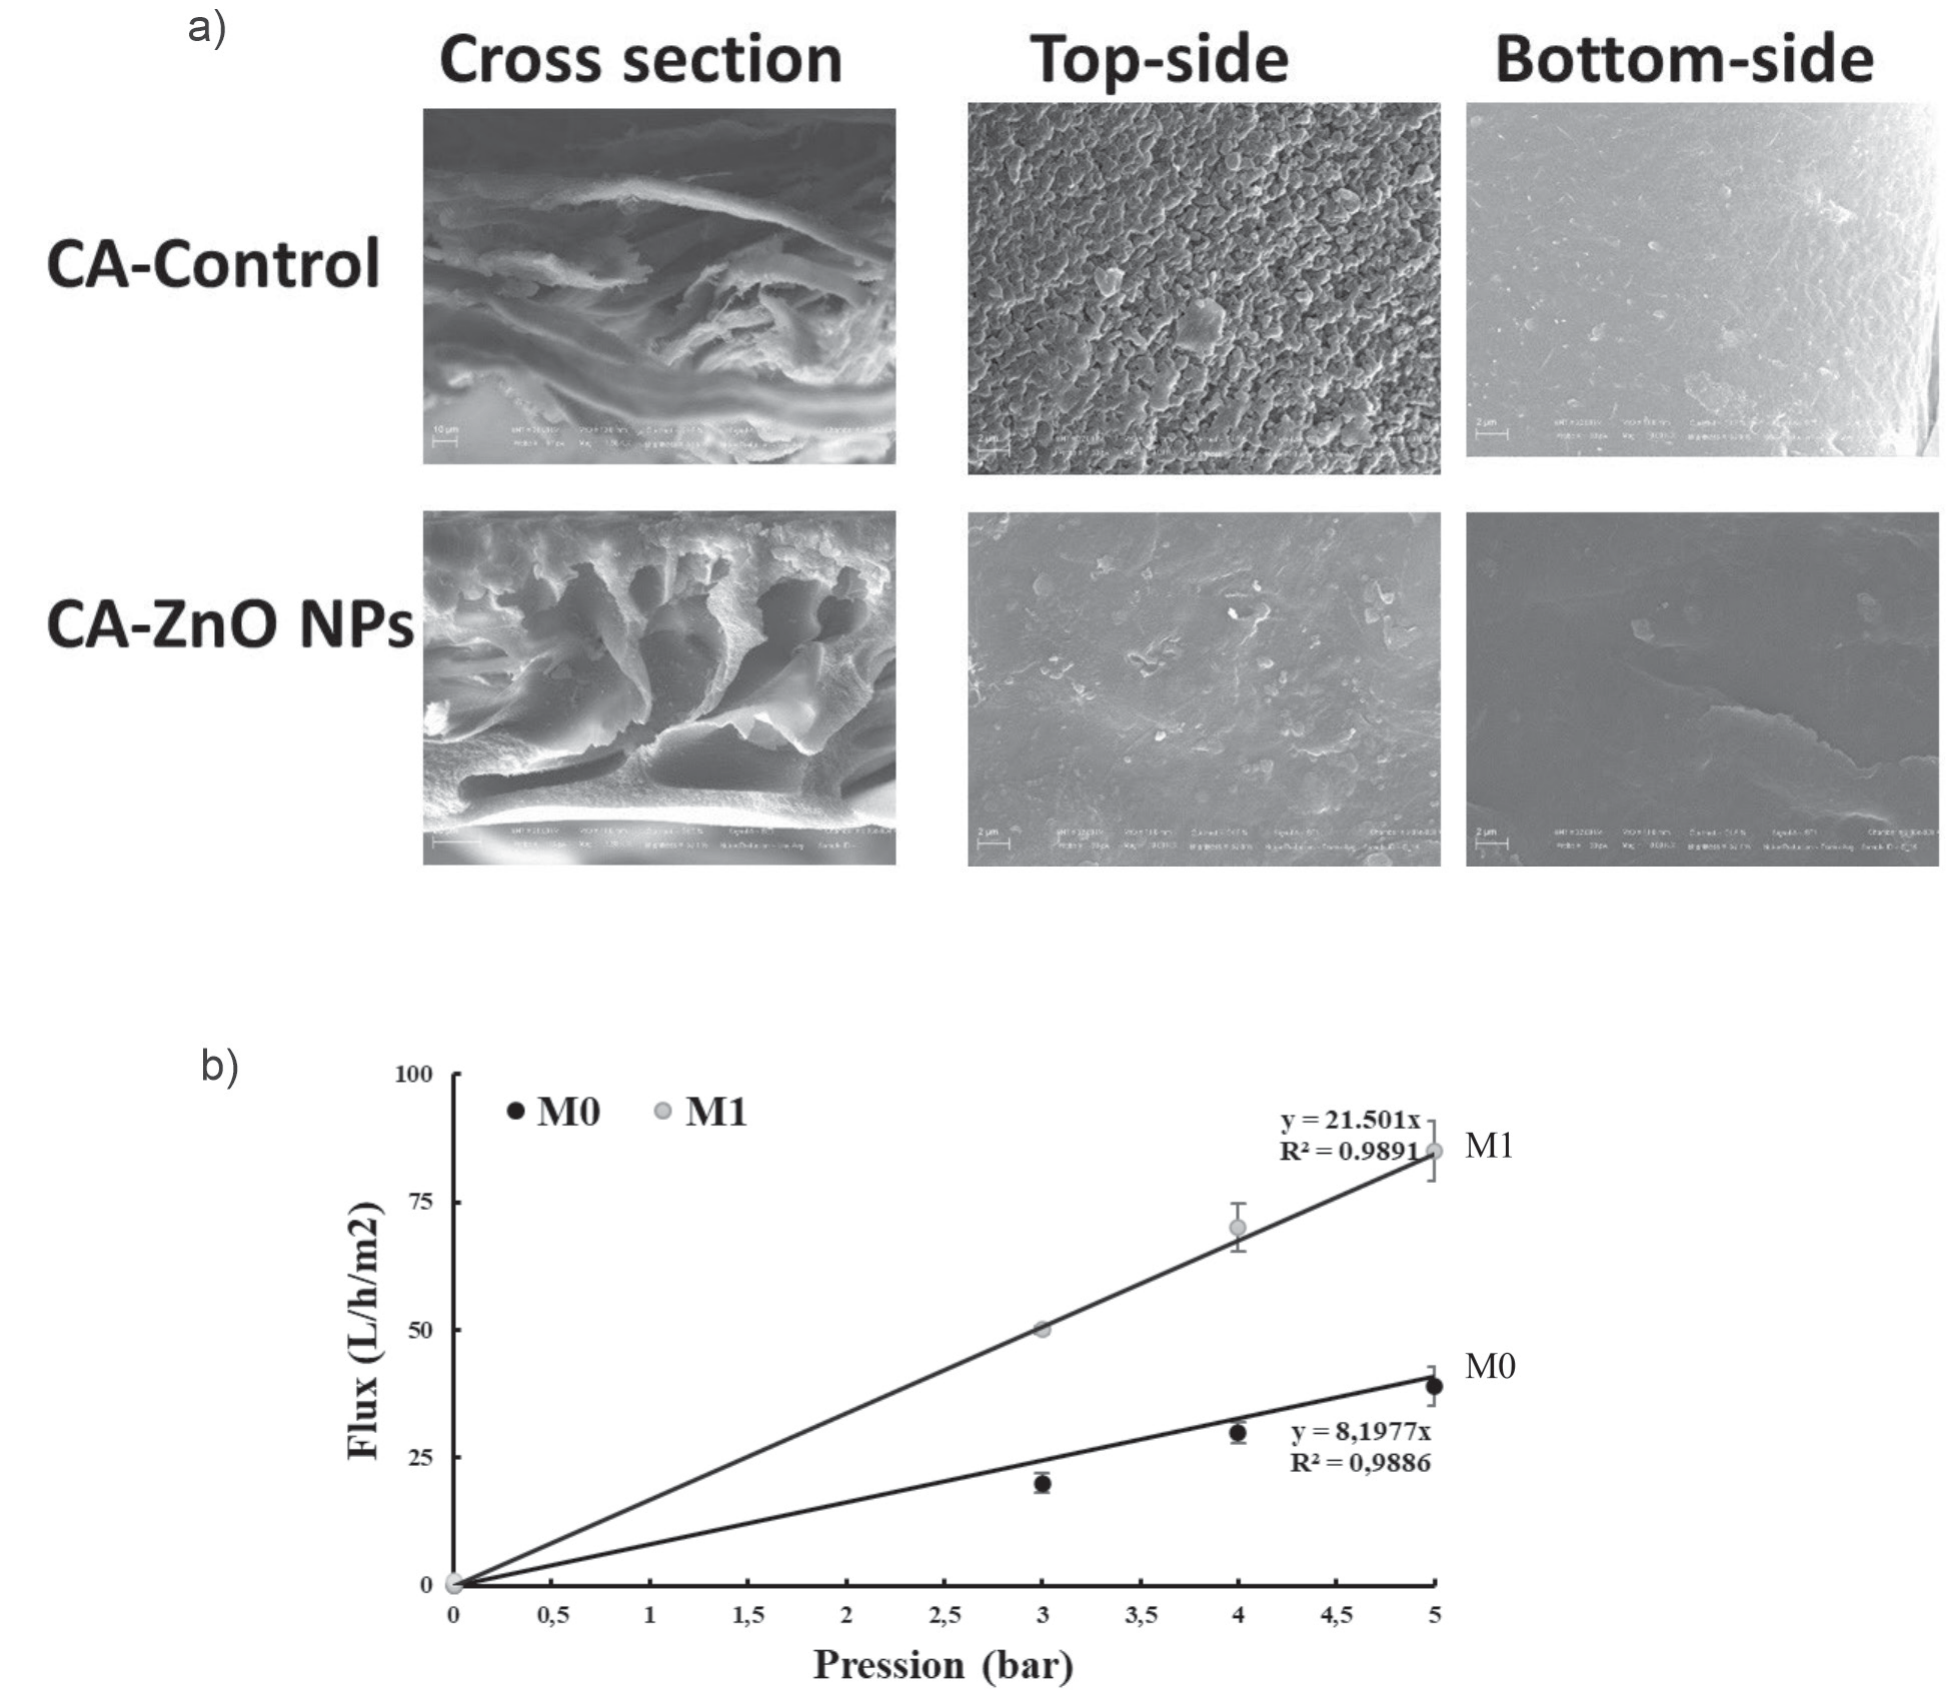
The images emitted from the cross section and the upper surface are presented in Fig. 5A). The shape of the cellulose membranes is asymmetric and contains a dense layer supported on a porous substructure with macro-voids, although both surfaces are homogeneous, smooth, and dense. The upper layers of the membranes control the rejection and limit the flow [13]. The pores are numerous in the membrane layers rich in ZnO NPs compared to the controls.
Fig. 4.
A) Infrared (IR) spectrum, B) Water contact angle, and C) Water uptake (%) and porosity measurements (%) of the bare and the nanocomposite membranes without ZnO NPs (M0), CA membrane with ZnO NPs (M1).
Water permeability: In terms of water permeability, the performance of the membranes was analyzed. The results of water flow as a function of pressure are presented in Fig. 5B). The water flow depends on the pressure in accordance with Darcy’s law. The water permeability for the tested membranes (M0) = 9.4596 L h-1 m-2 bar-1 and (M1) = 21.501 L h-1 m-2 bar-1 were determined. This permeability represents the initial state of the membranes. The flow increased linearly with the pressure, and the membrane had a lower flow rate than the membrane rich in ZnO NPs.
Filtration of Dyes
Pressure Effect
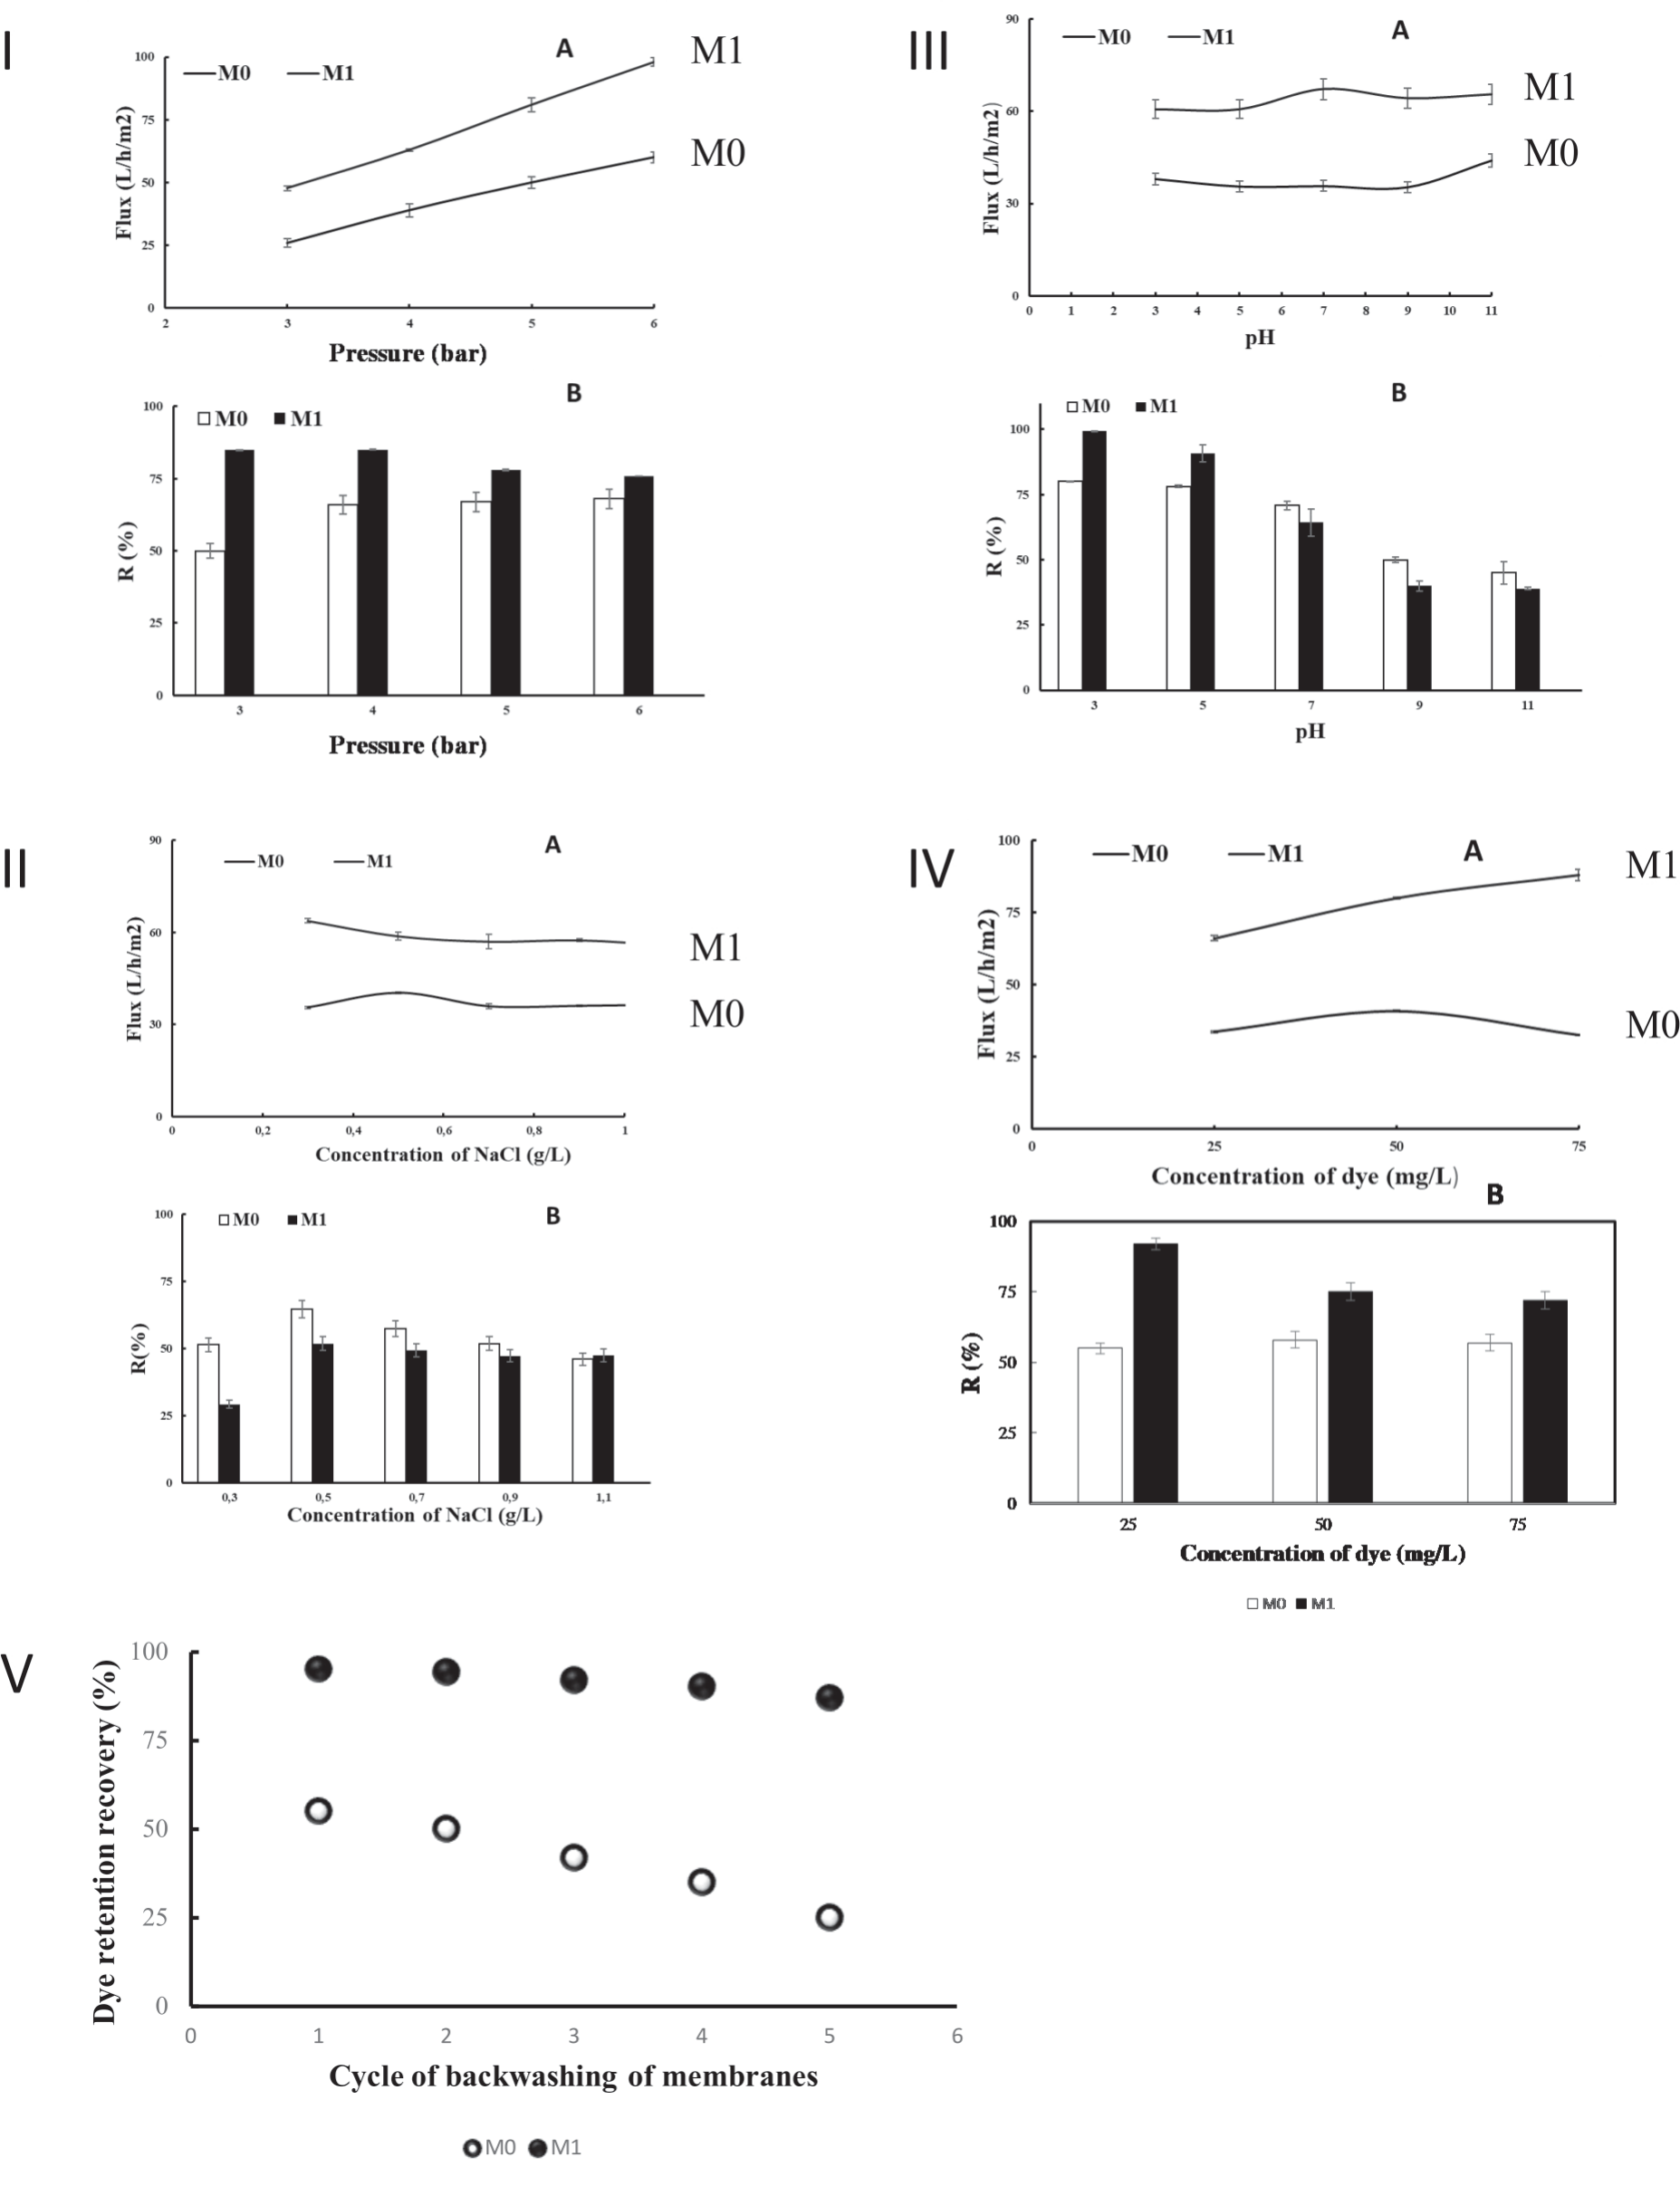
The effect of the transmembrane pressure on the retention and flow of Malachite permeate (50 mg L-1) was determined for pressures varying from three to six bars using membranes rich or not in ZnO NPs. The pressure has a significant effect on dye retention (Fig. 6IA). The permeate flow rate increased proportionally with the pressure (Fig. 6IB). A higher permeate flow rate would result from a higher permeate pressure [33, 34].
Ionic Strength Effect
The effectiveness of treatment techniques such as adsorption or biological treatment was generally affected by the presence of different substances, such as salts, acids, and alkalis, in textile effluents. The variation in the retention rate of the Malachite and the permeate flow in the presence of different concentrations of NaCl affects the efficiency of the ultrafiltration process. The dye concentration was fixed at 50 mg L-1, the NaCl content varied from 0.3 to 1.1 g L-1, and the pressure was constant at four bars. When the NaCl concentration increased, the retention rates of the Malachite anionic dye significantly decreased (Fig. 6IIA). It seems that the electrostatic interaction between the dye molecules and the membrane surfaces with many charged groups is reduced when there is a high concentration of NaCl. The NaCl content significantly affects the permeate flow (Fig. 6IIB). As previously described, during the membrane complexation process with the dye, the chloride ions compete with the anionic dye [35].
ph Effect
The pH value affects the level of ionization of the dye. This could have an impact on the stability of the complex and, consequently, on the dye retention rate. The pH varies from 3 to 11, the dye concentration is 50 mg L-1, and the transmembrane pressure value is about 4 bars. It can be seen from Fig. 6IIIA) that for the pH levels of 3 and 7, the rates of Malachite rejection varied from 78 to 100%. The removal of the Malachite decreases for M0 and M1 from pH = 9. For this reason, it is necessary to take into account the electrostatic interactions between the charged dye molecules and the membrane surfaces with multiple charged groups. The membrane possessed a net positive charge at low pH levels compared to negatively charged dye molecules (Fig. 6IIIB). As a result, the dye molecules are strongly attracted to the membrane surface, where many of them already occupy potential adsorption sites. A low rejection of the dye results from the free passage of the remaining molecules through the pores. The electrostatic contact between the membrane and the solute molecules becomes repulsive when the pH increases, resulting in a markedly increased rejection of the solutes. The positive membrane charge becomes negative when the pH increases [36, 37]. Studies have been carried out on supported lipid bilayers using ZnO and TiO2 NPs. These experiments showed that ZnO with a pH range from 7 to 8.5 had a variable zeta potential (ZP) and that the dispersions were stable, and positively charged (pH 7.4 and ZP +3 mV). The ZnO suspension is generally coagulated at low ZPs [38]. The dispersions are stable and the surface is positive in the fluctuations of ZnO ZP with a pH range of 5 to 9 [39].
Dye Concentration Effect
The filtration of the anionic dye at a constant pressure of four bars makes it possible to demonstrate the effect of the concentration of the dye on the rejection and the flow displayed in Fig. 6IVA). The retention rates were about 94 and 52% for the dye concentrations of 50 and 75 mgL-1, respectively. These results suggest that the dye molecules and the ZnO NPs were competing throughout the process of dye-membrane complexation. These results also corroborate those observed previously [40]. In addition, the permeate flow rate of the NPs ZnO-rich membrane (M1) was greater than the control membrane flow rate (M0) (Fig. 6IVB). This could be explained by the reduction in the diameters of the pores of the nanoparticle-rich membrane. We assume that more factors interfered with retention. One of the causes could be the presence of certain dye molecules that aggregate. Aggregation becomes more powerful as the concentration of the molecules increases [41]. The creation of a secondary polarization layer in the form of gel serves as an additional barrier to the passage of dye molecules and reinforces rejection [42].
Fig. 6.
[I] Transmembrane pressure effect at C = 50 ppm, [II] pH effect at ΔP = 4 bars and C = 50 ppm, [III] Salts effect at C = 50 ppm, and [IV] Effect of the concentration of malachite dye (mg/L) on permeate flux and retention at ΔP = 4bar of CA membrane without ZnO NPs (M0), and CA membrane with ZnO NPs (M1). [V] Dye retention recovery.
Dye Retention and Recovery
After five cycles of photodecomposition, the dye retention recovery of ZnO NPs-membranes does not change significantly. The dye retention recovery for the five runs was reduced from 95% to 87%, indicating that CA membranes with ZnO NPs (M1) are more durable and recyclable (Fig. 6V). CA ZnO NPs-membranes can be used more than five times with only a slight decrease in efficiency (9%) compared to CA membranes (55%). Our results are in accordance with those of Pramono et al. [43], who evaluated the enhancement of dye filtration performance by mixed matrix membranes. The nature of CA ZnO NPs-membranes after reusability depends on the specific application. However, in general, ZnO remains a highly active material with a high surface area after reusability [44].
Conclusions
The field of the membrane industry is one of the most important industrial fields worldwide, particularly in the Kingdom of Saudi Arabia. This is due to the presence of membranes in many sectors, most notably the automotive filter industry. In the chemical industry, the most important are the separation of petrochemicals, fertilizers, and pesticides, as well as membrane tanks approved for water treatment. Membranes have also been used in the pharmaceutical industry and biotechnology. Our work in this field has improved the capacity of the membrane by integrating it with nanoparticles. This product has allowed the treatment of water and the removal of colorants with high efficiency (removal of 99% of dye, Fig. 6). Applications of nanoparticle-coupled membranes to remove malachite dye from water result in the removal of dye with different efficiencies depending on acidity, pressure, NaCl, and dye concentrations. Membrane technologies are among the most used processes to produce clean water. The interesting findings offer important information about the development and manufacturing of high-performance ultrafiltration membranes for the removal efficiency of positively charged dye aqueous solutions.

