

Introduction
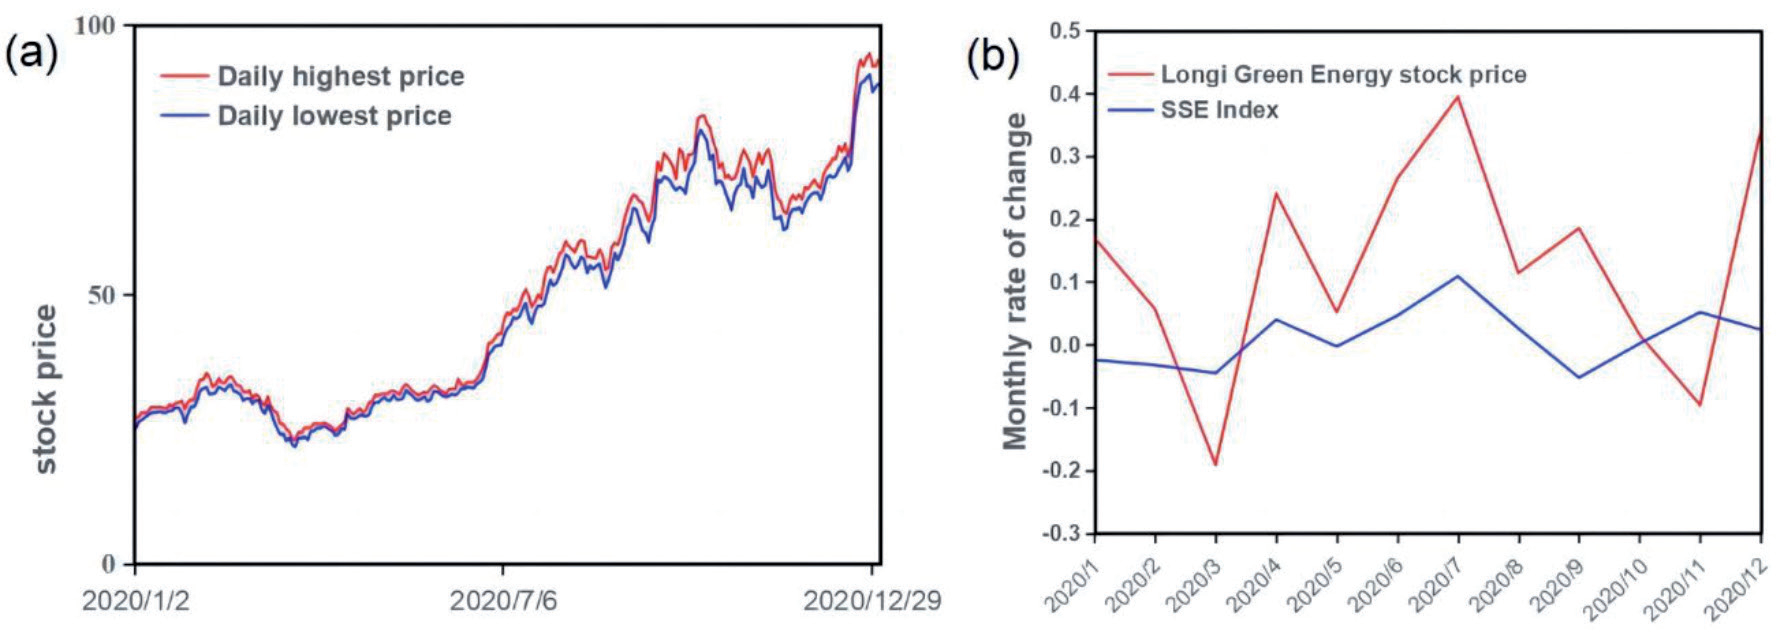
The development of China’s Energy Conservation and Environmental Protection (EEP) industry is mainly influenced by policy. During the 14th Five-Year Plan period, the EEP industry is in a new strategic opportunity period, and the demand for environmental protection products and services in the domestic market is growing yearly. Enterprises are actively engaged in technological innovation and product upgrades, which have improved their competitiveness and corporate performance, and investors are increasingly enthusiastic about investing in related listed companies. Stocks of energy-saving and environmental protection concept-related enterprises such as Lonji Green Energy Technology Co., Ltd., Hengli Petrochemical Co., Ltd., TCL Zhonghuan Renewable Energy Technology Co., Ltd., and Sinoma International Engineering Co., Ltd. have performed outstandingly (shown in Fig. 1). In 2020, the stock price of Longi Green Energy Technology rose by more than 100% in one year, while the Shanghai Stock Exchange (SSE) index only increased by about 14% in the same period. Studying the relationship between a company’s financial performance and its share price can provide a more accurate assessment of the company’s operating conditions and development potential, as well as a judgment of the company’s investment value and investment risk. Especially now that energy conservation and environmental protection concept stocks are so popular, the share prices of related companies are more volatile in this situation, and the share prices tend to deviate from the actual value and appear to be inflated, so it is necessary to be more cautious in assessing the company’s financial condition and judging whether the company’s shares are worth investing in.
The share price is the market price of a company’s shares on a stock exchange or other trading venue. Investors and companies can obtain a wealth of information through share prices. By analyzing the share price, investors can understand the position of a company in the EEP industry, its operating conditions, and future development trends, judge the investment value and risk level of a stock, and select stocks with the potential for investment to obtain higher investment returns. Companies can also use share prices to assess their position in the industry, formulate development strategies, attract more investor attention and financial support, and provide more opportunities and resources for their development. Therefore, the study of share prices is of great importance to both investors and companies. Share prices are influenced by a variety of factors, including financial performance information, the market environment, industry outlook, policies, and regulations. Among them, financial performance information is highly standardized, comparable, and quantifiable and is one of the pieces of information publicly disclosed by companies. In contrast, information on a company’s market position, brand image, and management team is more subjective and difficult to quantify, requiring investors to conduct in-depth research and analysis.
The share price is the market’s response to the value of a business. Extensive research in the fields of finance and corporate valuation consistently demonstrates a strong correlation between the financial performance of a company and its intrinsic value [1]. Robust financial performance, characterized by consistent revenue growth, healthy profitability margins, strong cash flow generation, and efficient utilization of assets, tends to positively impact the valuation of a company. Hence, the financial performance of a company exerts a significant impact on the upward and downward movements of stock prices [2]. Investing based on a company’s value reduces investment risk and provides stable long-term returns compared to short-term speculative trading. Research on the relationship between financial information and share prices began in the 1960s. Ball found that accounting surpluses were significantly correlated with abnormal stock returns [3] and this finding laid the foundation for subsequent research on the relationship between financial information and share price effects. From an econometric viewpoint, the Ohlson model quantifies the association between financial indicators and stock prices and elucidates the significance of financial information in the process of valuing stocks, while demonstrating that a firm’s excess profitability and net assets per share have a positive impact on stock value [4]. Brown’s study found a contemporaneous association between financial performance indicators and changes in stock prices and stock returns, and investors will use Investors use financial data to determine the current business status and growth prospects of companies when analyzing stock prices. There is a significant change in stock prices before and after the disclosure of financial information [5]. The financial performance indicators disclosed in the accounting statements contain information on the profitability, asset size, and solvency of an enterprise, which provides investors with a basis for evaluating the value of an enterprise and making investment decisions. The extent to which different financial performance indicators explain share prices and share price fluctuations varies, and the same financial performance indicators have different degrees of influence on the share prices of different types of companies [6, 7]. For the investor, consequently, in the process of scrutinizing financial performance information, it is crucial to integrate an assortment of financial performance indicators, taking into account the distinctive characteristics of the company’s operating industry, to bolster decision-making efficacy and operational proficiency.
Fig. 1.
Stock performance of environmentally friendly concept-related stocks (taking Lonji stock as an example). a) Price change of Lonji Green Energy stock in 2020. b) Comparison of monthly changes in the Shanghai Stock Exchange (SSE) index and Lonji Green Energy stock price in 2020.
In recent years, in order to explore the mechanisms and causes of stock price volatility, the perspectives and methods used in academic research on the factors influencing stock prices have become increasingly diverse and refined. Among the methods used to study the association between financial performance and share prices are regression analysis, time series analysis, event analysis, machine learning, etc. [8, 9], To provide important guidance for constructing a stock price impact system related to financial performance, this study adopts Qualitative Comparative Analysis (QCA) to explore the mechanism by which the synergistic effects of green financial performance elements in energy-saving and environmental protection enterprises influence their stock price performance. In the academic discourse of corporate governance, QCA, as a research methodology still in its early stages, demonstrates unique adaptability in dissecting complex phenomena in social reality [10]. Through Diwanji’s study on the application of QCA in consumer behavior research, it was found that this method can help better predict and explain consumer decision-making in complex consumption environments [11]. Hanckel found an increasing application of QCA in the field of public health intervention research. Researchers use the QCA method to explore environmental factors affecting public health, affected populations, effective intervention measures, and the types of data sets that should be used to describe individual cases [12]. Cucari employed the QCA method to study the impact of board structure and a range of company characteristics on shareholder voting [13]. According to Fainshmidt, configurational thinking and fsQCA methods help scholars get closer to the complex reality of international business, thereby obtaining more precise insights [14]. Confronted with common complexities in social science research, the QCA method, with its ability to effectively identify combinations of circumstances, capture irregular patterns, and provide ultimate explanations, has become an important analytical tool. By promoting in-depth interactions between case-focused and variable-focused analysis, this method can offer rich insights on both theoretical construction and empirical validation dimensions, allowing researchers to conduct more comprehensive and meticulous examinations of corporate governance practices. The study attempts to investigate the following questions: Is there a one-size-fits-all approach when using financial performance information for investment where only one financial performance indicator can drive a company’s high stock price? What are the combinations of financial performance that lead to higher stock price performance? What relationships exist among these combinations?
The ensuing sections of our paper are organized as follows: Section 2 analyzes the mechanism between financial performance and stock price. We construct a configuration analysis framework and propose the problems that need to be addressed in the paper. Section 3 encompasses a comprehensive presentation of sample selection, data processing, and variable calibration. Subsequently, Section 4 delineates the empirical process undertaken and presents the corresponding results, while Section 5 culminates the study with conclusive remarks.
Literature Review and Research Framework
From an information viewpoint, stock price movements depend on how investors interpret and react to information about that stock [15-17]. Financial performance information is one of the crucial factors for investors to judge the value of a company’s stock, which significantly impacts the stock price [18, 19]. Within the stock market, the valuation of a stock is contingent upon the interplay between market supply and demand, with this dynamic process being inherently shaped by investors’ appraisals and anticipations regarding a company’s financial performance. Investors can analyze financial performance to judge the development prospects, profitability, management level, financial risks, asset quality, and sustainability of a company to assess the value of the company more accurately, identify problems and potential risks of the company, and avoid investment mistakes and losses.
The profitability of an enterprise refers to the level of profit earned by the enterprise in its business activities. Profitability is the fundamental purpose of a business operation and the primary source of return on investment for investors. Investors usually tend to invest in firms with greater profitability, and these firms typically have a higher share price [20, 21]. In studies exploring the relationship between financial performance and share price, most scholars agree that profitability has the most significant impact on share price and that a firm’s profitability, growth capacity, solvency, and cash flow all have a significant positive contribution to share price [7, 22].
Development capability refers to the future growth potential of an enterprise. Based on the prediction of the future investment value of an enterprise, investors will select stocks with good development prospects and upside based on the development capability of the enterprise. According to Warren Buffett’s value investment philosophy, the current financial situation does not necessarily represent the subsequent operations, so it is essential to focus on analyzing the long-term growth prospects of a company when investing. Although some studies argue that accounting information is primarily based on historical data and may not fully capture a company’s growth potential and intangible assets, and that accounting information is subjective due to judgment and estimation, resulting in a limited ability to capture the growth of a company [23], it is still possible to measure a company’s growth through the analysis of certain financial performance indicators [22, 24], such as the growth rate of core business and profit growth rate.
Solvency pertains to the capacity of an enterprise to fulfill its financial obligations by settling its debts. For energy-saving and environmental protection enterprises, those with solid solvency are better able to cope with debt pressure and maintain stable operations and long-term development. At the same time, strong solvency also helps a company maintain a good social image and increases its likelihood of obtaining bank loans and bond financing [25], which in turn facilitates financing and expansion and improves investors’ confidence in investing. Regarding metrics that represent solvency, it has been observed that the current ratio exhibits a statistically significant positive correlation with share price [26]. Conversely, the gearing ratio demonstrates a statistically significant negative correlation with share price [27, 28].
Cash flow represents a company’s ability to circulate capital. Holding sufficient cash flow can guarantee the financial flexibility of a company [29, 30]. The persistence of cash flow is widely regarded as one of the most important indicators for predicting future dividends and consumption growth, as it can reflect the financial soundness and sustainability of a company [31]. Energy-saving and environmental protection listed enterprises have high growth potential and market prospects, but they require large capital investments for R&D and production and therefore usually maintain a low level of debt to reduce financial risks. In addition, the environmental protection industry faces uncertainties in terms of policies, technologies, and markets. Companies need to have strong resilience and risk management capabilities to cope with the uncertain environment. Adequate cash flows may boost the share prices of listed EEP companies. Some studies have shown that holding excess cash can increase the value of a business when it is operating in an uncertain environment and when it has high growth opportunities and low debt levels [32, 33].
There is a “reversal phenomenon” in the Chinese stock market, where smaller firms are more susceptible to equity strategies than larger firms, and the returns to equity strategies are more pronounced [34]. The relatively high share prices of smaller firms may be related to investors’ higher expectations of the prospects of the firm [35]. Aliu’s research found that total share capital is an important factor affecting stock prices, and an increase in stock supply will lower stock prices. The impact of exchange rates and inflation on stock prices is relatively weak, and important indicators such as debt, cash flow, oil, and gold prices have a relatively small impact on stock price fluctuations [36]. Compared to larger firms, smaller firms are more flexible and agile during the growth phase, able to adapt quickly to changes in market demand, and have more opportunities to generate higher growth rates. In addition, smaller companies may also be seen by some investors as riskier investments in their portfolios but with higher return potential. Moreover, in a situation of supply and demand imbalance, smaller firms may also experience relatively higher stock prices due to relatively lower supply. In empirical analysis regarding share prices, some scholars will use the total number of shares to measure firm size as a control variable [37, 38]. In the EEP industry, relatively larger firms usually issue more shares to finance their business expansion and development, and firms with a larger total number of shares are likely to have more shareholders and a higher market capitalization.
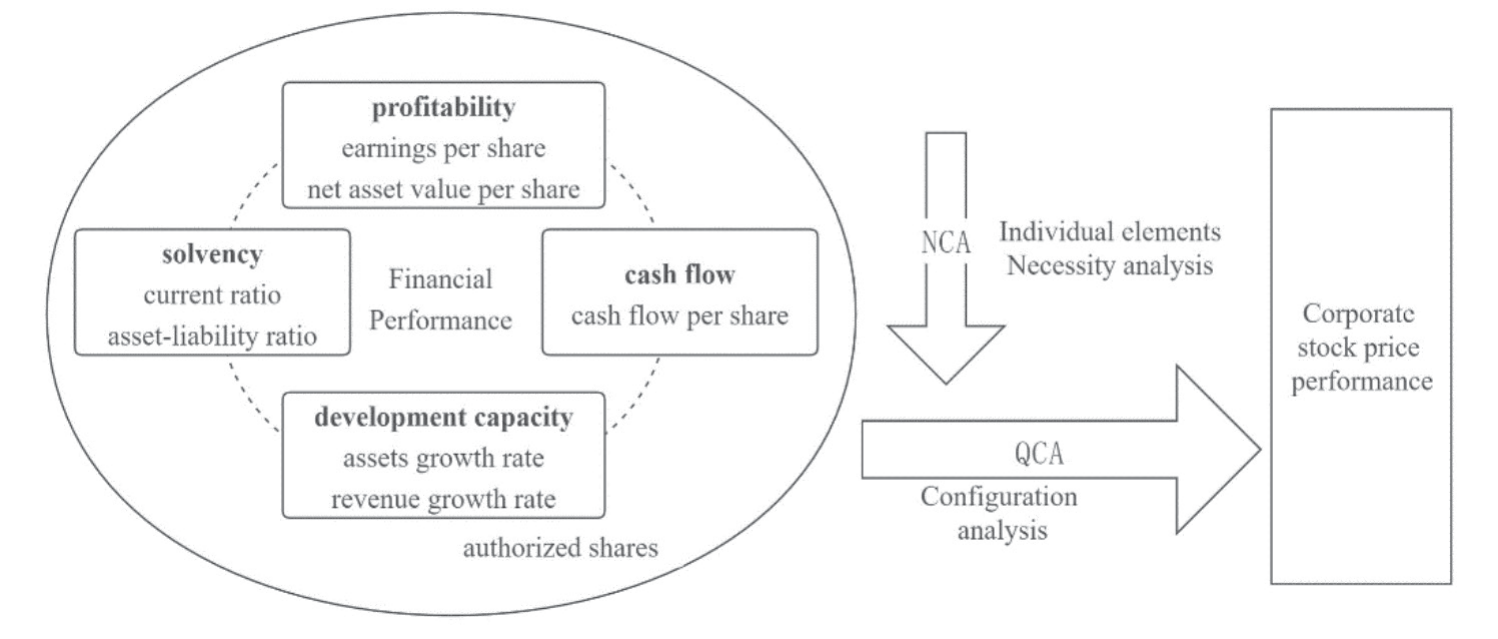
In summary, we selected indicators from the perspectives of corporate profitability, development ability, debt repayment ability, cash flow, and company size to construct a configuration analysis framework (Fig. 2) and explore the complex co-action of many financial performance indicators.
Research and Methods
Selection of a Research Method
Qualitative Comparative Analysis (QCA) was initially developed by sociologist Charles C. Ragin in the 1980s and gained widespread application in the following decade. QCA is a qualitative research method aimed at identifying causal relationships by comparing patterns and associations among different events, situations, or conditions. As a multi-method analytical technique, QCA converts qualitative data into quantitative data for the purpose of comparison. It is based on Boolean logic and set theory, examining combinations of various conditions to identify necessary and sufficient conditions that lead to specific outcomes. Unlike the impact of a single factor on outcomes, QCA emphasizes the interaction among multiple conditions.
Therefore, in contrast to traditional quantitative analysis methods such as linear regression, there are essential differences between the two. Firstly, QCA focuses on studying set relationships, non-linear relationships, and asymmetric relationships among multiple factors and outcomes, while regression analysis focuses on correlation relationships and linear symmetric relationships. In QCA, we view the conditional factors as sets, and in real life, the conditional factors cannot be strictly independent, and there may exist multiple complex intersections between sets. For example, X may lead to Y, but the absence of X may also lead to Y. Secondly, QCA recognizes that outcomes can be constructed through multiple paths, each path being a complex combination of different factors. From a set perspective, when different subsets of factor sets overlap to form a union, known as a “configurational solution,” it is possible to produce the same result (equivalent paths). Thirdly, the QCA method can explain the necessity and sufficiency between the conditional factors and outcomes of each case by measuring the coverage between the outcome set and the subset of conditions, while regression analysis explains the average trend of a population and lacks universality for specific cases. QCA is widely applied in various social science disciplines such as political science, sociology, economics, education, and organizational studies due to its perfect fit with complex real-world situations and its explanatory power [39-41]. Specific practical areas include policy research, organizational surveys, social movement studies, international comparative analysis, and educational surveys.
Overall, QCA offers several significant advantages:
1. It can handle small sample sizes and complex qualitative data, thereby facilitating an in-depth and comprehensive understanding of phenomena.
2. It reveals complex relationships involving multiple conditions, including non-linearity, asymmetry, and interactive effects.
3. It provides an analytical framework for studying mediating and intervening conditions, bridging the gap between theory and empirical analysis. Lastly, it is applicable to studying multiple cases or contexts to identify commonalities and differences.
Qualitative Comparative Analysis encompasses three basic categories: crisp-set Qualitative Comparative Analysis (cs/QCA), fuzzy-set Qualitative Comparative Analysis (fs/QCA), and multi-value set Qualitative Comparative Analysis (mv/QCA). Both mvQCA and csQCA share a common methodological foundation of crisp sets and truth tables, requiring the use of binary or dichotomous data for cases. On the other hand, fsQCA allows for the transformation of case data into degrees of membership ranging between 0 and 1, thereby enabling the handling of continuous data with varying degrees of membership. Considering the characteristics of our research sample, we have chosen to utilize the fsQCA method.
Data Sources and Pre-Processing
The research object is energy-saving and environmentally friendly listed enterprises. EEP-listed enterprises are those publicly traded on the stock market and whose main business is related to energy conservation, environmental protection, and clean energy. The principal offerings of these enterprises encompass a diverse range of products and services, notably including, but not limited to, environmental protection equipment, energy-saving products, new energy vehicles, solar energy, and wind energy, among others. The data utilized in this study is derived from reputable sources, namely the China Stock Market & Accounting Research (CSMAR) database, the RESSET database, and the Chinese Research Data Services (CNRDS) platform. The energy conservation and environmental protection concept sector contains 243 listed companies, and the following data processing has been carried out in this paper to ensure the representativeness and completeness of the data:
(1) Removing companies with the words ST and *ST. When studying the impact of the financial performance of energy-saving and environmentally friendly listed companies on stock prices, it is common practice to exclude samples of companies with an ST (suspension of listing) or *ST (special treatment) status. This practice is mainly based on the following considerations: Firstly, companies targeted with ST and *ST labels are often suspended from listing or subject to special treatment due to poor business performance, financial risks, and other reasons, which may lead to unstable and unreliable financial data. Excluding these samples can reduce bias caused by data quality issues, ensuring the accuracy and reliability of research results. Secondly, companies with ST and *ST labels are often in financial distress or at risk, and their stock price performance may be influenced by non-commercial factors such as regulatory policy changes or market panic, which can affect the interpretation and inference of research results. Excluding these samples ensures the purity of the research results. Lastly, companies with ST and *ST labels are special cases, different from the operational models and performance of normal listed companies. Including them in the research sample may distort the overall research results and conclusions. Excluding these samples maintains the representativeness of the sample and enhances the generalizability of research results. In summary, excluding ST and *ST samples can improve the accuracy and interpretability of research results and safeguard the scientific and effective nature of research.
(2) Removal of enterprises with irregularities in the last three years. If there is falsification of financial reports or material matters are concealed but not reported or inadequately disclosed, this will result in serious information asymmetry between listed enterprises and investors. Therefore, remove enterprises that contain delayed disclosure, inaccurate disclosure, material omissions, irregularities in stock trading, etc.
(3) Removing companies with missing variable values. Ultimately, this paper retained the data of 112 listed energy-saving and environmental protection enterprises as the research sample.
The sample of energy conservation and environmental protection listed companies possesses a certain level of overall homogeneity in terms of economic background and market environment. However, there are variations in the financial conditions and stock price performance of each individual company. Therefore, a classification analysis can be conducted to identify the relationships among influencing factors. The sample of cases meets the requirements of QCA, which emphasize both sufficient homogeneity within the sample and maximum heterogeneity within the sample population [42].
Variable Selection and Calibration
The closing price, being the final traded price of a stock within a trading day, serves as a key indicator of the overall market condition for that particular day. Furthermore, it holds significant importance as the pivotal reference price utilized by investors for stock trading activities [43]. In this paper, the closing price on the last trading day of 2021 is used as the outcome variable to reflect the performance of the stock. Normally, the company's annual report will be published in March of the following year. To ensure consistency between the stock price and the time frame of the financial statements, the indicators used as conditional variables are mainly derived from the annual financial report data of listed companies published in March and April 2022 in the RESET database. To assess the company's performance comprehensively, several financial indicators were chosen. Earnings per share (EPS) and net assets per share (NAPS) were employed as measures of profitability. The growth rate of total assets and operating income served to gauge the company's development capability. Solvency was evaluated using the current ratio and gearing ratio. Net cash flow from operating activities per share depicted the company's cash flow, while the total number of shares was indicative of its size.
Table 1.
Variables and calibration anchors.
To transform the original fuzzy set data into an ensemble form, we need to calibrate the data. Using the direct calibration method [44], the 90%, 50%, and 25% quartiles of the sample data are used as the pooled "fully affiliated", "crossover" and "not affiliated at all" calibrates all variables to a range of 0 to 1 and determines the set to which each case belongs. After calibration, data with a value of 0.5 is uniformly increased by 0.001 to eliminate measurement error. The calibration thresholds for each variable are shown in Table 1.
Results
Necessity Condition Analysis
The QCA approach can be used to determine whether a condition variable is necessary for an outcome to assess the usefulness of the condition, but it cannot quantify the degree of necessity. In contrast, the NCA method can analyze whether and to what extent the condition variable is necessary for the outcome. Therefore, we employ a fusion of QCA and NCA approaches to assess the robustness of the research outcomes.
(1) Analysis of the necessary conditions for NCA
If the effect size of a condition variable is greater than 0.1 and statistically significant, the condition is judged to be necessary for the outcome. The effect size represents the minimal threshold of the condition required to generate a specific outcome, and it spans a range from 0 to 1. As the numerical value approaches 1, the effect size becomes larger. By using the Ceiling Envelopment (CE) method in Necessity Condition Analysis (NCA), the effect sizes can be calculated. The NCA results, as shown in Table 2, indicate that none of the individual independent variables simultaneously satisfy the criteria of having an effect size greater than 0.1 and a statistically significant influence (p<0.01). Therefore, none of the individual independent variables are necessary conditions for high stock prices.
The effect size of the bottleneck level can indicate the value of the level at which the antecedent conditions need to be met to reach the maximum observed range of results. The findings from the bottleneck analysis are presented in Table 3. There is no bottleneck level in the total number of shares in all cases; to achieve a high share price level of 100% of the total range of observations, it requires an 84.2% level of earnings per share, a 90.3% level of net assets per share, a 30.8% level of total asset growth, a 15.9% level of operating income growth, a 3.1% level of current ratio, a 63.1% gearing ratio, and an 80.1% net cash flow from operating activities per share.
(2) Analysis of the necessary conditions for QCA
It is generally considered a necessary condition when the consistency rate (consensus) is greater than 0.9 [45]. As can be seen in Table 4, the results of the fsQCA necessity analysis revealed that it was found that the consistency rate of each individual condition was lower than 0.9, so none of the eight antecedent variables emerged as a singular necessary condition responsible for the stock price performance. and different conditions worked in conjunction with each other to affect the stock price. This discovery aligns with the outcomes derived from the NCA analysis, so all condition variables were included in the configuration analysis.
Sufficient Solutions
In the QCA method, the consistency threshold is the threshold that transforms the membership functions in a fuzzy set into binary values when constructing a truth table. The consistency threshold should usually be chosen between 0.8 and 0.9 [45] to ensure the reliability and stability of the results. When the number of study cases is large, the consistency threshold can be set lower to ensure that a large sample can provide more information. According to the characteristics of the sample, the consistency threshold is set to 0.8, the frequency is set to 1, and the PRI threshold is chosen to be 0.75. Table 5 presents the resultant modified truth table.
Table 2.
Results of the NCA essential conditions analysis.
Table 3.
Analysis Results of the NCA Method Bottleneck Level (%).
Table 4.
Results of the NCA essential conditions analysis.
Table 5.
Truth table of revised high stock price cases.
Since there are no necessary conditions, all conditional configurations arise through the comparison of the simple and intermediate solutions. The intermediate solution and the parsimonious are presented in Table 7. Conditions that manifest in both the parsimonious and intermediate solutions are regarded as core conditions, while conditions exclusively present in the intermediate solutions are classified as marginal conditions. We refer to Ragin's method [46] to present the configuration results. The configuration analysis results obtained from the analysis of intermediate and simple solutions are shown in Table 6.
Table 6.
Characteristics of case enterprises.
Table 7.
Intermediate solution and parsimonious solution.
Table 8 presents three driving paths for higher share price performance in the same industry. Every column signifies a potential conditional configuration. The Solution Consistency for the high share price configuration is 0.93641, which means that about 93.64% of the listed energy-saving and environmental protection companies exhibit high share prices in all cases that satisfy the 3 conditional configurations. The consistency of the three high share price configurations is greater than 0.9, indicating that these configurations are a sufficient combination of conditions to cause high share prices. The consistency and coverage of the solutions are reasonable, indicating that the empirical analysis is valid. The differential fitness relationships between profitability, growth capacity, solvency, cash flow, and firm size in influencing a firm's stock price can be further identified.
Configuration H1 (EPS * NAPS * ~OIGR * Curtrt * ~Aslbrt * ~Size) indicates that a company has a high share price when it has high earnings per share, high net assets per share, a low operating income growth rate, a high current ratio, a low gearing ratio, and a low number of total shares. The operating income growth rate and gearing ratio are marginal conditions in this configuration, and the other conditions are core conditions. This means that if a company can realize high earnings while paying off its debt in a short period, its investment profitability is higher and will be more attractive to investors, and its stock price may still be higher even if the company's growth potential and prospects are not favorable. This configuration explains about 35.6% of the cases of companies with high share prices. The other 3.7% are only explained by this configuration.
Table 8.
Antecedent configuration of factors influencing stock prices.
[i] Note: “●” indicates the existence of a core conditional variable,“●” indicates the existence of edge condition variables, “○” indicates the absence of a core condition variable, “○” indicates the absence of edge condition variables, Blank spaces indicate that the conditional variable is “insignificant”.
Configuration H2 (EPS * NAPS * Curtrt * ~Aslbrt * NCPOA * ~Size) indicates that when a firm has high earnings per share, high net assets per share, a high current ratio, low gearing, a high net cash flow from operating activities per share, and a low total number of shares, the stock price of the enterprise is higher. In this configuration, the gearing ratio and net cash flow from operating activities per share are non-core conditions, and the other conditions are core conditions. This configuration indicates that regardless of the business development of the company, as long as the company has a large value of earnings per share, strong economic power, and the ability to pay back, the company's stock price will also be optimistic. This configuration explains about 34.5% of the cases of companies with high share prices, while about 2.47% can only be explained by this configuration.
Configuration H3 (EPS* NAPS * Ttassgrrt * OIGR * Curtrt * ~NCPOA * ~Size) indicates that when a company has high earnings per share, high net assets per share, a high growth rate of total assets, a high growth rate of operating income, a high current ratio, low net cash flow from operating activities per share, and a low total number of shares, it has a high share price. In this configuration, the growth rates of total assets, operating income, and net cash flow from operating activities per share are non-core conditions, while the other conditions are core conditions. This configuration contains the most financial performance indicators, with a consistency level of about 94.5, and is the configuration that has the most explanatory power in causing a high share price, indicating that if a company performs well in all financial performance, its share price is most likely to be high. However, this configuration has the lowest coverage of the three configurations, explaining only about 28.4% of the cases of high-share price companies.
Horizontal Analysis of Antecedent Conditions
Primarily, both earnings per share and net assets per share serve as core presence conditions in the three configurations that contribute to a firm's elevated share price. suggesting that a firm’s profitability is the key factor contributing to a higher share price. In line with the majority of the literature, profitability has the greatest impact on share prices. Profitability represents a company’s ability to get paid and is an indicator that reflects the returns received by shareholders. Firms with high profitability have a high investment value in their shares and, therefore, more attention from investors. However, profitability alone does not constitute a sufficient condition to explain the generation of results, so investors should not focus solely on profitability as the main indicator of interest. Secondly, the total number of shares in all high-share price configurations acts as a core low-level indicator. The dynamics of stock supply and demand represent a pivotal determinant in influencing share prices. When market demand is stable, a low number of shares issued by a firm will result in an oversupply of shares, leading to a relatively high share price for the firm. Again, the number of shares alone does not constitute a sufficient condition to explain the results generated, and therefore investors should not invest in these companies by reference to the total number of shares alone.
Robustness Checks
After adjusting the consistency and frequency thresholds, we observed the differences in the fitted parameters and the subset relationships between the configurations after the adjustment to perform robustness tests. The findings are presented in Table 9.
Table 9.
Robustness analysis.
(1) The consistency threshold was established at 0.85, and the new state G1 was a subset of the original state H1, and the state G2 was a subset of the original state H2, with no change in the consistency or coverage of the solution. (2) The frequency threshold is established at a value of 2, and the new configuration state N2 obtained is a subset of the original configuration state H3. After adjusting the frequency threshold, The consistency of the solution exhibits a decline from 0.936411 to 0.934923, and the coverage rate decreases from 0.443617 to 0.410619, which is within a reasonable range. After adjusting the parameters, there is a clear subset relationship between the two configurations of states, and the consistency and coverage are generally consistent with the original findings, and the empirical results are robust.
Discussion
Previous studies have primarily focused on the correlation between various performance indicators of enterprises and stock prices, with a predominant emphasis on financial. For instance, LIU studied domestic agricultural listed companies and investigated the impact of financial performance on stock prices using factor analysis and linear regression methods. They found a significant correlation between profitability and stock prices, but the correlation between other performance indicators and stock prices was less pronounced [47]. Additionally, CHEN et al. focused on A-share listed banks and examined the relationship between operational performance and stock price volatility. The results indicated heterogeneity under different market fluctuation rates, with profitability and growth capacity significantly promoting stock price volatility [48]. In comparison, the innovation and novelty of this study lie in the theoretical and methodological aspects, particularly in the adoption of the NCA and fsQCA methods. These offer researchers a nonlinear, multidimensional analytical perspective, enabling a more comprehensive exploration of the relationship between multiple financial performance indicators and stock prices. Compared to traditional regression analysis methods, NCA and fsQCA are more suitable for investigating the potential interactions among multiple conditions in complex systems, thereby providing new insights and methodologies for studying the relationship between performance and stock prices. Furthermore, through configurational analysis, this identified driving paths for high stock prices and recognized profitability as a core factor driving the rise in stock prices. These findings not only deepen the understanding of the mechanism through which financial performance affects stock prices but also provide investors with more accurate decision-making foundations. Moreover, by exploring the configurational relationship between financial performance and stock prices, this expands the perspectives of financial performance studies and offers new research directions for future studies in related fields.
Firstly, in energy-saving and environmental protection enterprises, profitability, growth, debt service, cash flow, and company size factors cannot individually constitute the necessary conditions for a company to have a high share price. indicates that share price performance is synergistically influenced by multiple aspects of financial performance conditions. Through configuration analysis, three driving paths for high stock prices are identified, including Profitability-Debt Service, Profitability-Debt Service-Cash Flow, and Profitability-growth-Debt Service. Due to the equivalence between configurations, the combination of these three conditions leads to a higher performance of the company’s stock price in the same industry of EEP in a “different path and the same goal” manner. So when choosing to invest in EEP enterprises, one cannot judge the stock price solely based on a single financial performance of a company. Multiple equivalent paths drive the company’s stock price to be higher in the EEP industry. Investors can refer to and analyze according to the situation and, if necessary, comprehensively examine various financial performance indicators.
Secondly, profitability is a core condition in all three paths, so compared to other conditions, the impact of a company’s profitability on stock prices is crucial. Listed companies in the EEP industry usually need to invest heavily in research, development, and technology to meet government environmental requirements and market demands. These investments require a significant amount of capital, so the profitability and financial performance of a company are directly related to its ability to continue research and technological innovation, which in turn affects the company’s development prospects and stock price performance. In the increasingly competitive market environment of the EEP industry, companies with strong profitability are usually able to withstand market fluctuations and have strong stability and investment value. However, profitability alone cannot constitute a sufficient condition for explaining the results, so investors should not consider profitability as the only primary indicator of concern.
Thirdly, the total number of shares in the three high stock price configurations serves as the core low-level indicator. From a stock market standpoint, the interplay between stock supply and demand represents a pivotal determinant influencing stock prices. When a company issues relatively few stocks, the supply of those stocks is correspondingly small. Due to the relatively stable market demand, if the enterprise receives government policies and financial support or launches new products, the market demand is easily stimulated, making these companies have relatively high stock prices in the EEP industry. Since the number of shares is not a sufficient condition for high stock prices, investors should not invest in these companies just because of “Scarcity”.
Finally, the empirical results show that Configuration H3 has the most muscular explanatory power for the high share prices of the firms, but the lowest coverage of H3, explaining only 28% of the cases. Configuration H3 appears to have the most financial performance indicators, representing firms with better overall financial performance. Its low coverage rate indicates, on the one hand, that the number of such energy-saving and environmental protection firms in the sample cases is low. On the other hand, it indicates that investors do not usually consider all financial performance indicators comprehensively when referring to financial performance, Investors tend to refer to H1 and H2 combinations with fewer performance indicators when investing, so that the coverage of the more comprehensive configuration is smaller instead.
The shortcomings of this study can be further explored in future research. Specifically, the lack of in-depth analysis of the interplay between internal corporate factors and external environmental factors may limit a comprehensive understanding of the complex connection between financial performance and stock price fluctuations. Subsequent investigations could consider introducing additional variables and factors, such as corporate governance structure, market competitive environment, macroeconomic policies, etc., to explore the impact of these factors on the correlation between financial performance and stock prices, providing a more comprehensive explanation of stock price movements. Additionally, while this study conducted a detailed investigation of energy-saving and environmentally friendly listed companies, it did not account for the potential impact of inter-corporate differences and special characteristics on the research conclusions. Future research could explore adding more dimensions to corporate classification, such as segmentation based on different company sizes, market positions, etc., to analyze the influence of corporate characteristics on the relationship between financial performance and stock prices. Future research could conduct a more in-depth exploration of methodological approaches, sample selection, analysis dimensions, and variable selection to enhance the comprehensiveness and accuracy of research conclusions, providing investors with more effective decision-making references.

