

Introduction
With the rapid development of the social economy, high-intensity human activities have greatly squeezed available water resources in the river basin, resulting in a decline in river water levels and hydrological connectivity, which in turn affects the ecological health of rivers [1]. The blind pursuit of economic development while ignoring ecological water needs leads to wetland environmental problems such as reduced area, lowered water levels, increased pollution, and declining function [2]. Deteriorating wetland environments also affect human daily activities. Ecological replenishment is an important way to maintain and improve the quality of the regional water environment. The short-term introduction of higher-quality water bodies through engineering measures can alleviate water scarcity and support ecological restoration [3, 4]. Scientific and appropriate ecological recharge and the duration of recharge flows are very important for improving the water environment. [5]. Its study has become the focus and hot spot of people’s attention. The research and methods for improving the water environment are extensive, including empirical formulas [6], physical models [7], and numerical calculations [8]. The recharge of two canals to the Kumtz wetland in South Africa was studied using physical modeling, analyzing the compensation mechanism for wetland recharge and the ecological benefits [9]. The hydrological benefits of the river were calculated using an empirical equation method by analyzing the flow between two dams in eastern Australia and the downstream river flow [10]. Changes in hydrological conditions, such as water levels, directly affect the composition and distribution of plant species, which in turn affects the structural integrity of wetland ecosystems. Plants provide animals with energy and an environment to survive and reproduce. Studies have shown that environmental factors such as water depth [11], light intensity, and water nutrients affect the biomass and distribution of aquatic vegetation [12].
The water replenishment effect is mainly evaluated in terms of ecological benefits [13], economic benefits, and social benefits [14]. According to the research on the water replenishment effect, it is concluded that when the water supply is more than the maximum water demand or less than the minimum water demand, the water level can also be said to be too low or too high, which may lead to changes in wetland habitat structure and difficulties in restoring the wetland ecosystem [15]. For example, one can synthesize the historical water level data for Baiyangdian from 1956 to 2000 and determine that the appropriate ecological water level for Baiyangdian is 7.5 m to 8.7 m. When the water level of Baiyangdian falls to 8.0 m, priority should be given to replenishing water in Baiyangdian between the reservoir and Baiyangdian. When the water level falls to 7.5 m, production and life in the starch area will not function normally, so it is necessary to choose to let the upstream reservoir replenish water urgently. When the water level drops to 6.5 m, the upstream reservoir and the outer basin are used to replenish Baiyangdian Lake simultaneously.
Traditional methods consume considerable labor costs, but it is difficult to obtain data due to many limitations. With the improvement of modern computer computing power, the numerical simulation model of the water environment can accurately simulate the changes in the water flow field and water quality, so numerical simulation has become the mainstream research tool [16]. At present, research on the use of models to clarify water replenishment schemes has been gradually disseminated and applied [17]. By applying the model to the selection and optimization of water replenishment schemes, we can simulate and compare the effects of different water supply quantities, locations, and water qualities on water replenishment schemes. This enables us to more effectively input optimal water replenishment control schemes [18]. Mike is widely used to simulate water resources and water environments. Including MIKE11, MIKE21, and MIKE3, through the construction of hydrodynamic-water quality coupling models, problems between hydrodynamic parameters such as flow and velocity and water quality can be accurately solved [19]. We developed a three-dimensional hydrodynamic-water quality coupling model of the Maowei Sea, which is of great significance for protecting marine ecology [20]. Simulates hydrodynamic conditions of the water replenishment scheme using MIKE21 [21], showing reasonable overall flow field distribution despite issues like slow flow velocity and unsmooth water exchange locally. Appropriate methods can improve these problems. A two-dimensional hydrodynamic model of multi-water recharge in the Baiyangdian wetland was constructed using MIKE21 [22]. The results of 8 calculation conditions show that the replenishment measures of the South-to-North Water Transfer Project have significantly improved the water resources and hydrodynamic conditions of Baiyangdian Lake. To summarize, scholars at home and abroad have made fruitful achievements in ecological water replenishment. However, there is a lack of research on some key aspects of data simulation.
This study takes the Yongding River (Beijing Plain section) riparian wetland as the research area and aims to address the problems of plant species reduction and ecological function degradation in the riparian wetland. Analyzing the evolution law and characteristics of plant habitat in the riverside wetland according to the current hydrological data and plant data of the riverside wetland, we construct a model to simulate water replenishment and adjust ecological water supply. The effects of ecological water replenishment on the hydrological conditions, aquatic plant community structure, and distribution of the riverside wetland of the Yongding River (Beijing Plain section) were analyzed to support wetland restoration and realize its ecological and economic values. The hypothesis we propose is that wavelet analysis can be utilized to identify and predict the water level change cycle of riparian wetlands while acknowledging the significant impact of ecological water replenishment on the recovery of aquatic plant communities in these wetlands. Additionally, an optimal water replenishment scheme can be designed to ensure the recovery of aquatic plant communities, considering both economic and sustainability factors. The research findings of this article aim to provide a scientific basis for wetland restoration, achieve ecological and economic values of wetlands, and offer guidance for wetland management and ecological water replenishment. Through these analyses, the article hopes to provide scientific support for ecological water replenishment and water resource management in the Yongding River and other similar wetlands.
Materials and Methods
Taking the typical aquatic plant community of the Yongding River (Beijing Plain Section) Riverside Wetland as the research object and based on the long series of hydrological data from 1981 to 2020, the periodic variation law and characteristics of water level of the typical section of riparian wetland in the recent 40 years were studied by wavelet analysis. A hydrodynamic model of the Yongding River (Beijing Plain Section) riparian wetland was established using the MIKE11 model. The effects of different water levels on the restoration of aquatic plant communities in the riparian wetland were studied. The influence mechanism of ecological water replenishment on aquatic plant communities was investigated. An optimal allocation scheme for ecological water replenishment based on the restoration of typical aquatic plant communities in the riparian wetland was proposed.
Survey Regions and Data Sources
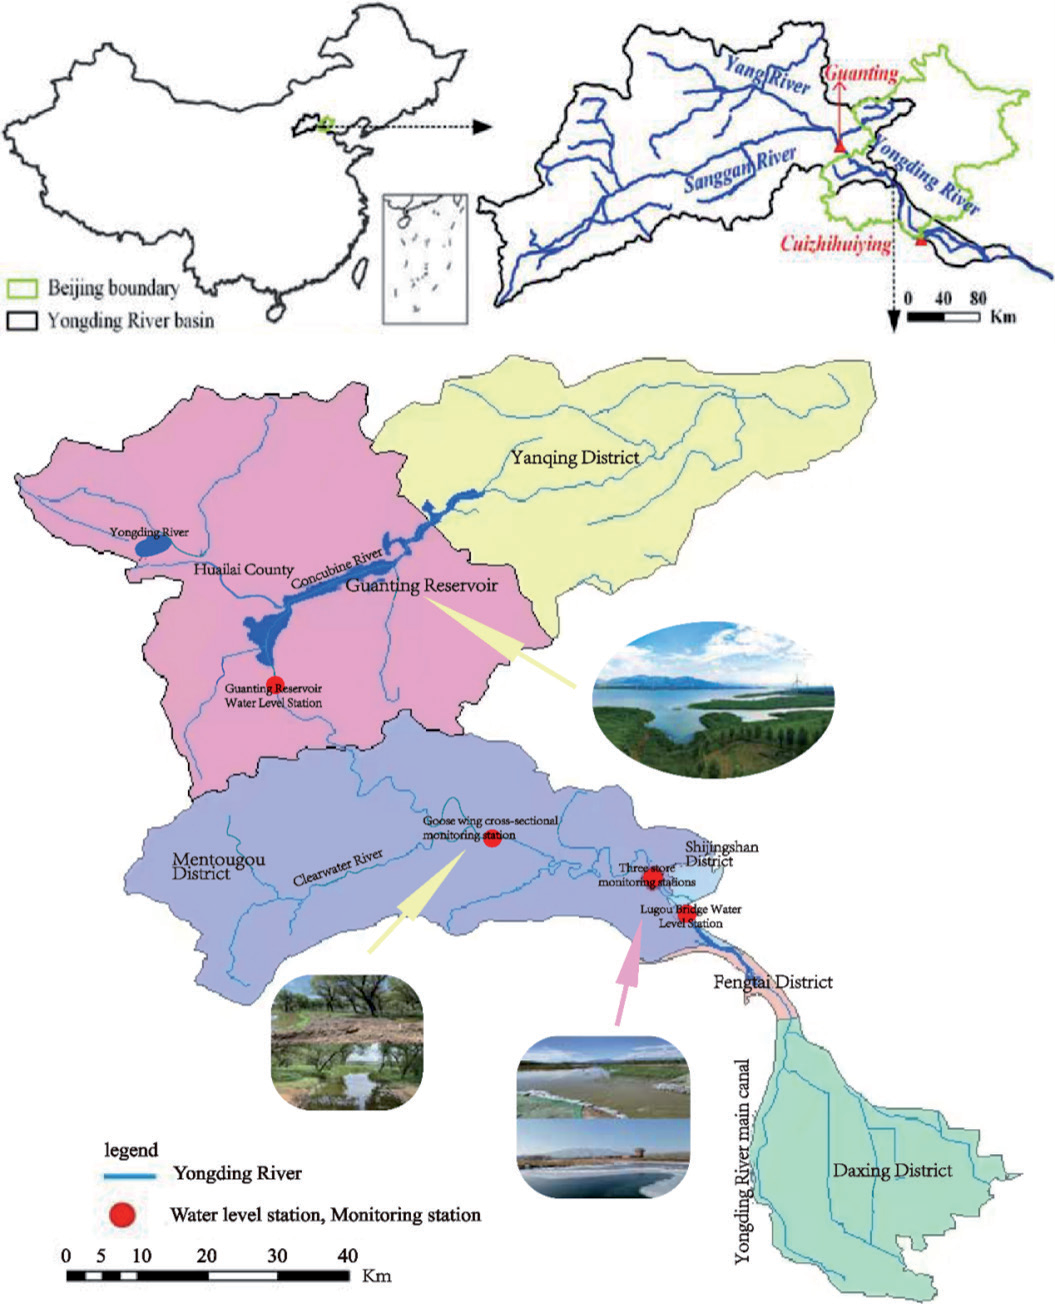
The Yongding River is located at longitude 112°- 117°45’E and latitude 39°-41°20’N, bounded by the Chaobai River and North Canal to the east, the Yellow River to the west, the Daqing River to the south, and the inland river to the north. As the largest river in Beijing, it covers an area of 47,000 km2. It occupies an important position in the development of the city of Beijing. Among them, the total length of the Yongding River (Beijing Plain Section) is about 170 km, entering the plain area from Sanjiadian, with a basin area in Beijing of about 3210 km2. Flow through Mentougou, Shijingshan, Fengtai, Fangshan, and Daxing District [23] (Fig. 1). Under the dual influence of human activities and climate, great changes have occurred in the temporal and spatial pattern of water resources in the Yongding River Basin, which has led to fluctuations in the water level of the Yongding River in recent decades. The Yongding River basin is cold and dry in winter and warm and wet in summer, with four distinct seasons and large temperature and rainfall variations between winter and summer. According to statistics, the average annual precipitation in the Yongding River Basin ranges from 360 to 650 mm [24]. Additionally, the annual rainfall distribution is highly variable, with most rainfall occurring during the flood season. The average annual rainfall during the flood season is above 600 mm, and the average annual temperature is approximately 11.5°C, with extreme maxima reaching 40°C in summer and minima reaching -22°C in winter.
The total data used in this study comprises the measured water level data from the riparian wetlands of the Yongding River (Beijing Plain Section) from 1981 to 2020 and the rainfall data from the Beijing area Climate Yearbook (1981-2020). In the water level data, the daily water level values of the riparian wetlands of the Yongding River (Beijing Plain Section) are taken as the daily water level values of the four water level monitoring stations of Guanting Reservoir, Yanfin Section, Sanjiadian, and Lugou Bridge.
Water Level Characteristic Analysis
Under abnormal global climate changes, concentrated heavy rainfall and extreme drought weather occur frequently, significantly impacting river hydrological processes [25]. The variation characteristics of river water levels reflect changes in water volume within the watershed and are also important influencing factors that affect the growth and development of aquatic plant communities [26]. At present, there have been many studies on the variation of river water levels. The Morlet wavelet analysis method was used to analyze the overall trend of the water level in Taihu Lake from 1960 to 2018, and it was pointed out that climate change and human activities are the main reasons for changes in the water level of Taihu Lake [27]. The paper pointed out that rainfall is the main reason for changes in water level in Lake Balkhash. The research shows that the NARX neural network model is one of the effective ways to analyze the nonlinear process simulation of rainfall-water level [28]. Quantitative analysis of water level variation characteristics using the NARX dynamic neural network is highly accurate. By comparing the daily water level variation process predicted by the BP neural network and the NARX neural network model, it is found that the prediction result of the NARX neural network model is better than that of the BP neural network.
Morlet Wavelet Analysis
1) Based on the measured water level data of the Yongding River (Beijing Plain Section) riparian wetland from 1981 to 2020 and the rainfall data taken from the Beijing area Climate Yearbook (1981-2020). The water level data takes the average daily water level of the four water level monitoring stations of Guanting Reservoir, Yanfin Section, Sanjiadian, and Lugou Bridge in the past 40 years as the daily water level value of the riparian wetland. On this basis, the annual average water level is calculated. The calculation formula is as follows:
Wi is the water level at each water level monitoring station, and n is the total number of monitoring stations.
2) Linear trend analysis and moving average method. Linear trend analysis can be used to study the development trend of water level and rainfall [29]. The basic formula is as follows:
Where coefficient is the regression constant; t is time; and ratio is the tilt coefficient. The moving average method calculates the average of multiple continuous series from a long time series to represent more accurately measured data. It can restrain random error and get a smoother measurement result.
3) Morlet wavelet analysis. Wavelet analysis is an unsteady system process [30]. Selecting an appropriate base wavelet function is an important prerequisite for wavelet analysis. Different results can be obtained by selecting different basis wavelet functions for the same time series. The basic wavelet function is an oscillatory function that attenuates rapidly to zero. The basic wavelet function is as follows [31]:
In the formula, ψ(t) is the base wavelet function, which can form a cluster of functions by scaling and translating the time axis:
Among them, a, b∈R, a≠0,
Common basis wavelet functions include Haar wavelets, Meyer wavelets, etc. Through comparative analysis, the Morlet wavelet function is used in this study. The formula for the Morlet wavelet function is:
Where t is a time series; I is an imaginary number; and w is a constant. According to the time series f (t)∈L2(R), the continuous wavelet transform formula [32] is:
In the study, the wavelet coefficients calculated by the above continuous wavelet transform formula are mainly used to analyze the time-frequency variation of time series. Wavelet variance is the square integral of all wavelet coefficients. The formula is as follows [33]:
Among them Var(a) is wavelet variance; is Wf (a,b) a wavelet coefficient.
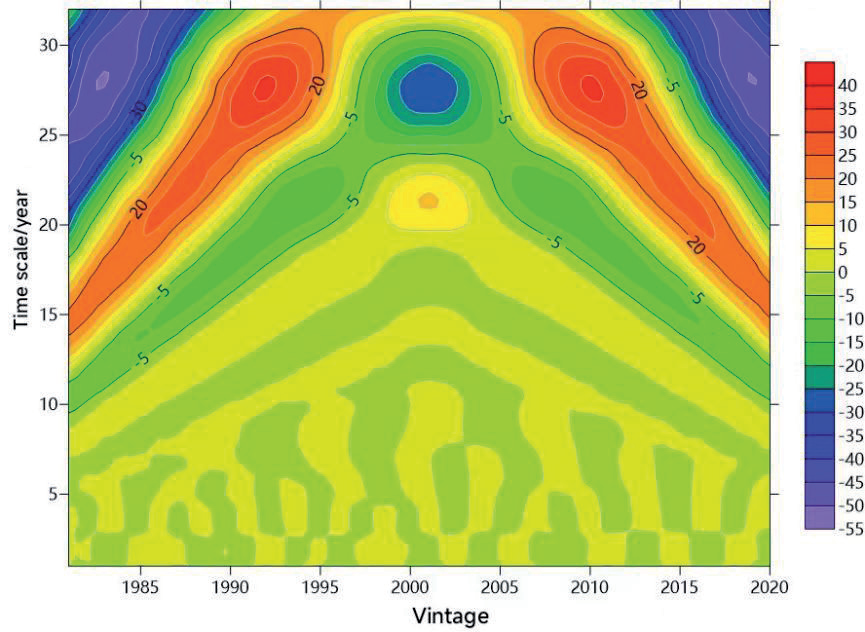
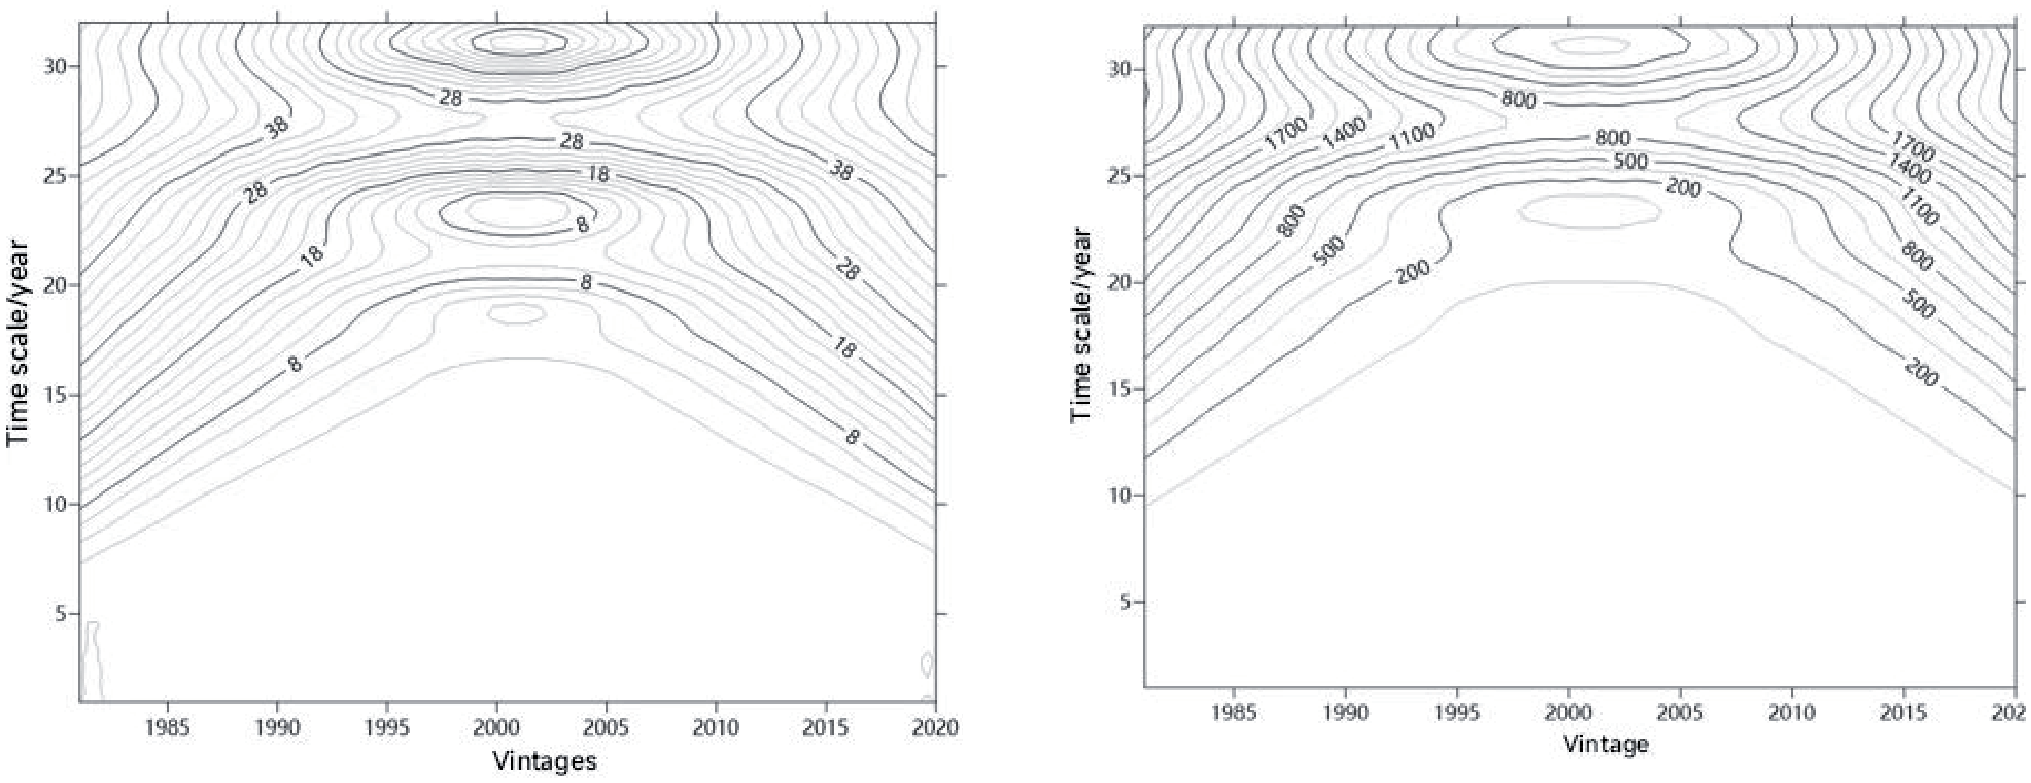
Using Morlet wavelet analysis in the Matlab2018a software, the wavelet coefficients calculated from the wavelet transform formula are used to further calculate the real part, modulus, and modular square of the wavelet coefficients. The real part, modulus, and modular square can be further processed using the Surfer 12.0 software to generate an isoline map. The positive part of the isoline map of the real part of the wavelet coefficient represents the rise of the water level during the high water period, and the negative value represents the fall of the water level during the low water period [34]. The larger the modulus of the wavelet coefficients, the stronger the periodicity at that scale. The modulus square of the wavelet coefficients reflects the oscillation energy of different periods. Through the wavelet variance formula, the wavelet variance value is obtained, and the wavelet variance map is drawn, which can be used to determine the period in the periodic change of water level [35, 36]; that is, the maximum peak corresponds to the first main period. In the periodic change, the second peak corresponds to the second major period, and the third and fourth peaks correspond to the third and fourth major periods of the periodic change, respectively.
NARX Neural Network
NARX is a dynamic neural network and can be used to quantitatively predict the water level of the Yongding River. The model expression is as follows:
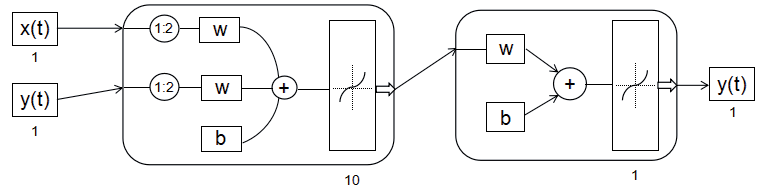
Where m is the delay order of time series x(t), n is the delay order of time series y(t), and t is time. The structure of a NARX neural network includes an input layer, a hidden layer, an output layer, and input and output delays. The input and output delay order of the NARX neural network model is set to 1, and the hidden layer is 10 (Fig. 2). The simulation prediction is completed using Matlab software.
Characteristics of Interannual Variation of Water Level
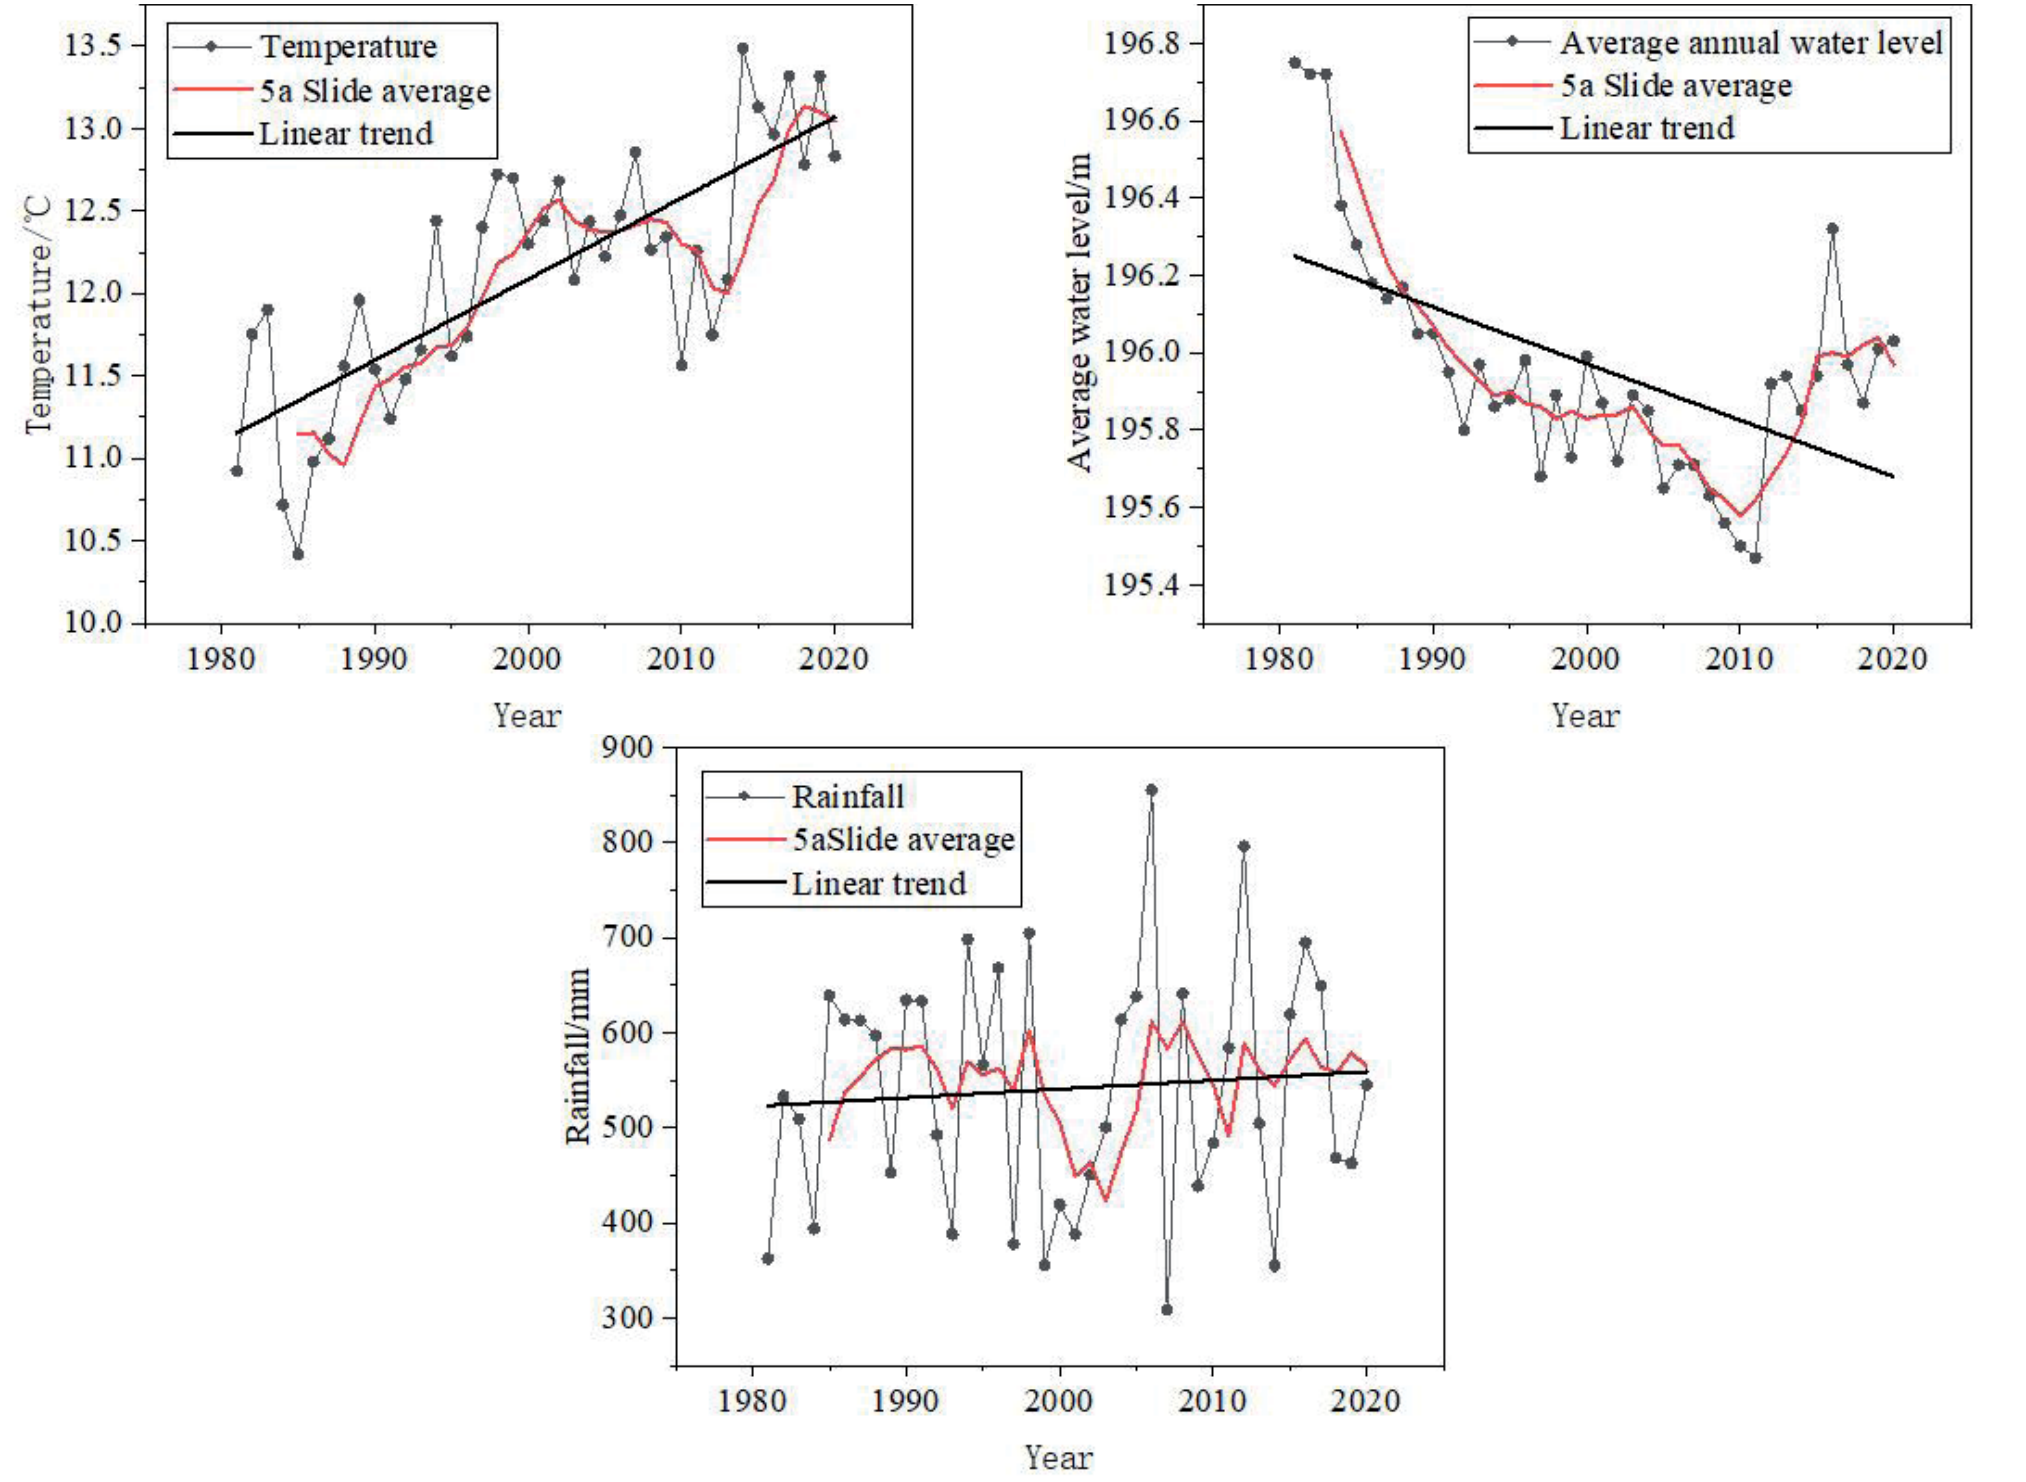
The water level showed an overall downward trend from 1981 to 2020. The fitted linear trend equation is: Yizheng = 225.1613-0.0145*t (R2=0.31872). The average water level of the Beijing section of the Yongding River over the past 40 years was 195.96 m, with the highest annual water level reaching 196.75 m in 1981 and the lowest at 195.47 m in 2011. The difference between the highest and lowest water levels was 1.28 m. In the past 40 years, the water level decreased at a rate of 0.018 m/a (meters per annum). From the 5-year moving average curve, it is evident that rainfall exhibits large interannual variation and is highly irregular. The linear trend equation fitted is: Yawry = 1283.62113 + 0.91229t (R2=0.0068). When affected by the environment, the temperature as a whole showed an upward trend. On the 5-year moving average curve, the temperature showed an upward trend from 1981 to 2008, a downward trend from 2009 to 2014, and an upward trend from 2015 to 2020. After fitting, the linear trend equation is: Yawashi = 86.10478 / 0.0491*t (R2=0.6044). From the 5-year moving average curve, it can be seen that the change in water level in the riparian wetland has experienced four stages: rapid decline, steady, slow decline, and rapid rise (Fig. 3).
Introduction to the MIKE11 Model
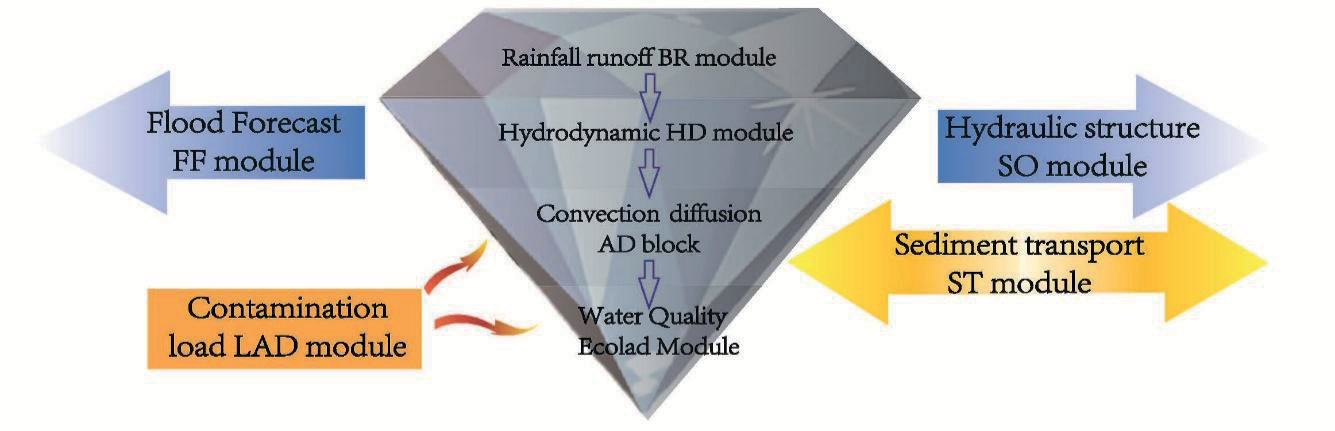
The MIKE11 model is one of the key modules in the MIKE software suite, which is often used to simulate one-dimensional hydrodynamics and water quality in estuaries, rivers, and other water bodies [37] (Fig. 4). MIKE 11 has been successfully applied in the Songhua River Basin, Yellow River Basin, and Yangtze River Basin in China. The simulation of river flow, water level, and other hydrodynamic elements in MIKE11 has reached a high level, providing scientific and technical support for river water resources management and allocation [38].
Basic Theory of MIKE11
MIKE11HD (one-dimensional hydrodynamic module) is the calculation basis of other modules. MIKE11HD simulates the flow state of rivers through the Saint-Venant equations of one-dimensional unsteady flow [39, 40]. The specific expression is as follows:
Continuity equation:
Kinematic equation:
Among them, T is the time coordinate of the calculation point; x is the distance coordinate; H is the cross-section water level; Q is the cross-sectional discharge; An is the cross-sectional flow area; R is the hydraulic radius; B is the water surface width of the river; Q is the side inflow; C is the tank coefficient; g is the gravity acceleration.
Model Building
The documents needed to establish the hydrodynamic model of the riparian wetland of the Yongding River (Beijing Plain Section) are the simulation file (.sim11), generalized river network file (.nwk11), section file (.xns11), boundary file (.bnd11), time series file (.dfs0), hydrodynamic parameter file (.bnd11), and rainfall parameter file (.rr11).
(1) River network file (.nwk11)
In order to basically reflect the characteristics of the natural river network, it is necessary to generalize the river network water system in the study area. The watershed bottom map of the riparian wetland of the Yongding River (Beijing Plain Section) is introduced into the bottom map and drawn and set up, and the full length of the river network is 76.6 km.
(2) Cross-section file (.xns)
Open the section file operation interface; input the relevant data of the measured section of the riverside wetland of the Yongding River (Beijing Plain Section) to generate the riverbed section file of the study area (.xns11). According to demand, a total of 20 sections are set up.
(3) Time series file (.dfs0)
Time series files are mainly used for boundary conditions. The initial time set in this paper is (2019, 3pg, 238), the time step is 1 day, and the measured flow data of ecological water replenishment are introduced.
(4) Boundary condition (.bnd11)
The model’s boundary mainly includes external and internal boundary conditions. The external boundary condition usually refers to the starting point of water entry or outlet. The reliability of the model depends on the setting of internal boundary conditions, so the setting of boundary conditions should be fully in line with the actual investigation.
(5) Parameter file (.hd11)
The parameters mainly include the river’s initial conditions and the riverbed’s roughness. In BedResist, riverbed roughness is set to the Manning coefficient, which is often set to 0.03 for plain rivers.
(6) Rainfall parameter file (.rr11)
Due to the need for a model, the HD hydrodynamic model is coupled with the NAM model. The parameters under the NAM model property page include the surface-root zone aquifer parameter page, the initial condition parameter page, and the automatic rate parameter page.
(7) Simulation file (.sim11)
The simulation file only needs to be generated by adding all the above-established modules to the corresponding location, coupling them, and keeping the simulation time and step size information consistent with the time series file.
Model Calibration
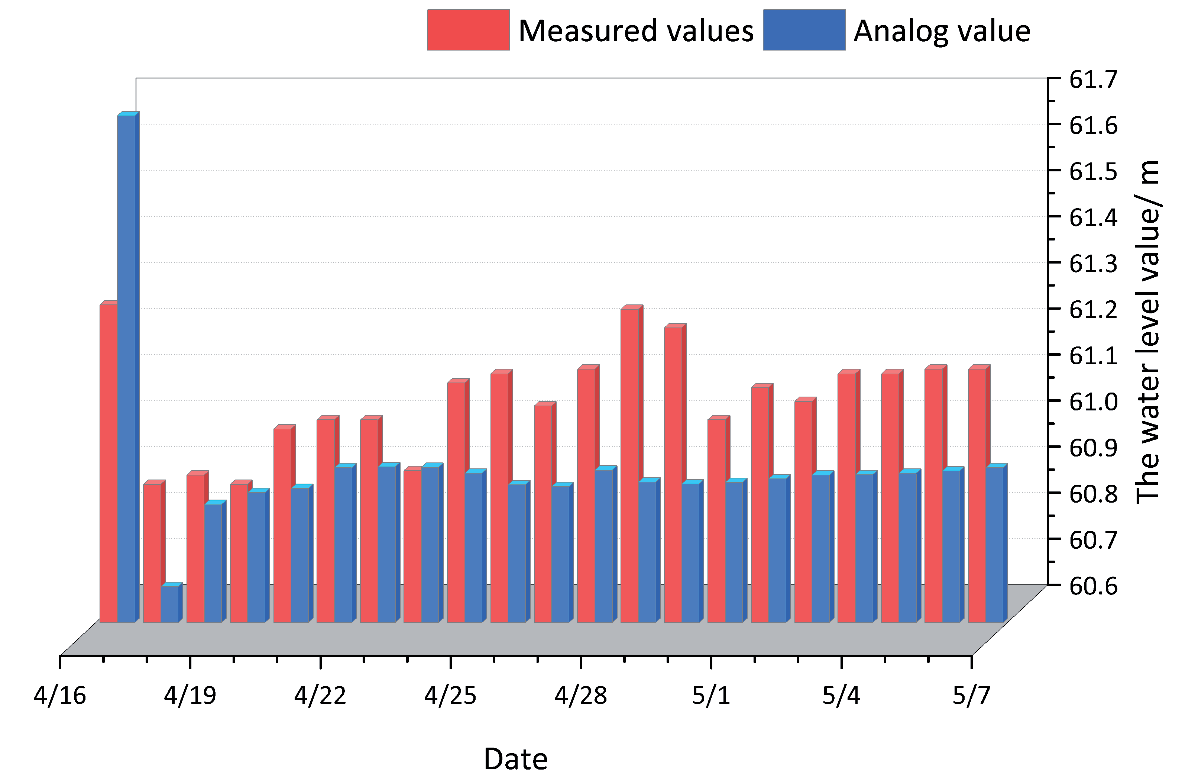
The location of the Lugou Bridge section is one of the most important sections in the upper reaches of the study area, so this paper takes the Lugou Bridge section of the Yongding River riparian wetland (Beijing Plain Section) as the calibration section. The water level simulation values of the Lugou Bridge section for the long time series of 2019 were compared with the measured values, and the established one-dimensional river network hydrodynamic model was calibrated (Fig. 5). Through the ratio curve, we can see that the distribution trend of the measured data is almost consistent with the simulation results, indicating that the water level of the typical section simulated by the model is more accurate. The next step is ecological flow scheduling simulation analysis.
Results and Discussion
Analysis of Water Level Characteristics
Analysis of Periodic Variation Law of Water Level
The continuous wavelet transform was used to analyze the periodic variation characteristics of the water level time series of the riparian wetland of the Yongding River (Beijing Plain Section) from 1981 to 2020 using the Morlet wavelet function. Fig. 6 shows the time-frequency analysis of the real part of the Morlet wavelet coefficients of the water level series. The abscissa is the observation period of the water level data from 1981 to 2020, and the ordinate is the wavelet scale 1:32a. The multi-time-scale characteristics of water level evolution in the past 40 years can be clearly seen. The time series of water level variation in riparian wetlands (Beijing Plain Section) has the characteristics of a main period of 12-31 years, and its central scale is 28 years. The three low water level centers and two high water level centers on this scale correspond to the five shocks on the 28a scale in 1982, 1992, 2003, 2011, and 2019, respectively. The oscillation frequency is strong in the 310-year range but not obvious in low and high water periods.
As shown in Fig. 7, from the time-frequency distribution of the wavelet coefficients of water level in the riverside wetland, it is evident that the modulus of the time scale of 26~32 years is the largest in the evolution of water level in the basin, so the cyclic changes in this time scale are the most obvious, followed by the time scale of 21~32 years. The cyclic changes on time scales of 17~26a are smaller at 13~24a and 10~19a. Moreover, the time-frequency distribution of squared wavelet coefficients of the water level in the riverside wetland is shown in the figure. The time-frequency distribution of the squared wavelet coefficients of the water level in the riverine wetland is shown in figure. It can be seen that the energy is the strongest, and the period is the most important in the time scale of 22 to 32a. The period variations in the time scales of 20 to 32 and 18 to 32 are only followed by those of 22 to 32, while the mode squares of the other time scales are smaller, and the energy of the oscillations is weaker.
The wavelet coefficients of different time scales are substituted into the wavelet variance formula to obtain the wavelet variance, thereby determining the main period of the water level evolution process. Fig. 8 shows the wavelet variance of the annual water level series of riverside wetlands. Fig. 8 shows that the change in water level in the riparian wetland exhibits a peak at 28 years, indicating that the fluctuation period of water level change is strongest on a time scale of 28 years, that is., the first main period. According to the time-frequency analysis results of the real part of Morlet wavelet coefficients of the water level series in Fig. 6, the neutralization wavelet variance map shows that the significant period of annual average water level variation is 28 years. As shown in Fig. 8, in cycle 28a, the positive phase occurs from 1989 to 1996 and from 2006 to 2013, with the annual average water level in the high period. The annual average water level was in the negative phase in 1981-1988, 1997-2005, and 2014-2020, and the annual average water level was in the low period. The water level of the riparian wetland has experienced a dry-abundant-dry-dry process, which is consistent with the results of real-time frequency analysis of Morlet wavelet coefficients of the annual water level series.
Water Level Simulation Model
Taking the water level data of the Yongding River over the years as the target value in the NARX neural network, the input delay is 1:5, the output delay is 1:5, and the number of neurons in the hidden layer is 10. The proportion of the training set, verification set, and test set is set to 70, 15, and 15% to complete the water level time series prediction.
Fig. 8.
Wavelet variance diagram of water level series and time series variation diagram of wavelet coefficients.
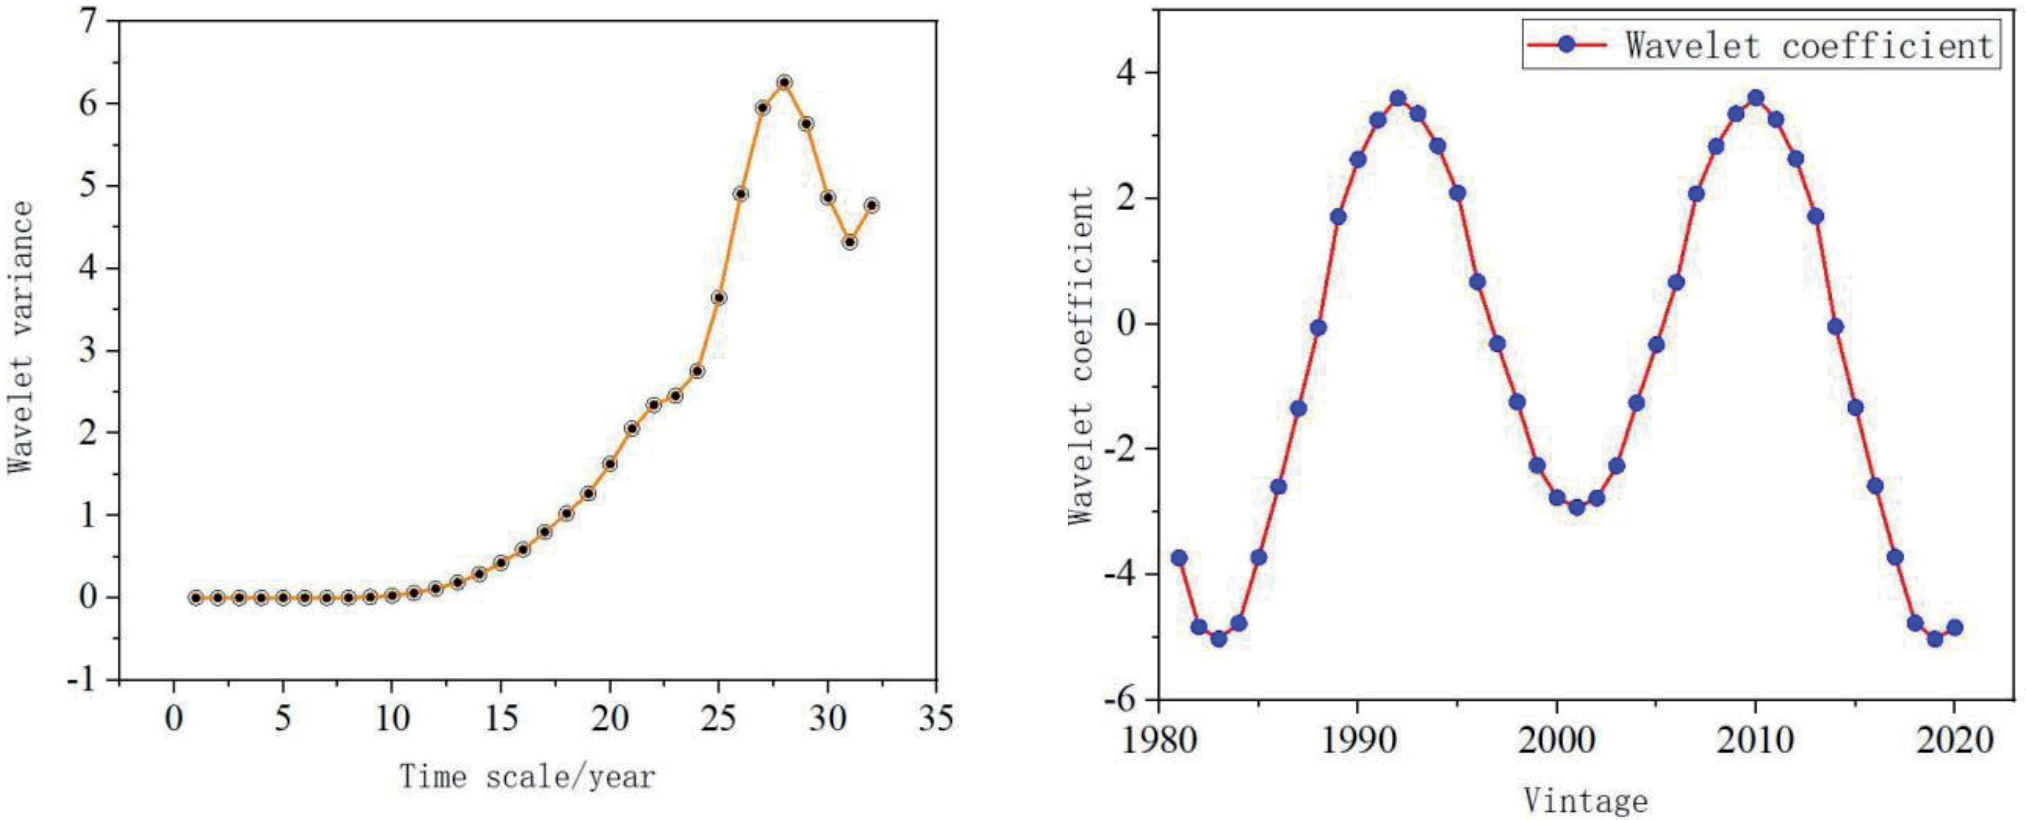
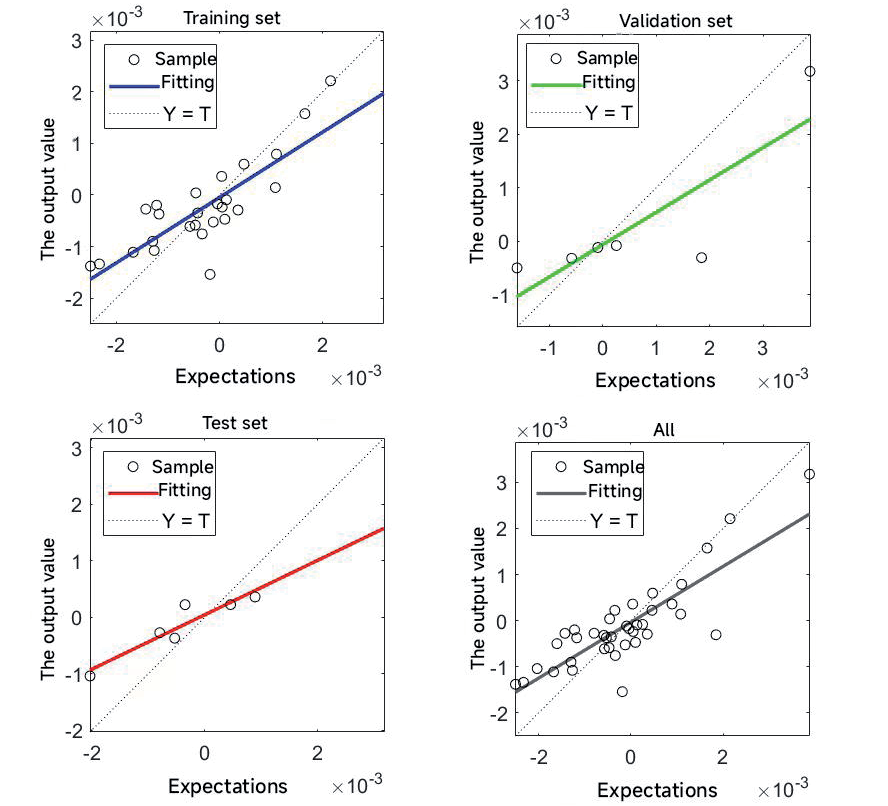
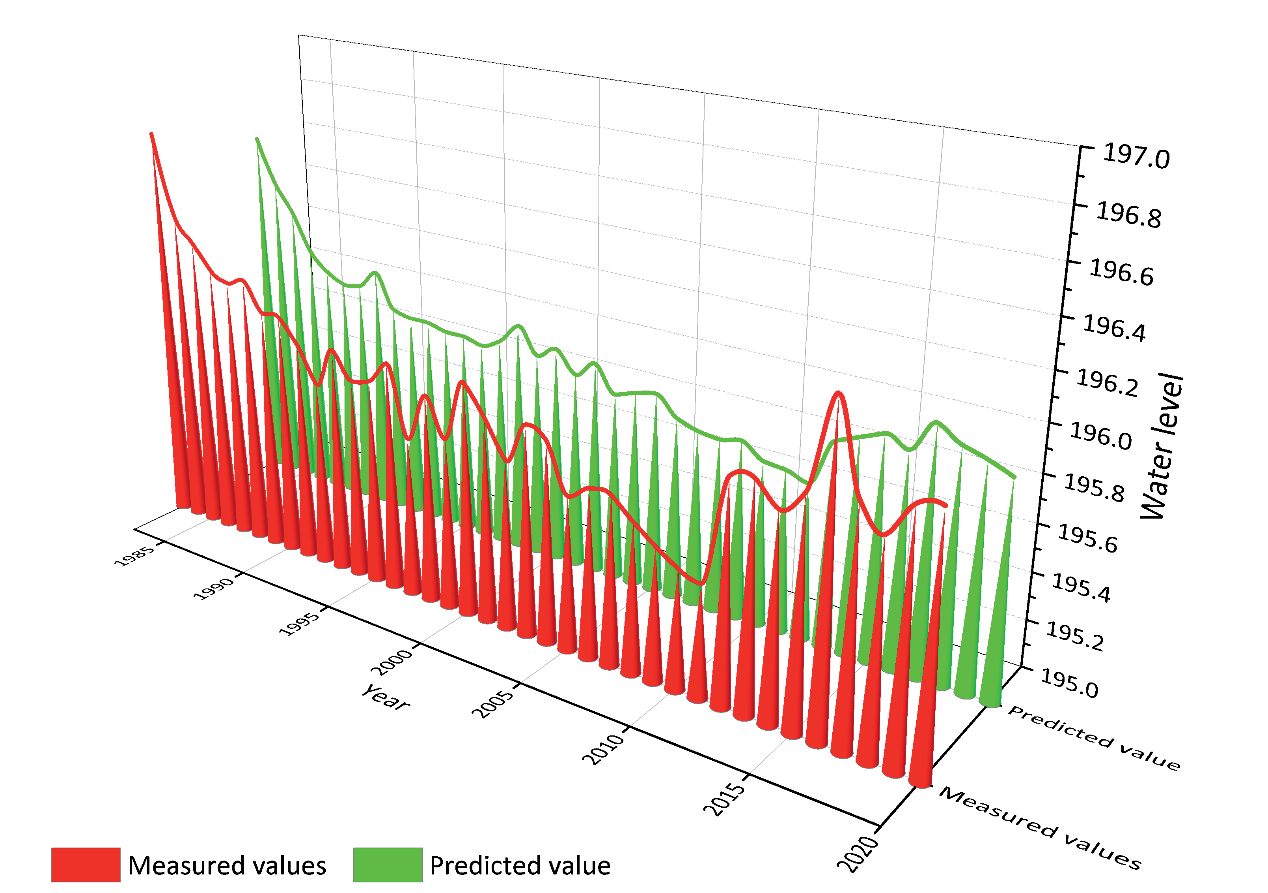
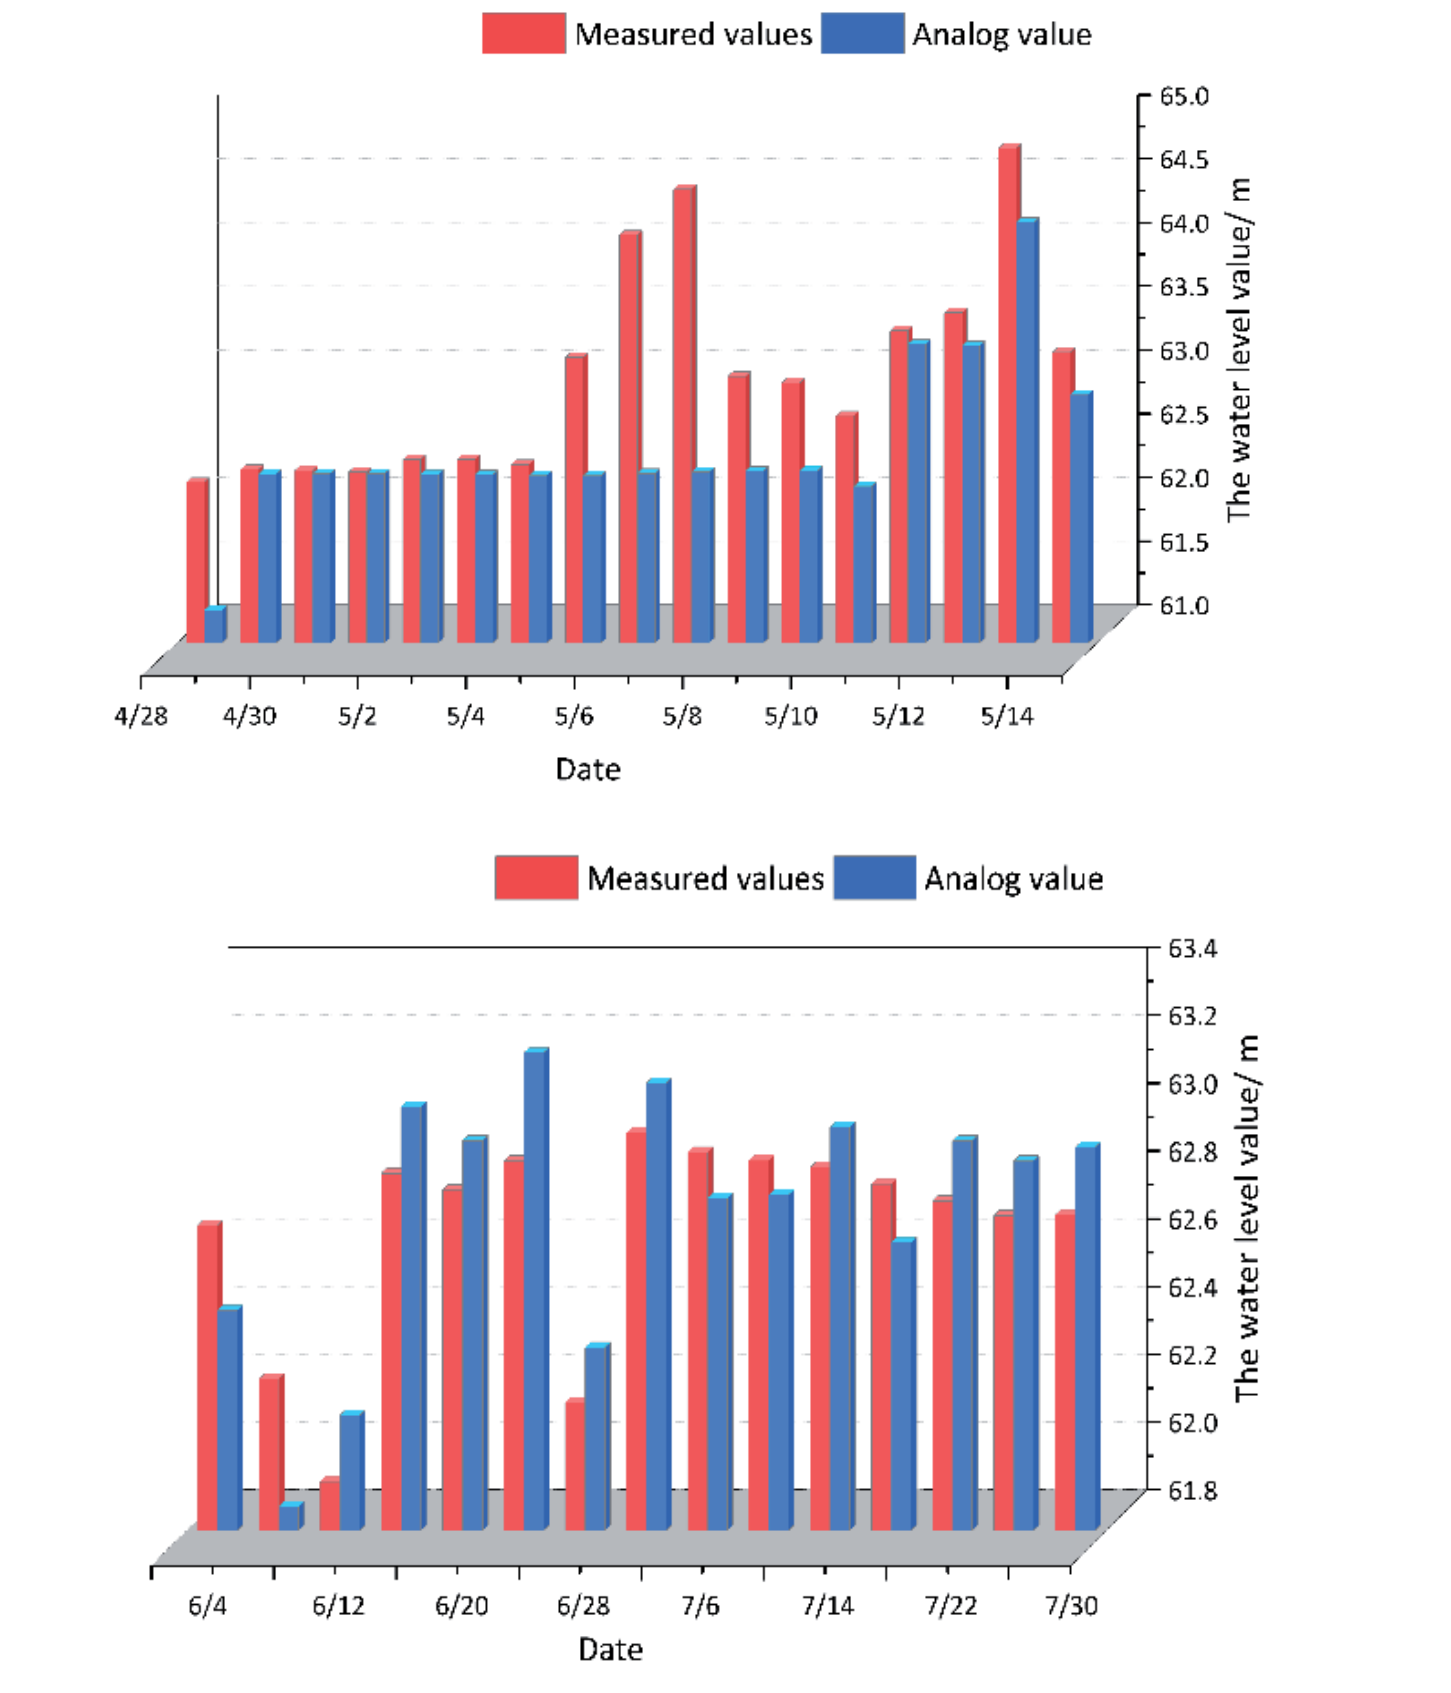
Fig. 9 shows the regression plot of the NARX neural network. When training the regression model, the expected and output values for the training, validation, test, and total samples show a linear correlation. The correlation coefficients for the training, validation, test, and total samples are 0.82, 0.84, 0.93, and 0.84, respectively. The range of deviation between the fitted line and the regression line for the sample is small, indicating that the model fit effect is better. Thus, the NARX neural network’s predictive modeling meets the water level prediction requirements in riverside wetlands.
The established NARX neural network water level prediction model is used to predict 37 groups of water levels in riverside wetlands from 1983 to 2020. The predicted results are shown in Fig. 10. As can be seen from Fig. 10, the absolute value of the annual minimum error is 0%, and the absolute value of the annual maximum error is 0.21%. 89% of the absolute data errors are not more than 0.1%. The results show that the prediction effect of the test model is good, and the model’s prediction accuracy is high. The prediction provides a scientific basis for utilizing water resources in the Yongding River basin, provides technical support for the formulation of the optimal allocation scheme of ecological water replenishment, and is of great significance to the flood control, regulation, and storage of the main stream and tributaries of the Yongding River.
MIKE11 Simulation Results Analysis
Verification Result
Based on the determined model and rate, the measured data of the ecological water replenishment period for the Lugou Bridge section in 2020 and 2021 are used to further verify the model. The verification results for the Lugou Bridge ecological water replenishment period in 2020 and 2021 are shown; the maximum error between simulated and measured values is 3.5% in 2020 and 0.6% in 2021 (Fig. 11). It can be concluded that the simulation results are basically in line with reality, and the model has good applicability.
Effect Evaluation
In order to explore the influence mechanism of ecological water replenishment on aquatic plant communities, the change in the growth area of aquatic plant communities under different water replenishment flows was studied and analyzed. By comparing the interannual changes in discharge in the upper, middle, and lower reaches of the riparian wetlands of the Yongding River (Beijing Plain), the hydrological conditions most suitable for the growth of aquatic plant communities were analyzed. As shown in Fig. 12, after the Yongding River began replenishing water in 2019- 2020, the average discharge in the lower reaches was greater than in the middle and upper reaches.
During the ecological recharge period in 2019, the average flow upstream was 18.66 m3/s, the average flow in the middle reaches was 19.58 m3/s, and the average flow downstream was 21.33 m3/s. When the supplementary water flow was 18.66-21.33 m3/s, the aquatic plant community in the riparian wetland of the Yongding River (Beijing Plain Section) expanded from 0 m2 (bare land) to 673,362.81 m2 in 2019. During the ecological water replenishment period in 2020, the average flow upstream was 55.47 m3/s, the average flow in the middle reaches was 55.67 m3/s, and the average flow downstream was 56.30 m3/s.
The average flow in 2020 was more than double that of 2019. However, although the aquatic plant community’s area is further expanding, the speed is obviously lower than that in 2019, indicating that flows exceeding 50 m3/s will slow down the community’s restoration effect. During ecological water replenishment in 2021, the average flow was 11.73 m3/s in the upper reaches, 13.03 m3/s in the middle reaches, and 15.25 m3/s in the lower reaches.
Water levels in the upper, middle, and lower reaches in 2020 are higher than those in 2019 and 2021. When the replenishment flow is greater than 50 m3/s, the water level in the upper reaches of 2020 is higher than that in 2019 and 2021, and more than 61.4 m. The upstream water level fluctuated greatly in 2021, and the upstream water level was maintained at about 60.9 m in 2019. In 2020, the water level in the middle reaches was about 38.5 m, and in the lower reaches, about 28.2 m. In 2019, the water level in the middle reaches was 37.7 m, and that in the lower reaches was between 27.7 m and 27.8 m (Fig. 13). From the above analysis, in order to optimize the restoration and growth of the aquatic plant community, the upstream water level should be about 60.9 m, the middle water level about 37.7 m, and the downstream water level between 27.7 m-27.8 m.
Therefore, by comparing the changes in simulated supplemental water flow and water level over 3 years in the upper, middle, and downstream reaches, it was analyzed that the restoration effect of the aquatic plant community would be slowed down if the supplemental water flow was too large and the water level exceeded 61 m. Too small supplementary water flow and low water levels not only have poor recovery effects on aquatic plant communities but also reduce aquatic plant communities and the area of outflowing aquatic plant communities. Therefore, according to the principle of economy, the effect of water replenishment in 2019 is the best. The range of water replenishment flow is 18.66~21.33 m3/s, so the water level in the upper reaches is about 60.9m, the water level in the middle reaches is about 37.7 m, and the water level in the lower reaches is between 27.7 m and 27.8 m. In the study of future water replenishment schemes, the ecological water replenishment flow based on the restoration of typical aquatic plant communities in riparian wetlands should be regulated between 18.66~21.33 m3/s.
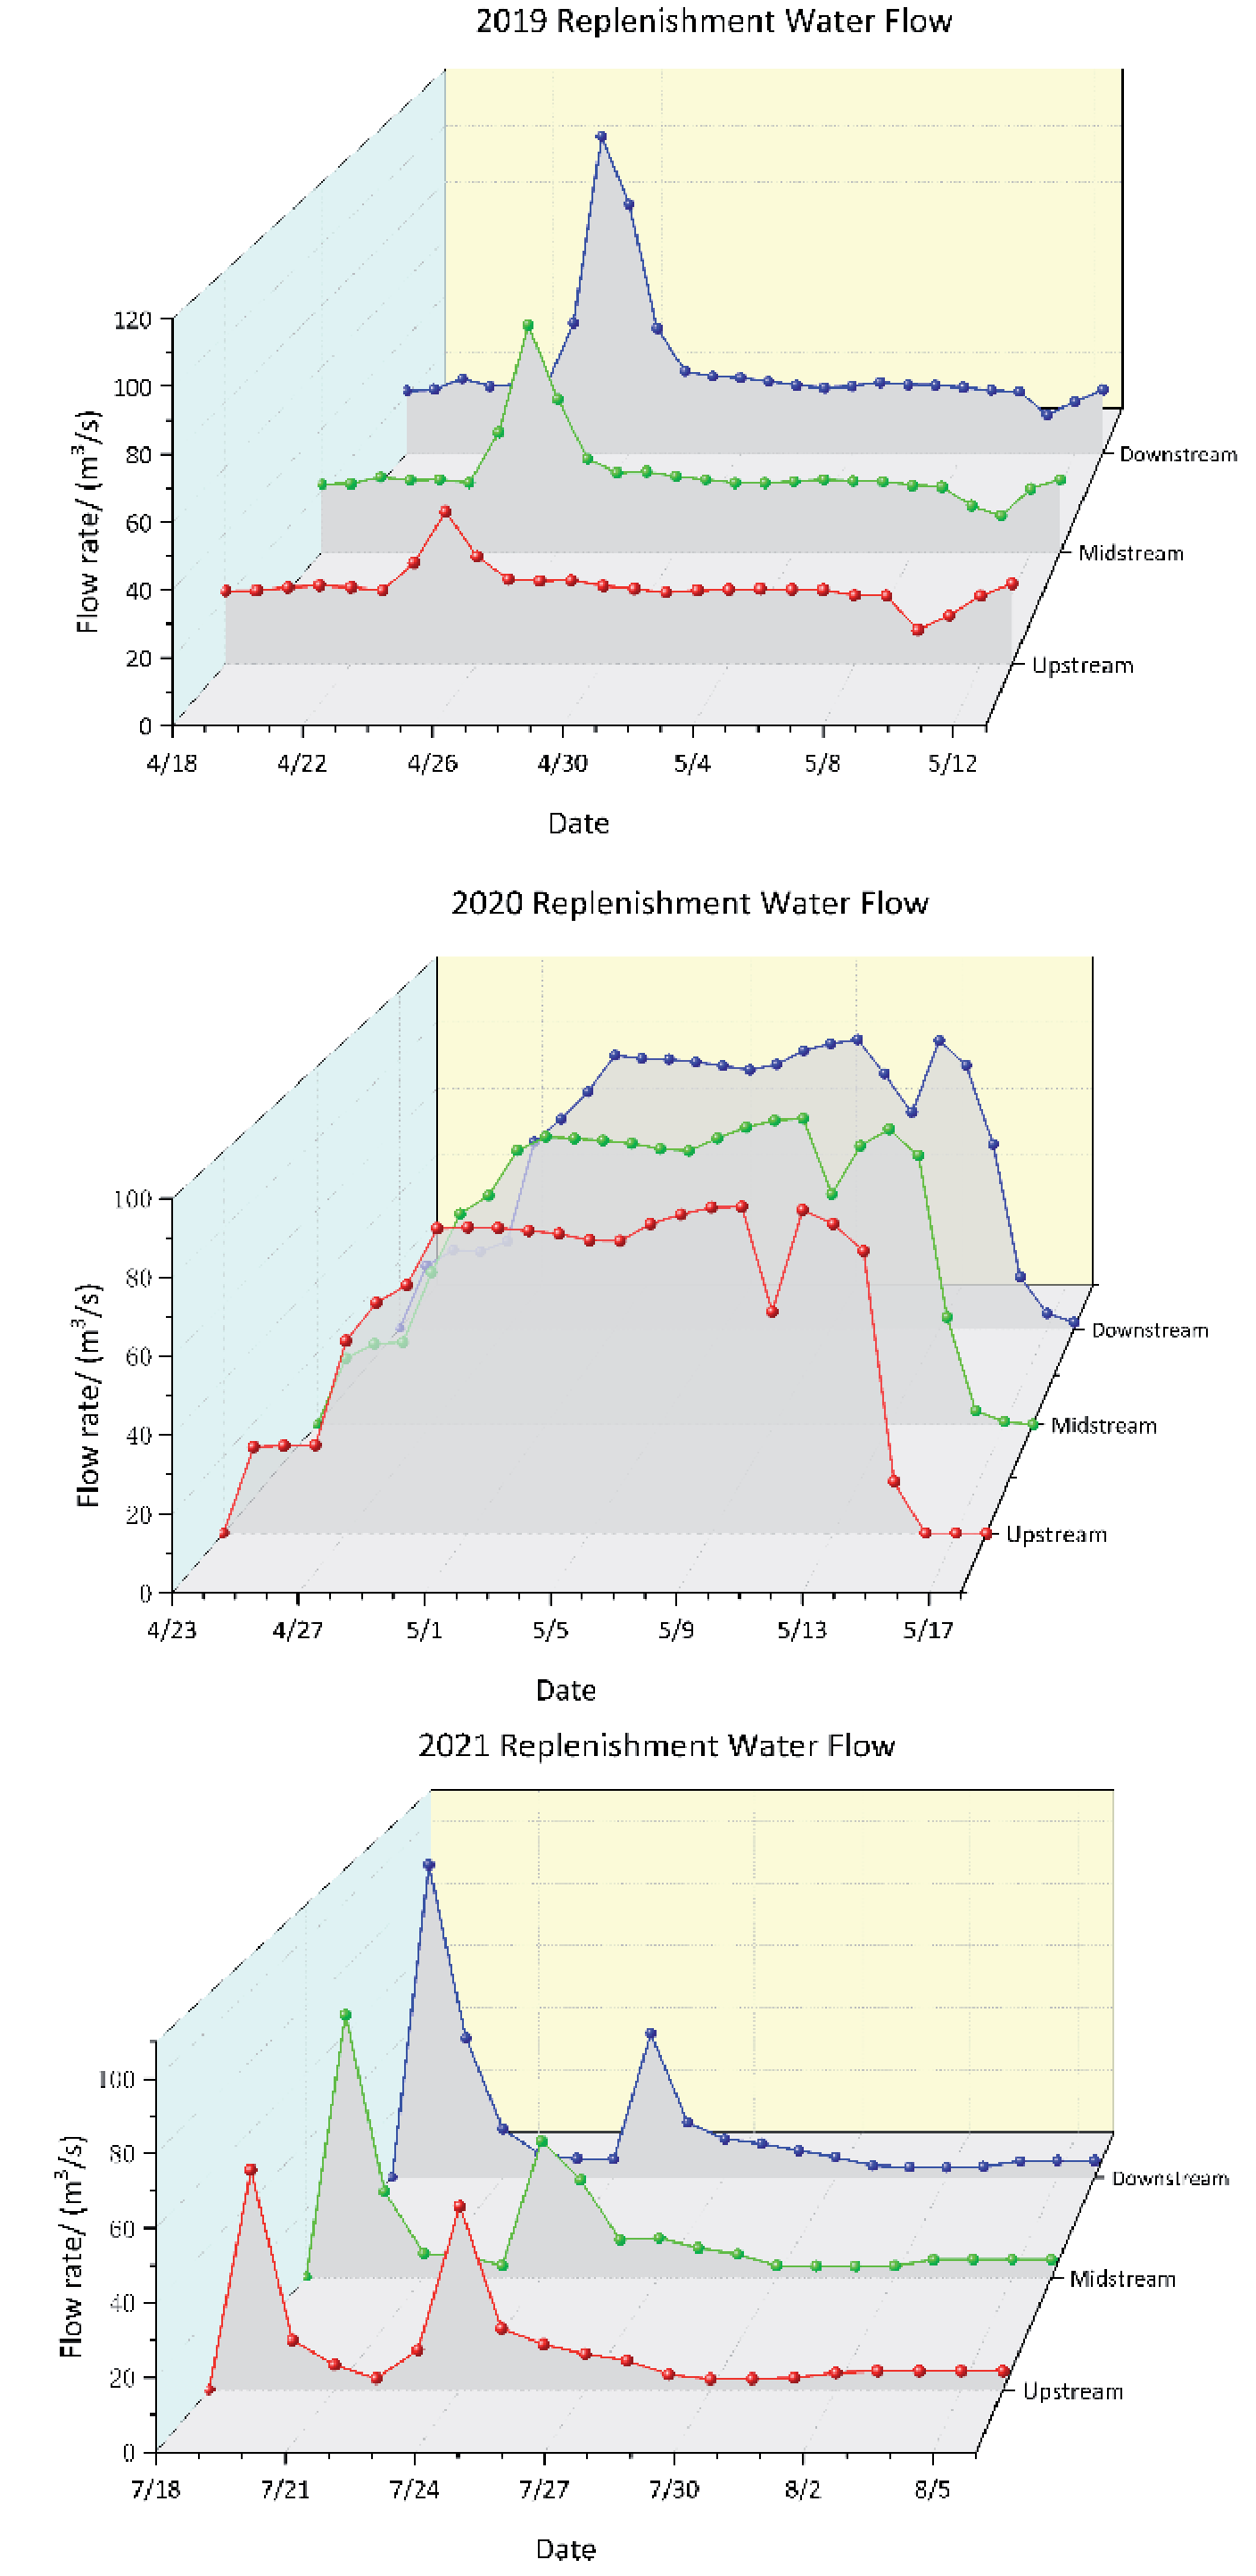
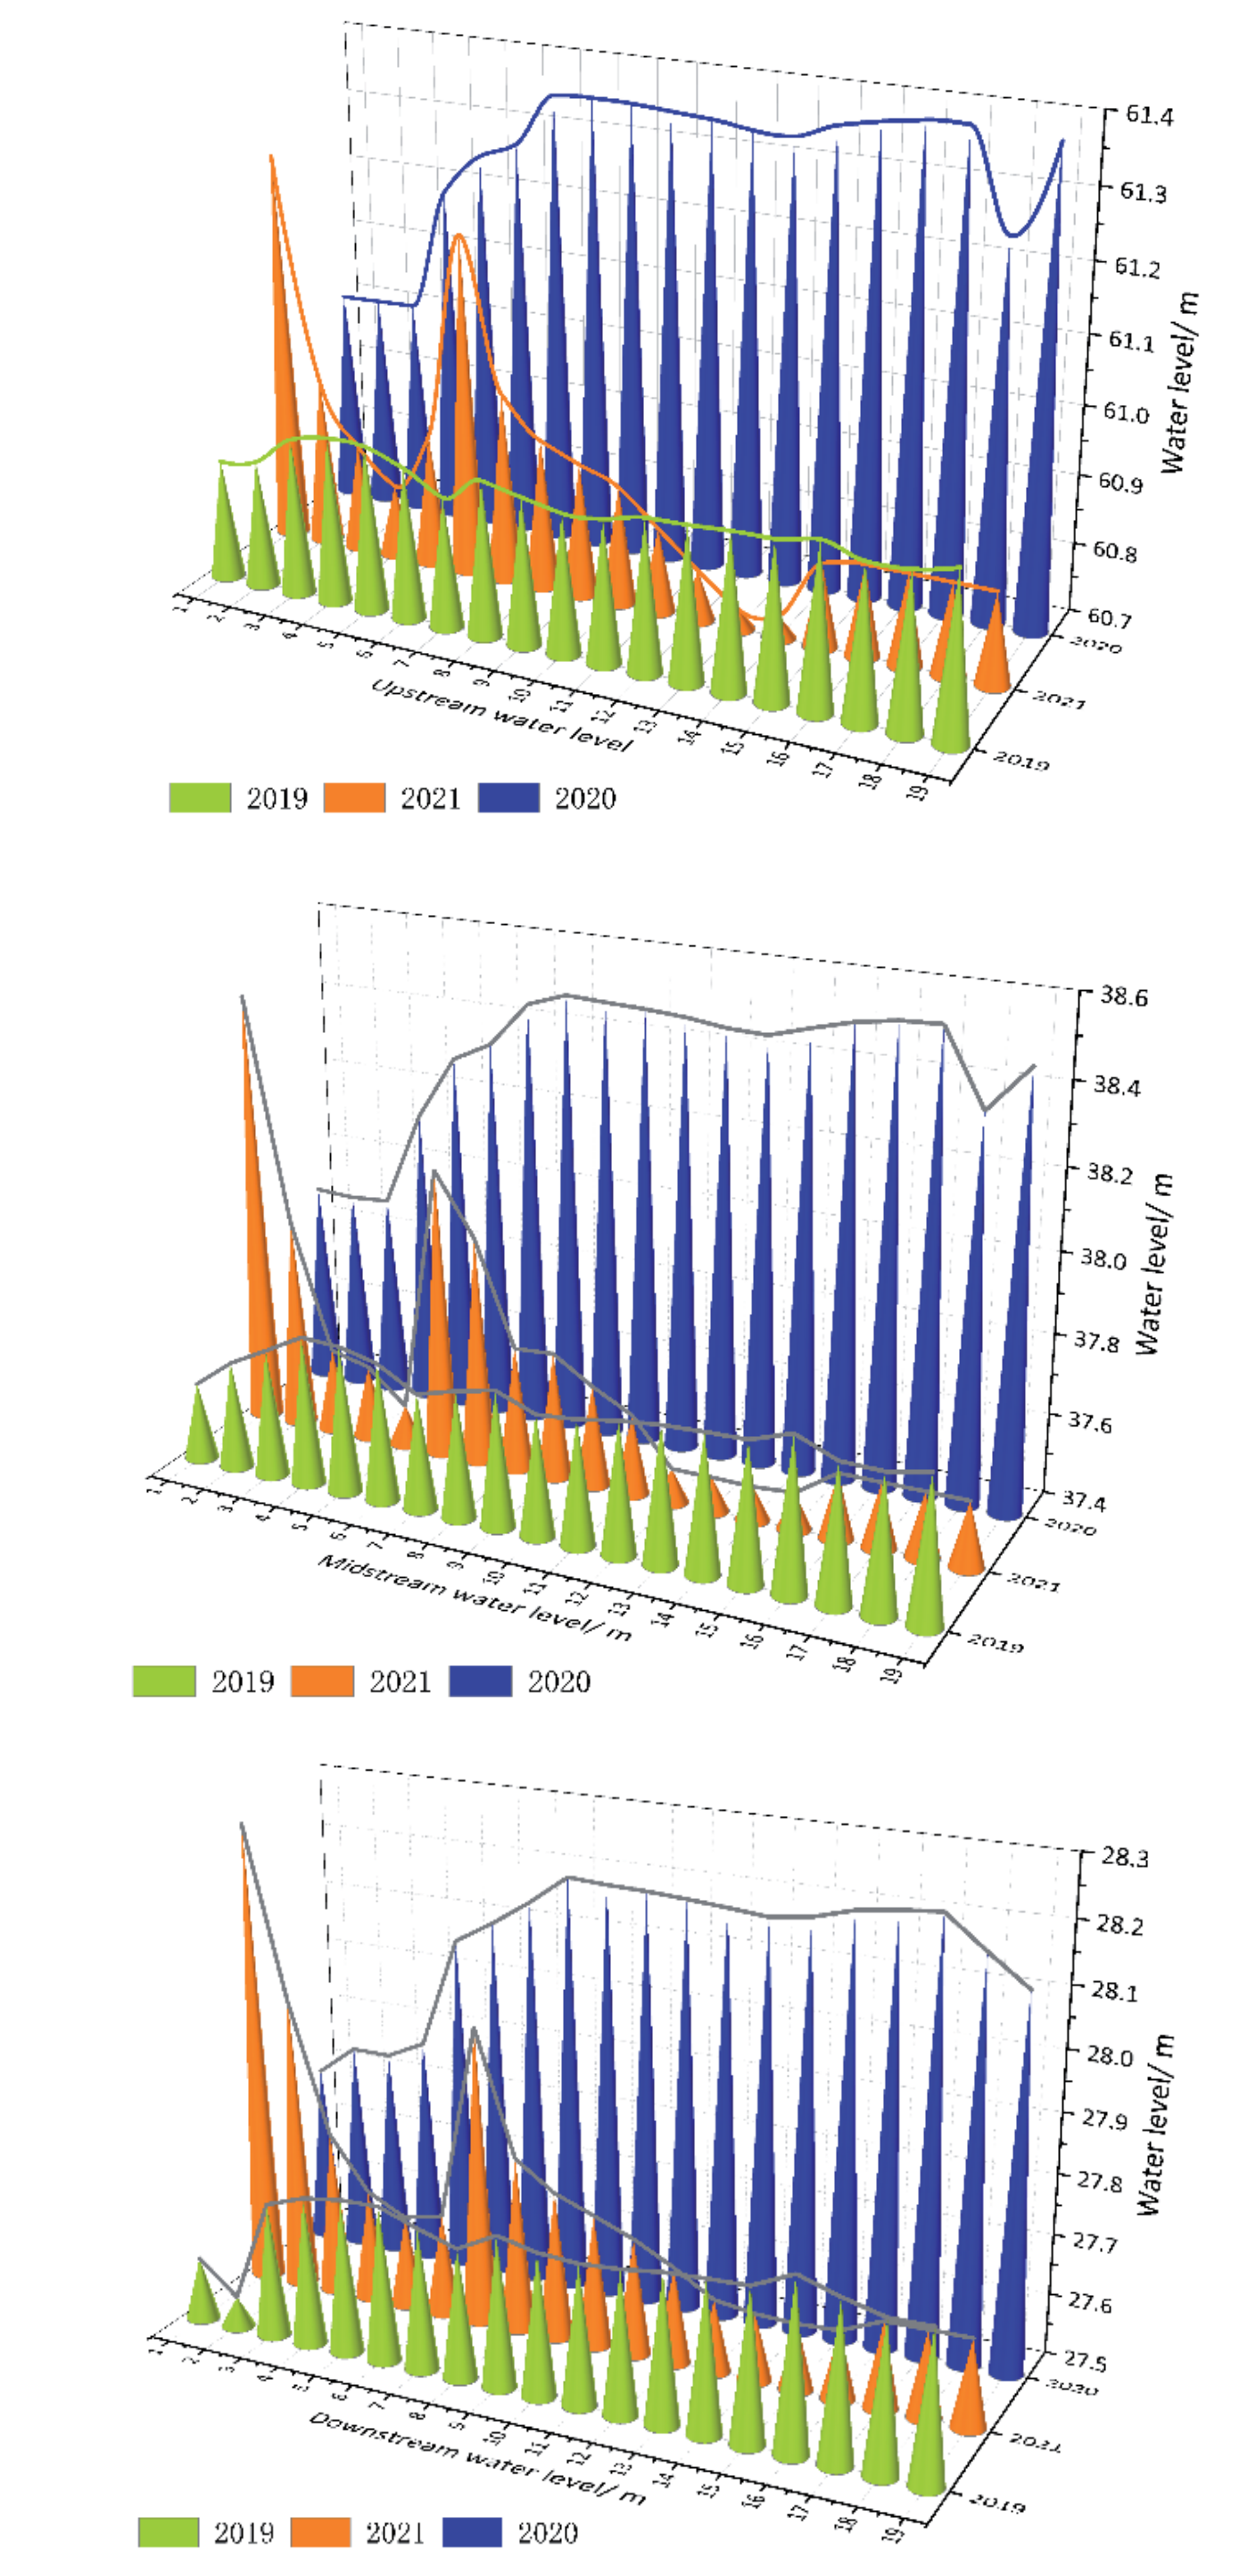
Fig. 14.
Distribution map of land use type and aquatic plant community by land use type and aquatic plant community from 2018 to 2021.
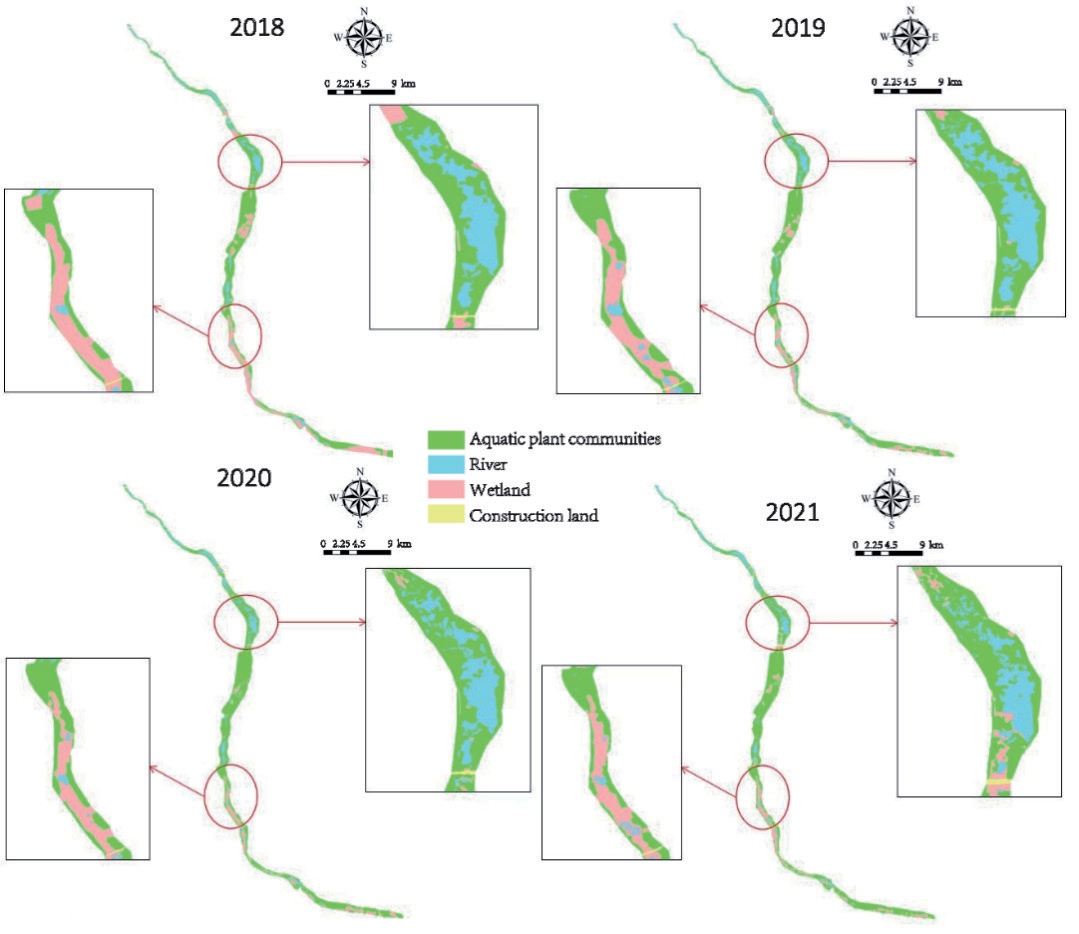
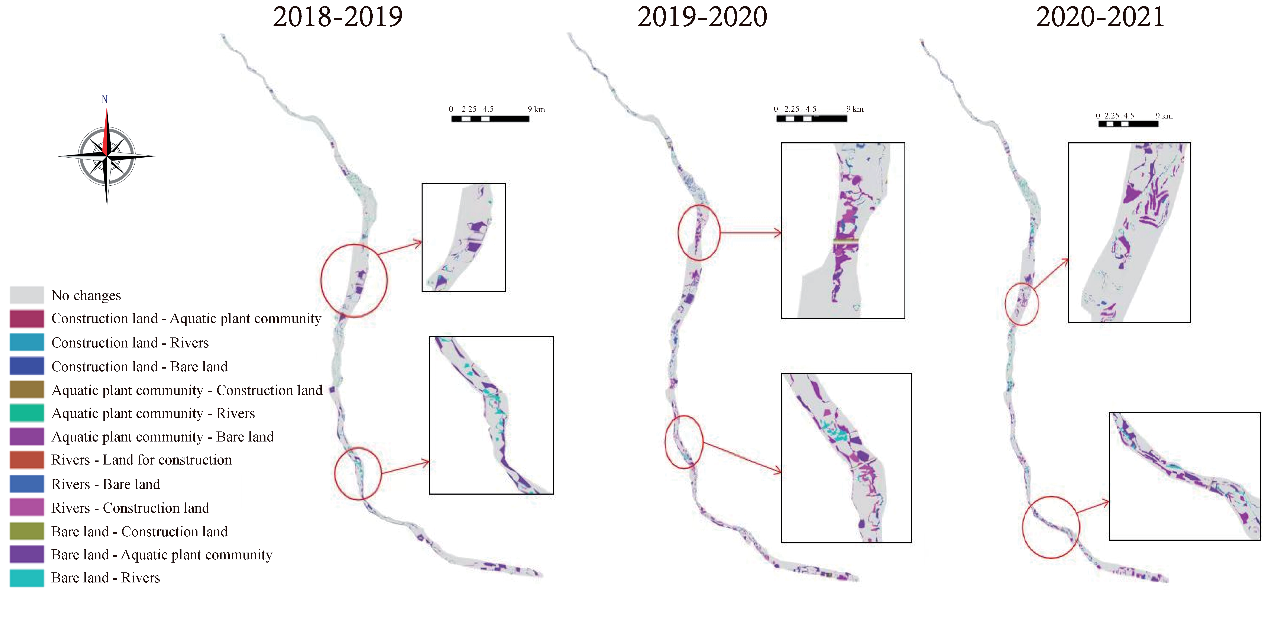
Table 1.
Statistical table of land types 2018-2021.
Characteristics of Aquatic Plant Community Patterns in Riverside Wetlands
Temporal Variation Characteristics of Land Use and Aquatic Plant Communities
The changes in land use types and aquatic plant community areas in the riverside wetlands of the Yongding River (Beijing Plain section) in 2018, 2019, 2020, and 2021 (Fig. 14) and the statistical results of the changes in the area of each land use type and aquatic plant community (Table 1) were analyzed.
Spatial Variation Characteristics of Land Use and Aquatic Plant Communities
Using ArcGIS software, we analyzed the land use maps derived from interpreted and classified remote sensing images from 2018-2021 (Fig. 15). This enabled us to examine the spatial distribution changes of aquatic plant communities in the riverside wetlands of the Yongding River (Beijing Plain section) during that period.
In 2018-2019, there were large-scale changes in the middle and upper reaches of the riverside wetlands of the Yongding River (Beijing Plain section), among which more bare land was converted into rivers and vegetation, and construction land was transformed into rivers. From 2019-2020, a large amount of bare land was converted into aquatic plant communities and construction land, and rivers were converted into vegetation and construction land. In 2020-2021, more bare land will be converted into vegetation and rivers, and the construction land along the river will be encroached upon and transformed into rivers.
Conclusion
This study takes the riverside wetland of the Yongding River (Beijing Plain section) as the research area and describes recent research trends regarding ecological water replenishment concepts and calculation methods and the impact of ecological water replenishment on the riverside wetland. The main findings are as follows:
(1) By Morlet wavelet analysis, it was concluded that the annual average water level of the riverside wetland of the Yongding River (Beijing Plain section) had main cycle variation characteristics of 12-31 a, and its central scale was 28 a. At the same time, the annual average water level has a first main cycle on the 28 A time scale, and the water level shows a dry-abundant-abundant-wither trend on the 28 A time series. Using a NARX neural network to build a prediction model, the absolute value of the annual maximum error is only 0.21%. The results show that the NARX neural network’s predictive modeling meets the water level prediction requirements of the Yongding River.
(2) By establishing a one-dimensional hydrodynamic model of the riverside wetland of the Yongding River (Beijing Plain section), we can compare simulated water replenishment flows for 3 years. Simulating upstream, middle, and downstream water level change and considering the economy of ecological water replenishment, if future ecological water replenishment aims at restoring aquatic plant communities, the water replenishment flow should be adjusted within the range of 18.66-21.33 m3/s in 2019. The upstream water level is maintained at about 60.9 m, the middle water level at 37.7 m, and the water level around m and downstream is maintained between 27.7~27.8 m.

