

Introduction
The original intention of environmental policy is to protect the environment. These policies include laws, regulations, and measures. In the 1990s, some scholars said environmental policy improves energy technology innovation of enterprises [1]. With the deepening of the research on energy technology innovation, more scholars have recognized the impact of environmental policies on it. Adebayo uses wavelet statistical tools to explain the relationship of Japan’s CO2 emissions with GDP growth, globalization, and renewable energy technology innovation (RETI). He made a limited analysis of Japan’s recent renewable energy use policy, which proved t hat the policy interacts with RETI in time and frequency. The research results show that the Japanese government has effectively curbed Japan’s environmental degradation by adjusting environmental policies [2]. Usman uses the principal component analysis method to construct a new technology innovation index, which is determined as the random impact model of population, wealth, and technology regression. The adverse effects of technological innovation, economic development, and population growth on environmental quality were 0.099%, 0.517%, and 0.458%, respectively. Through the non-causal test, it is found that there is a two-way causal relationship between financial and environmental policies and ecological footprint [3]. Abbasi examined the relationship between China’s GDP and fossil energy and renewable energy using two models. The research results show that renewable energy is very important for sustainable environmental goals. It is recommended that China consider launching long-term policies to reduce carbon emissions [4].
The existing literature has studied the interaction of RETI with political, economic, and other factors. The perspectives and methods of these studies are novel and diverse. However, relevant studies mostly attribute the impact of foreign policies on national RETI to “knowledge spillover” or “technology spillover”, ignoring the impact of foreign environmental policies on RETI through the “policy spillover” [5]. More importantly, when studying the correlation between renewable energy technology and politics, economy, etc., existing research does not take into consideration the multiplicity of energy transformation. The transformation process is cumulative rather than unique. Different economic development rates will have different impacts on the energy transformation potential [6].
For the above problems, the study builds multiple regression models and three different prediction models to process the relevant data of 10 countries from 2000 to 2020. The study explores whether environmental policies and policy quality have an impact on RETI, and analyzes the potential of China’s energy transformation in different situations, trying to provide reference for the renewable energy technology development and the upgrading of its structure.
Dynamic Impact of Environmental Policies on National Energy Transformation and Technological Innovation
According to the Organization for Economic Cooperation and Development database (OECD), the top 10 countries with the most energy transformation technologies patents are selected as samples. The data is from 2000 to 2020.
Weighted Average Method of Environmental Policy Intensity Based on the Capital Distance Between Countries
The dependent variable is RETI, which is measured by the percentage of national renewable energy technology patents in the total number of patents. The two are positively correlated [7]. The independent variables are National Environmental Policy (NEP) and International Environmental Policy (IEP). Table 1 is the common environmental policies [8].
Relevant research shows that the strictness, flexibility, and predictability of NEP can be measured by environmental policy strength, flexibility, and stability [9]. Liu Y uses the cost of pollution control, environmental public expenditure, and energy price as the substitute variables of environmental policy intensity [10]. The study uses the intensity of the 14 environmental policies in Table 1 to calculate the weighted average value to measure the intensity of the environmental policies of each country. The index score is between 0 and 6, with 0 indicating the lowest strictness of environmental policy and 6 indicating the highest strictness of environmental policy. When calculating IEP, to eliminate the interference of geographical distance, the capital distance between countries is taken as the weight, and the environmental policies of each country are weighted and averaged. As shown in formula (1).
In formula (1), i and j represent the country number. t indicates the year. n is the number of countries studied. Dis tan e indicates the geographical distance between national capitals. The geographical distance data between national capitals is from the Centre d é tudes prospectives et d’ information internationals.
The regulatory variable is administrative quality (AQ). Relevant research usually uses government effectiveness indicators to measure administrative quality, including intellectual property protection, taxation, administrative intervention, and other aspects [11]. The government effectiveness index is derived from the World Bank Open Date.
Table 1.
Common environmental policies.
The control variables are Knowledge Stock (KS), Advanced Technology Export (ATE), Fossil Fuel Consumption (FFC), Renewable Energy Generation (REG), Research Expenditure (RE) and International Environmental Agreement (IEA). Among them, KS represents the total amount of knowledge accumulated in the country, which is used to measure the absorptive and creative capacity of knowledge [12]. As shown in formula (2).
In formula (2), t = 2000, ..., 2020, s represents the earliest date published by the International Renewable Energy Agency. The earliest time (1975) of national renewable energy patent data published by the International Renewable Energy Agency is taken as the benchmark for integrity. δ represents the attenuation rate, which is 15%-20% with reference to relevant research [13].
ATE is the proportion of high-tech products exports to manufactured goods exports. FFC represents the percentage of fossil fuel in total energy consumption, which can describe the energy structure laterally. REG represents the percentage of renewable energy (excluding hydropower) in total power generation, which can reflect the construction of renewable energy infrastructure. RE is the proportion of public sector R&D expenditure in Gross Domestic Product (GDP), which can reflect the output efficiency of innovation patents. IEA is a dummy variable, taking whether to sign the Kyoto Protocol as the basis of assignment. Considering the lag of the impact of national policies, when a country signs the agreement before July, the IEA of the current year is assigned a value of 1, otherwise it is 0. Table 2 is the variables.
Panel Model Construction and Sample Descriptive Statistical Results
To explore the impact of NEP and IEP on RETI and the possible lag effect of policy impact, it is needed to build a lag effect panel model. Relevant research points out that the lag effect of policy usually includes policy cognition lag, implementation lag, and effect lag [14]. When studying the lag of environmental policy, the lag of the patent application process should be considered. Yang pointed out that the lag time between China’s environmental policy and related patent output is usually 2 to 3 years, and some studies believe that the lag time of the effect of environmental policy is greater than 4 years [15-16]. Therefore, the panel model mainly discusses the impact of NEP, IEP, AQ and other variables on RETI at different times. As shown in formula (3).
Table 2.
All variable indicator measures and data sources.
In formula (3), x represents the lag period. β0 is a constant term. β1, β2, and β3 are regression coefficients of corresponding variables. For the control variable vector, γ is the regression coefficient vector. μ represents national non-observed effect. η represents time non-observation effect. ε represents random error term.
An interaction effect model needs to be built to discuss the impact of the interaction between AQ and NEP on RETI. As shown in formula (4).
In formula (4), NEP×AQ represents the interaction between NEP and AQ, and β4 is the regression coefficient When the coefficient of interaction term is positive, AQ has a positive regulating effect on NEP. When it is negative, AQ has a negative regulating effect on NEP. Table 3 is the descriptive statistics on sample variables.
In Table 3, the average of RETI is 0.004 and the maximum value is 0.007. The average share of renewable energy patents in 10 sample countries is 0.4% and the maximum share is 0.7%, which is basically in line with the current situation of renewable energy patent applications in various countries. The mean of NEP is 1.872, the SD is 0.816, and the minimum is 0.377. According to the OECD classification, NEP is a high intensity area between 1.35 and 6.00, indicating that the environmental policy intensity of most sample countries is high. However, there are some countries with low intensity of environmental policies. The maximum of IEP is 3.545, with the minimum of 0.225, the average of 1.429, and the SD of 1.733. This shows that for the sample countries, the differences in the intensity level of environmental policies formulated by other governments are increasing. The average value of AQ is 1.144, and the SD is 0.713, indicating that the sample countries have a small gap in the evaluation of environmental policy quality.
Experimental Results and Analysis
STATA 17.0 is used for regression analysis of the panel model. Before constructing the interaction items, the independent variables and the adjusting variables are standardized.
Model Inspection and Data Analysis
Considering the economic significance of the lag model, the lag period of environmental policy is introduced, which effectively reduces the correlation probability of the sub-variables. Table 4 is the results of correlation analysis of main variables.
In Table 4, the dummy variable IEA is excluded. * means significant at the level of 10%. On the whole, the correlation between the main variables is not high and all variance expansion coefficients are less than 3. The unit root test is applied in the main variable series preventing false regression. Table 5 is the results.
In Table 5, T, C and L are the time trend term, constant term, and lag order of the model during the test. All root test P values indicate that the model meets the stable sequence condition. STATA is selected as the data analysis tool to carry out regression analysis on the policy lag model. All variables have been standardized. Table 6 is the regression result.
In Table 6, *, * * and * * * are significant at the level of 1%, 5% and 10% respectively. The values in the brackets of the regression coefficient are t statistics.
The Correlation between Foreign Environmental Policies and RETI
From Table 6, foreign environmental policies show great positive influence on RETI. These policies reflect comprehensive information such as the government’s key support for relevant industries, regional renewable energy potential, and national energy structure optimization. The promulgation of environmental policies can directly enhance a country’s need for renewable energy technologies in the international energy market.
Table 3.
Descriptive statistics for sample variables.
Table 4.
Correlation test of main variables.
Table 5.
Root Tests for primary variables.
Table 6.
Regression analysis results of policy lag model.
According to the data of Lag two periods and Lag three periods in Table 6, the IEP coefficient of Lag two periods and Lag three periods is 0.923 and 0.958, both of which are significant at the level of 5%. The NEP coefficient of Lag two periods and Lag three periods is 0.512 and 0.467 respectively, which are not significant. In the Lag four periods, the IEP coefficient is 0.825 and the NEP coefficient is 0.232, which are significant at the level of 1% and 5% respectively. This shows that the impact of international policies on RETI is prior to domestic environmental policies.
The possible reason for this situation is that the foreign trade of renewable energy (including import and export, energy trade and technology trade) has made China pay more attention to foreign environmental technology standards and environmental policies. There are two examples that can support this conjecture. First, most of the production capacity of China’s photovoltaic industry depends on the international market [17]. Second, the total export of biomass fuel from the United States to China is more than ten times of the total import [18]. China’s foreign trade enterprises make innovative decisions by reasonably predicting international environmental standards, rather than being driven by domestic environmental policies. For RETI, the impact of foreign countries on China comes not only from the knowledge spillover generated by international cooperation or technology transfer or introduction, but also from the policy spillover of IEP.
The Correlation between Domestic Environmental Policies and Technological Innovation in Energy Transformation
Relevant research shows that for every 1% growth in the intensity of China’s domestic environmental policy, the funding for renewable energy research and development increases by 28.14% on average [19]. Table 6 shows that NEP has a great influence on RETI. First, NEP environmental policy can effectively promote enterprises’ investment in RETI. The more stringent the NEP is, the more enterprises are inclined to invest funds in research and development.
In Table 6, the hysteresis coefficients of NEP are 0.512, 0.467, and 0.232 respectively. Among them, the coefficients of Lag two periods and Lag three periods are not significant. The coefficient of lag four periods is significant at the level of 1%. This is due to the lag effect of China’s environmental policies and the cumulative effect of RETI. The development of RETI needs the accumulation of key factors such as knowledge and capital, which is embodied in the concentrated emergence of technological achievements after several years of policy implementation [20]. These two effects may lead to a lag of 4 years or more between NEP and RETI.
The study introduced the interaction term of NEP and AQ, and discussed the regulatory role of the interaction term in Table 6. In Table 6, the main effect of NEP in the lag four periods is obvious. The interaction item NEP × AQ coefficient is 0.156. R2 increased from 0.552 to 0.624, that is, the goodness of fit increased by 13.04%, which indicates that AQ’s regulatory effect on NEP has a promoting effect on RETI.
Analysis of China’s Energy Transformation Potential
The total energy emission index of a country or region is set as TEMI, the emission intensity as EI1, and the energy intensity as EI2. Linear regression model, compound growth model and grey system model are used to analyze the change rate of the three variables and predict the future trend [21-23]. The linear regression model is shown in formula (5).
In formula (5), In formula (5), a and b are the parameters needs estimated. t = 2000, ..., 2050. Formula (6) shows that it is in line with the growth model.
In formula (6), X0 is the base year, taken as 2000, and r is the inherent growth rate. The least squares estimation method is used for calculation, as shown in formula (7).
In formula (7), a = ln X0, which is the logarithm of the base year. a = ln (1 + r). Inherent growth rate r = exp(b) – 1. When restricted by environmental conditions, X will slow down its growth. The grey system model is shown in formula (8).
In formula (8), a one-time accumulation of the initial time series forms a new one. The differential formula is shown in formula (9), and the discrete response is shown in formula (10) [24, 25].
In formulas (9) and (10), the parameters to be estimated can be obtained by the least square method. The emissions caused by any energy source are relatively stable, while the energy structure continuously changes [26]. Various methods of unit energy consumption are integrated into a comprehensive emission index EI1t, which is used to compare the emission intensity of different energy structures in different years, namely the composite emission index. Formula (11) is the calculation.
In formula (11), EFuv is the uth emission factor of the vth energy (uniformly calculated by oil equivalent). Rvt is the percentage of the vth energy in the total energy consumption in year t. Wu is the environmental impact weight of emission factor u. Since carbon dioxide is the main emission factor, for the convenience of calculation, the environmental impact weight of carbon dioxide is 0.5, and other emission factors are 0.1. The calculation of total emission index under different scenarios is shown in formula (12).
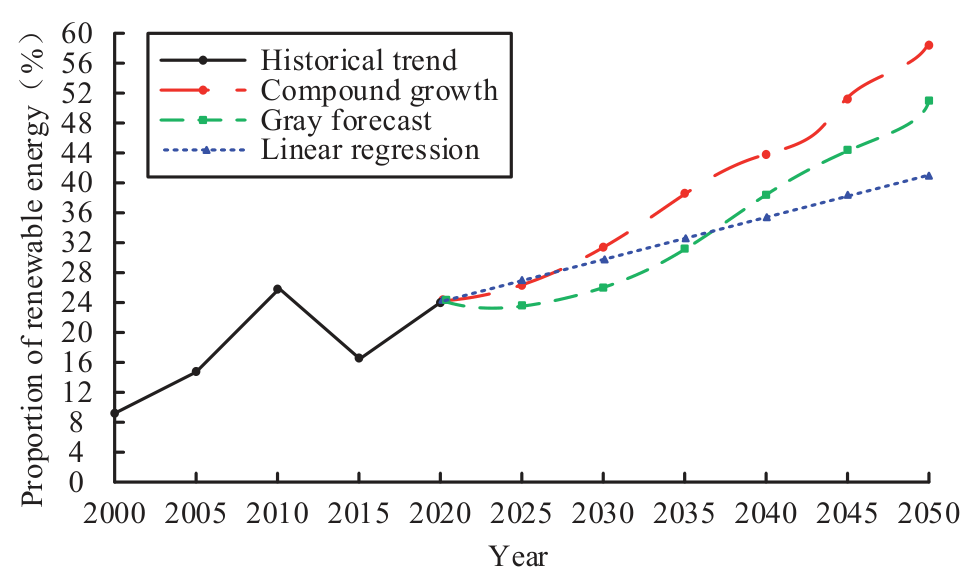
In formula (12), TEMIt is the total emission index. The higher the value, the more emissions. Generally, GDPt shows a fluctuating growth trend, while EI1t and EI2t show a fluctuating decline trend. When the change trends of the three variables are different, multiple scenarios will appear [27]. The predicted results of China’s energy structure are shown in Fig. 1.
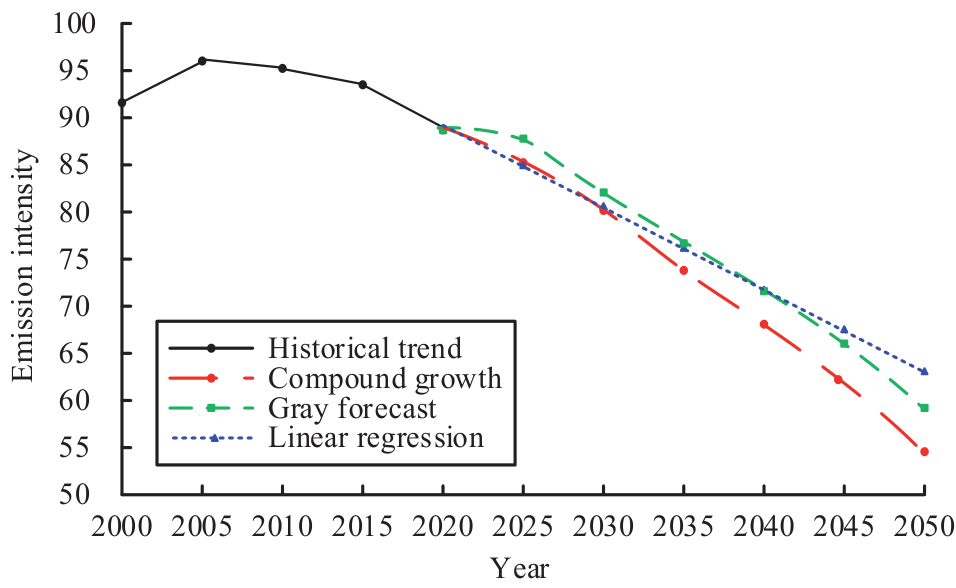
In Fig. 1, the linear model basically fits the average growth rate from 2000 to 2020. Renewable energy consumption is expected to account for more than 40% in 2050, which is a realistic goal. The simulation of the composite growth and grey prediction model shows nonlinear growth, and their growth rate is faster. Renewable energy consumption is expected to account for 52% and 58% respectively in 2050. It is needed to strengthen the energy structure adjustment, support renewable energy technologies, and especially increase the expenditure on renewable energy technologies [28]. The composite emission intensity of China is shown in Fig. 2.
In Fig. 2, the composite emission intensity per unit of energy consumption fluctuates and decreases with the increase of renewable energy, from 92% in 2000 to 87% in 2020. The composite emission intensity can reflect the structural characteristics of energy consumption. It has a certain linear relationship with the proportion of renewable energy [29]. Among them, the decline rate of the linear model is relatively slow, reaching 65% by 2050, down 22% from 2020. The grey system model is 59% by 2050, and the decline rate is slow first and then fast. The compound growth model has the fastest decline rate, 54% by 2050.
Influenced by the global energy market environment, China’s energy intensity is gradually declining [30]. Based on the constant price of US dollars in 2000, China’s energy intensity in 2000 was $1 for 0.78 kg of standard oil, and by 2020 it will drop to $1 for 0.51 kg of standard oil, which goes down for 34.62%. Among them, the decline rate is relatively fast from 2005 to 2010, and relatively slow from 2010 to 2020. The historical change and future trend forecast of China’s energy intensity are shown in Fig. 3.
In Fig. 3, the downward trend of the linear regression model is flat. The energy intensity in 2050 is about 0.32 kg of standard oil per dollar, which is 37.25% lower than that in 2020, and the decline rate has little change. The grey prediction model has a rapid downward trend, and the energy intensity in 2050 is 0.18 kg standard oil per dollar. Compared with 2020, it decreased by 64.71%. The rate of decline of the composite growth model was first fast and then slow. The energy intensity in 2050 was0.22 kg oil per dollar, down 56.86% compared with 2020. The grey prediction model and the compound growth model have little difference in predicting. It is difficult to achieve these two goals. In addition to further increasing the proportion of renewable energy expenditure in public expenditure, supporting laws and regulations are also required to restrict relevant entities. Relevant research shows that China’s energy intensity in 2030 will be 0.32-0.48 standard kilograms of oil (0.42, 0.38, 0.31 for the three models in this study) [31-33], calculated at the constant price of US dollars in 2000.
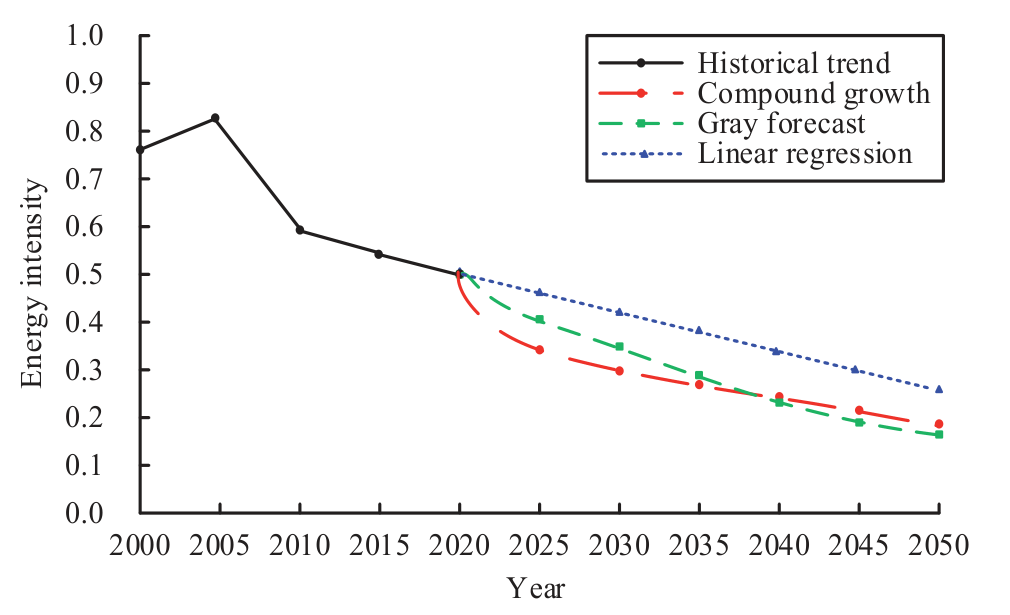
It is worth noting that even if China’s energy intensity reaches $1 for 0.18 kg of standard oil in 2050, it is still at a disadvantage compared to developed countries. Relevant research shows that in 2013, Japan’s energy intensity was $1 for 0.03 kg of standard oil, and the average energy intensity of G7 countries was $1 for 0.15 kg of standard oil [34, 35]. This means that even after 2050, China’s energy intensity still can be greatly declined.
Relevant research shows that China’s economy will enter a stable stage after more than 30 years of rapid growth. The prediction results of scholars are different, but the approximate range is 5%-8% [36-38]. It is assumed that China’s GDP growth has a certain deceleration, as shown in formula (13).
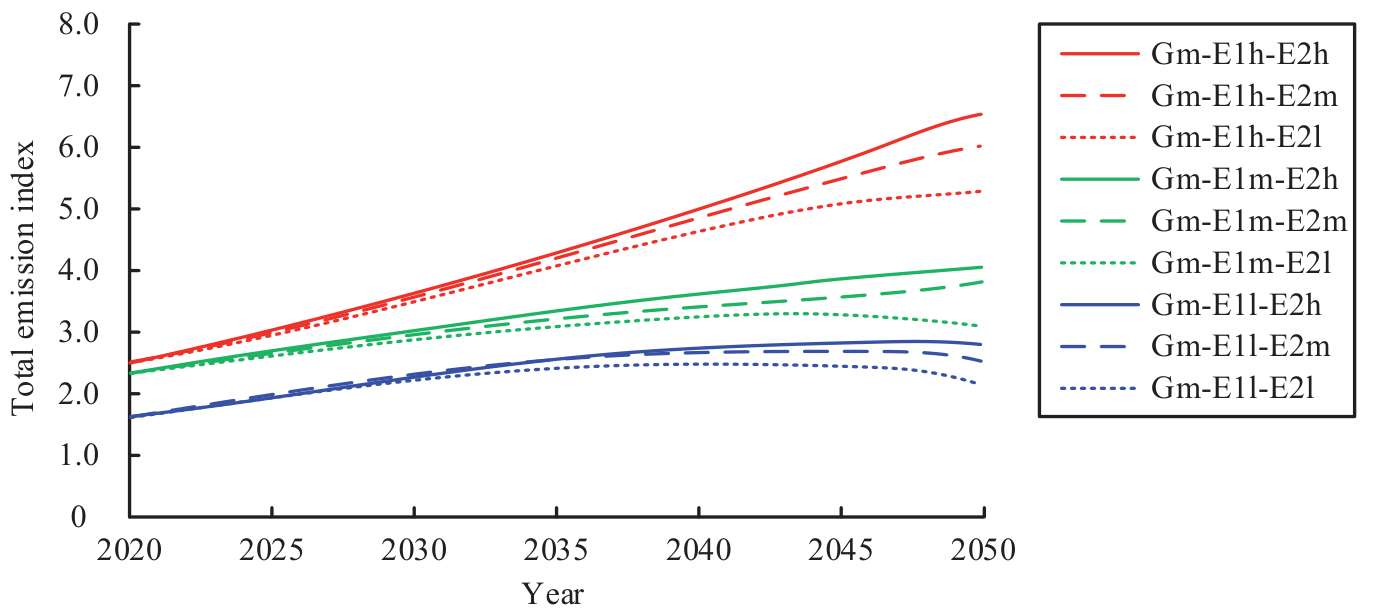
In formula (13), GDP0 is the value of the base year. t = 1, ..., 29. α is the deceleration level, taking α = 0.1% or α = 0.05%. Then the change trend of China’s total emission index has a plural situation, as shown in Figs. (4) and (5) (6).
In Fig. 4, China’s GDP keeps growing at a high speed, so in all cases, the total emission index will not be close to the peak by 2050. Although reducing emission intensity and energy intensity is conducive to reducing the total emission index, it cannot achieve the desired effect.
In Fig. 5, China’s GDP has maintained a moderate growth rate. As long as the energy intensity and emission intensity are low enough, the change of the total emission index will become flat. When the energy intensity is medium and the emission intensity is low, the total emission index will reach its peak around 2050. When the energy intensity is low and the emission intensity is medium or low, the total emission index reaches its peak in 2048 and 2047, respectively.
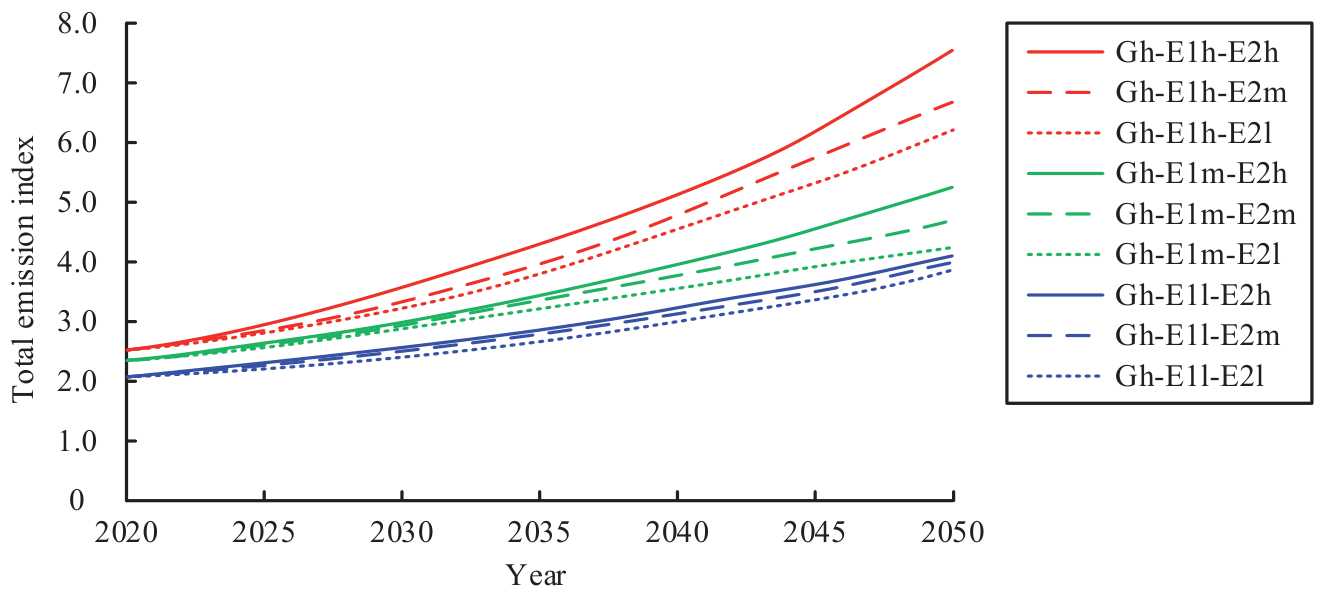
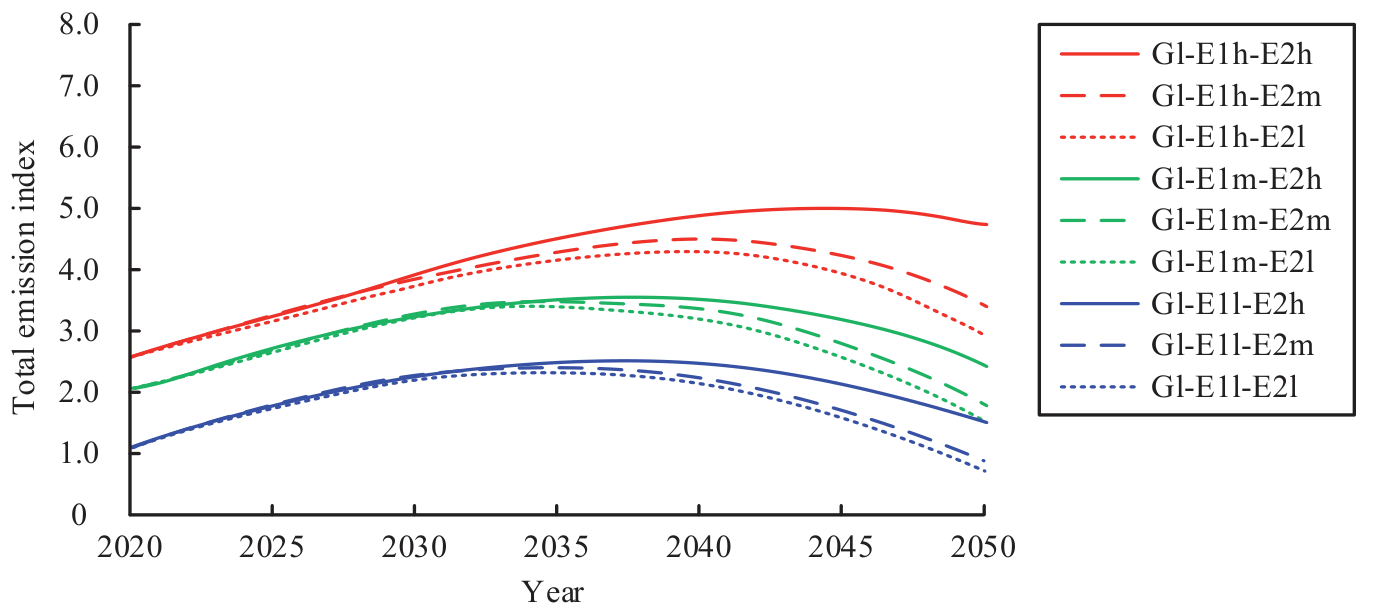
In Fig. 6, China’s GDP has maintained a low growth rate. When the energy intensity decreases, the total emission index will decline significantly. When the emission intensity is reduced from high to medium, the total emission index can also be significantly reduced. In the most ideal scenario, China will reach the peak emission around 2035. This means that China can obtain a significant space for emission reduction by reducing energy intensity and emissions.
Political Suggestions
First, the Chinese government should design and plan domestic environmental policies more scientifically. Reducing energy intensity is the primary target, supplemented by reducing emission intensity. The pollution behavior is rigidly constrained by setting strict emission thresholds and energy tax standards [39]. At the same time, policy support is needed for the benefits of technology and energy structure involvement, which must surpass the emission increase benefits from GDP growth.
Secondly, the efficiency of system implementation and the administrative quality should be improved. Relevant departments should find ways to improve the transparency of the promulgation and implementation of environmental policies and provide enterprises with standardized and unified policy caliber. The laws and regulations regarding the protection of technology property rights and the authorization review of renewable energy technology patents should be improved. Enterprises are encouraged to adapt to the market by reducing costs and improving efficiency. Policy guidance reduces investor risk and realizes the transformation of the renewable energy industry driven by national subsidies into enterprise competitiveness improvement [40].
Finally, the communication and exchange of international environmental policies need to be strengthened. The country should carry out in-depth cooperation with other economies in such fields as environmental protection policy, pollution prevention and control, and circular economy. At the same time, an information feedback mechanism to respond to foreign environmental policies should be built to pay close attention to foreign environmental policies that affect national RETI.
Conclusions
The study assesses the impact of domestic and international environmental policies on national RETI across 10 countries with the highest patent counts from 2000 to 2020. Using multiple regression analysis, the study examines the regulatory effects of institutional quality on policy efficiency. Additionally, three models predict the potential of China’s energy transformation against varying economic growth rates. Key findings include: (1) Both domestic and international environmental policies positively affect RETI. Domestically, policies stimulate technology R&D through strict regulations and flexible oversight. Internationally, they enable access to foreign tech standards, thus driving competitive innovation. (2) The influence of international policies on RETI precedes that of domestic counterparts, suggesting a "policy spillover" over "technology spillover." They assist companies in anticipating global tech trends and, with international trade, reduce the lag between RETI advancements and policy adjustment. (3) Administrative quality positively moderates the relationship between domestic policy effectiveness and RETI promotion, underscoring the crucial role of policy enforcement in transformation processes. (4) Projections based on 2000 dollar values suggest that by 2050, China's emission intensity could decrease to 54%-65%, and energy intensity could decline from 0.18 to 0.32 kg of $1. (5) China's total emission index is unlikely to peak by 2050 with high GDP growth; however, with medium growth rates, the peak is expected around 2047-2048, and with low rates around 2035.
The study’s innovative contribution lies in validating the “policy spillover” effect and highlighting the positive regulatory role of administrative quality. It confirms the link between RETI and energy structure enhancement, showing that while technology innovation drives short-term gains, structural evolution gains importance as tech barriers emerge. Nonetheless, it overlooks external factors influencing energy transformations, such as social-market perceptions, consumer behaviors, and, particularly, household incomes, which significantly impact new energy adoption. Future research could integrate institutional economics and cognitive choice theories to address these gaps.

