

Introduction
The relationship between tourism and environmental sustainability is bidirectional, with tourism development relying on the natural environment while also affecting it in various ways [1, 2]. According to the World Tourism Organization's (UNWTO) report on climate change and tourism, published in 2008, tourism contributes approximately 5% to 14% of global warming and forecasts that carbon emissions from tourism will continue to rise in the coming decades. A study indicates [3] that global travel and tourism emissions increased by 3.5% annually from 2009 to 2019, outpacing the
Introduction
The relationship between tourism and environmental sustainability is bidirectional, with tourism development relying on the natural environment while also affecting it in various ways [1, 2]. According to the World Tourism Organization's (UNWTO) report on climate change and tourism, published in 2008, tourism contributes approximately 5% to 14% of global warming and forecasts that carbon emissions from tourism will continue to rise in the coming decades. A study indicates [3] that global travel and tourism emissions increased by 3.5% annually from 2009 to 2019, outpacing the global economy by double, reaching a staggering 1 billion tons in 2019, which accounted for 8.8% of total global greenhouse gas emissions. The tourism industry has become one of the largest economic activities influencing climate change, drawing widespread attention from governments, social organizations, and scholars [4]. In this context, the United Nations World Tourism Organization (UNWTO) is collaborating with the United Nations Environment Programme to urge tourism stakeholders to take active steps through the Glasgow Climate Action Declaration, aiming to halve emissions by 2030 and ultimately achieve net-zero emissions [5].
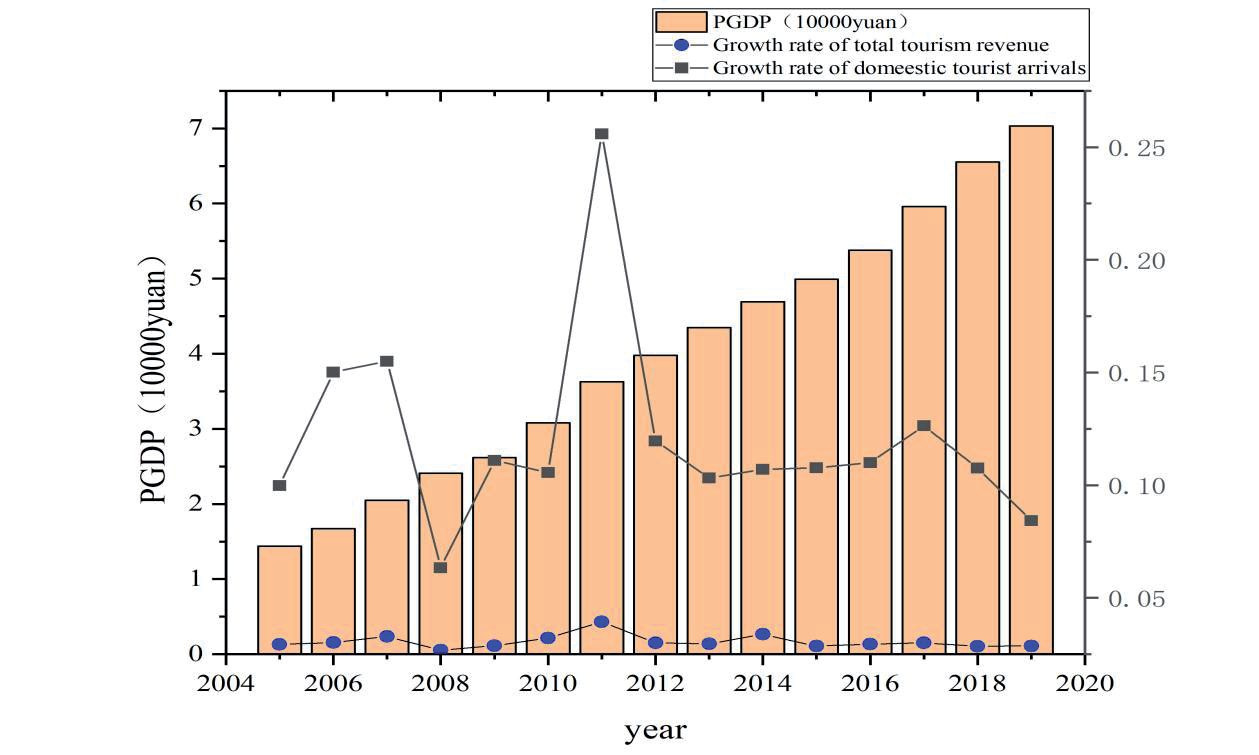
The experience of tourism development in developed economies indicates that when per capita GDP surpasses $1,000, there is a surge in people's demand for tourism. With the rise of China's economy, the country's tourism industry is undergoing rapid expansion. As illustrated in Fig. 1 (data compiled from the official website of the Chinese Ministry of Tourism), the average annual growth rate of China's total tourism revenue from 2005 to 2019 was 16.62%. Additionally, the average annual growth rate of domestic tourist arrivals in China's tourism industry from 2005 to 2019 was 12.11%. In 2019, domestic tourist arrivals reached 6.006 billion, marking an 8.4% increase; total tourism revenue for the year amounted to 6.63 trillion yuan, a year-on-year increase of 11%; and the comprehensive contribution of tourism to GDP was 10.94 trillion yuan, representing 11.05% of total GDP. It is evident that the development of tourism has significantly contributed to China's economic growth. Simultaneously, the issue of low-carbon development within China's tourism industry has garnered widespread attention. In 2020, China reaffirmed the significance of environmental concerns at the United Nations General Assembly, committing to peak carbon dioxide emissions by 2030 and to achieve carbon neutrality by 2060. Consequently, green development has emerged as a new strategy for China's economic growth. Thus, while advancing the development of China's tourism sector, managing tourism-related carbon emissions and realizing low-carbon tourism have become inescapable issues.
Accurately measuring the carbon emissions of the tourism industry based on analyzing its influencing factors is the basic work of formulating the green development of the tourism industry. However, the proportion of energy consumption generated by tourism to the energy consumption of related industries is difficult to measure, and foreign scholars usually combine it with tourism satellite accounts to measure the carbon footprint of tourism [6]. In China, due to the limitation of tourism statistics, the satellite account is not sound, which makes it difficult to accurately measure the carbon emissions of tourism. Existing studies mainly utilize the “bottom-up” measurement method, which is based on the consumption endpoints of tourism products or services, and accounts for carbon emissions by elements and sectors, and sums up to get the total amount of carbon emissions from the tourism industry. However, this method requires a large amount of field research data, which is conducive to the measurement of direct carbon emissions, but it is easy to underestimate the total carbon emissions of the tourism industry [7]. Therefore, on the basis of expanding the existing research, this paper, based on the comprehensive and interrelated nature of the tourism industry and based on the supply end of tourism products or services, utilizes the tourism consumption stripping coefficient to strip the total energy consumption of the tourism industry from the value of the existing statistical indexes, and adopts the “top-down” method to measure the total carbon emissions of the tourism industry. This method improves the integrity and comprehensiveness of the measurement scope of carbon emissions from the tourism industry and provides a new perspective for the comprehensive assessment of carbon emissions from the tourism industry.
Carbon footprint is used to measure the impact of human activities on natural ecosystems. [8] believes that the carbon footprint originates from the ecological footprint and should be represented by the land area (hectares) that absorbs greenhouse gases. According to the British Standards Institution's (BSI) PAS 2050 specification, the carbon footprint originates from the life cycle theory, and corresponds to the life cycle theory, which states that the carbon footprint should represent the total GHG emissions produced during the entire life cycle of a product (service) from development (start) to disposal (end). From the perspective of environmental carrying capacity, the European Committee for Science and Technology Action Plan (ECTAP) sees carbon footprint as a way to determine the impact of human life on the environment based on the amount of GHG emissions it produces. [9] explicitly state that the carbon footprint is a measure of carbon dioxide emissions. [10] emphasizes that the carbon footprint is the “carbon weight” produced by a person or activity. [11] emphasizes that the carbon footprint is the “carbon weight” produced by a person or an activity, and even suggests that the carbon footprint be referred to as “carbon weight”. In conclusion, there are two different international understandings of carbon footprint, one of which defines it as the carbon emissions generated by human activities [12]. The other considers the carbon footprint as part of the ecological footprint, i.e., the ecological carrying capacity required to absorb carbon dioxide emissions from burning fossil fuels [13]. It is worth noting that carbon emissions are generally defined from the perspective of production, which is a reflection of the producer's responsibility, while the carbon footprint is studied from the perspective of end-consumption, which places more emphasis on the consumer's responsibility; at the same time, the notion of “footprint” essentially encompasses all the “trajectories” of a substance or element along the supply chain, emphasizing more on “footprint”. At the same time, the concept of “footprint” essentially includes all the “trajectories” of a substance or element in the supply chain, and emphasizes the process analysis of the “whole life cycle”.
Measuring the carbon footprint of the tourism industry is one of the hot issues in the current research on the carbon footprint of the tourism industry. Currently, there are two main methods for measuring the carbon footprint of the tourism industry, namely the “top-down” method and the “bottom-up” method [14]. The “top-down” method takes the whole economic system as the boundary, and calculates the carbon footprint of tourism based on the carbon emission coefficients of various types of energy on the basis of the overall energy consumption of tourism [15]. Scholars usually combine it with the tourism satellite account to measure the carbon footprint of the tourism industry, and Chinese scholars usually use the tourism consumption stripping factor to measure the carbon footprint due to the limitation of the available statistics [16]. For example, [17] calculated the tourism emissions of Beijing, Shandong, Zhejiang, Hubei, and Hainan based on the concept of “tourism consumption stripping factor”. The “bottom-up” approach involves dividing tourism into several subsectors, calculating their energy consumption and carbon footprints, and summing them up to obtain the total carbon footprint of tourism [18]. From a methodological point of view, bottom-up process analysis is a “white-box” approach, with clear structures and mechanisms, and higher accuracy at the micro-scale; however, this approach requires the classification of subsectors, which is equivalent to artificially cutting off an objectively continuous supply chain [19], and this results in an artificial truncation of the supply chain, which can lead to errors.
In contrast, the “top-down” approach takes the entire tourism economic system as the boundary for estimation; therefore, it is sounder in terms of its completeness. [20] use both top-down and bottom-up methods to assess GHG emissions related to transport, accommodation, and other activities associated with tourism in Switzerland. The results show that the difference is significant between the top-down and bottom-up methods. The reason is that the top-down approach considers a more comprehensive range of factors than the bottom-up approach.
Calculating the carbon emitted by tourism is essential to achieving sustainable tourism development [21]. Investigating the drivers of carbon emissions is therefore of great practical significance. In this aspect, the original IPAT model considers technology, population, and economy as the major contributors to carbon emission [22]. However, the IPAT approach has a limitation because it can only assess the same proportionate change relationship between environmental changes and influencing factors. Dietz and Rosa (1994) [23] propose the stochastic environmental impact assessment model (STIRPAT model) to address these drawbacks, and it is now widely applied in analyzing the drivers of carbon footprints. For example, [24] used the STIRPAT method to investigate the impact of five factors on Chinese CO2 emissions during 1995-2013. The findings revealed positive correlations of economic growth, population, energy use efficiency, and industrialization with carbon emissions, and an inverted U-shaped curve for urbanization and emissions in China's metropolitan areas. Compared with others, the STIRPAT model has high flexibility and ease of operation to analyze environmental impact factors. Additionally, researchers can extend the STIRPAT model to adapt to environmental impact assessment systems in different situations [25, 26]. For this reason, the STIRPAT tool has been chosen in this paper to examine the factors influencing the carbon footprint of tourism.
In conclusion, the existing literature mainly focuses on the regional and provincial levels, while there are huge differences in the endowment of tourism resources between regions in China, and there is an obvious gradient in the development of the tourism industry in the east, central and west, which lacks dynamic analysis at the time level and horizontal comparison at the spatial level. In terms of measurement methodology, a “top-down” approach based on the consumer's perspective is used, which tends to underestimate the carbon emissions of the tourism industry and leads to insufficient policy attention.
Therefore, this article used the tourism industry stripping coefficient to measure the carbon footprint of China's tourism industry; analyzed the spatiotemporal evolution characteristics and heterogeneity of China's tourism carbon footprint; and, based on the scalability of the STIRPAT model, examined the driving factors of China's tourism industry carbon footprint. It is expected to provide a theoretical basis for formulating differentiated tourism green development policies.
This paper starts with the following four parts: Firstly, it adopts a top-down approach to measure the total carbon footprint of China's tourism industry from the perspective of consumption, and analyzes its spatial and temporal characteristics. Second, based on the scalability of the STIRPAT model, the key factors influencing the carbon footprint of the tourism industry are discussed, and by examining the direction of these influencing factors on the carbon footprint, insights are provided for the implementation of low-carbon development policies. Third, in view of China's vast territory and uneven distribution of tourism resources, regional and sectoral heterogeneity are further examined. Fourth, based on the results of the analysis, recommendations for the low-carbon development of the tourism industry are proposed.
The main contributions of this paper are as follows: First, the carbon footprint of China's provincial tourism industry is measured using Chinese provincial panel data with tourism stripping coefficients, which enriches the relevant literature in terms of measurement methods. Second, it analyzes the spatial and temporal evolution characteristics and driving factors of China's tourism carbon footprint, and examines regional and sectoral heterogeneity to provide a theoretical basis for formulating differentiated tourism green development policies. Third, it is based on important practical significance for the integrated protection and development of China's tourism resources.
Materials and Methods
Model Construction
To calculate the carbon footprint, researchers often define system boundary carbon accounts [27]. The carbon footprint of tourism includes all greenhouse gas emissions generated by related industries throughout the life cycle of tourism. Earlier researchers considered only the carbon emissions from tourists during the life cycle of tourism products. More recently, attention has shifted to include catering, accommodation, transportation, shopping, entertainment, souvenirs, and other related industries to compute the overall emissions from tourism [28]. However, based on China's national economic statistics, regional energy balance sheets, and the inclusion of tourism sectors in tourism satellite accounts, this study divides tourism into four sub-sectors: (a) transportation, (b) accommodations and catering, (c) wholesale and retail, and (d) social services. Since there are no separate statistics available for tourism energy consumption in China, the share of tourism emissions in the total emissions of tourism-related industries must be determined first. For this purpose, the tourism consumption stripping coefficient is utilized in this study.
Calculation of Stripping Factor
To accurately and objectively calculate the contribution of tourism to the national economy, we deduct the value of final products and intermediate goods consumed from total tourism receipts, while counting the value added by each subsector within the tourism sector. We refer to the percentage of tourist consumption within each sector's value added as the tourist consumption stripping factor for that sector. This study adopted the research method of "tourism consumption stripping factor" [29]. The proportion of tourism-related added value in the industry to the total industry added value which is represented by the following Equation.
Where θi denotes the tourism consumption stripping coefficient of the tourism-related industry i; TVAi denotes the tourism value added of the tourism-related industry i; VAi denotes the value-added of the industry i, TRi denotes the income of the tourism-related industry i, VARi denotes the value-added rate of the tourism-related industry i, and TPVi denotes the total income of the tourism-related industry i.
Carbon Footprint Measurement Model
The Kaya identity is one of the most commonly used methods for decomposing carbon emission factors. It categorizes the influencing factors of carbon emissions into four groups: population size, economic level, energy intensity, and energy structure. By organizing the Kaya formula, the general calculation formula for the tourism carbon footprint can be derived:
Where TCF is the total carbon footprint; Vi is the conversion factor of different energy sources into standard coal (IPCC, 2006); Ei represents the amount of different types of tourism energy consumption, and K denotes the carbon emission of a unit of standard coal, which is the CO2 emission coefficient of energy converted into standard coal.
As the carbon footprint of the tourism industry is not included in any of China's yearbooks, specific calculations are required to determine the energy use levels of the related industries involved in the tourism industry [30]. Therefore, in this research, a stripping factor is applied, and the aforementioned Equation is accordingly modified.
Where TEFj denotes the carbon footprint of a sector involved in tourism, θi denotes the tourism consumption stripping factor, and Ei denotes the CO2 emission factor per unit of standard coal. In this study, K is assumed to be a constant and takes the value of 2.45 [31].
STIRPAT Model Construction
(i) STIRPAT Model
Dietz and Rosa (1994) [23] proposed the STIRPAT model with the following basic expressions:
Where I represents the degree of environmental influence, P denotes the demographic influence factor, A signifies the economic influence factor, and T indicates the technological influence factor. Similarly, a is the model coefficient, b c d denote the indices of population, economy, and technology, respectively, and u represents the random error term of the model.
The STIRPAT model reflects the impacts of population, economics, and technology on the environment. It allows for the study of the impacts of multiple factors on the environment by extending demographic, economic, technological, and other factors or by adding other variables. Additionally, the STIRPAT model addresses the shortcomings of the Kaya equation and the IPAT model by introducing indicators that alter the extent of the various factors in research.
(ii) STIRPAT Model Extension
In this paper, economic development level (PGDP), the quality of population (EDU), and tourism energy consumption structure (TEP) are chosen to set up the base regression Equation:
To determine relevant parameters and reduce heteroscedasticity and bias, logarithms of both sides of the formula (8) are taken in this paper to obtain the following:
Where a1 a2 a3 represent the elasticity coefficients of economic development level, population quality, and tourism energy consumption structure, respectively, indicating the influence of the three factors on the tourist carbon footprint. Xit represents the control variables, uit represents the random disturbance term, i and t respectively represent 30 provinces and cities selected by this study, covering the time period of 2005 to 2017.
Based on STIRPAT’s basic regression model, this paper conducted an extended analysis of tourism from the perspectives of economy, population, and technology to investigate the factors that influence tourism's carbon footprint. Therefore, the Equation established in this study is as follows:
According to the Environmental Kuznets Hypothesis, the relationship between per capita income and environmental quality is not linear and monotonous but rather follows an inverted U-shaped curve [32]. To investigate whether an inverted U-shaped Environmental Kuznets curve exists between economic growth and the tourism carbon footprint, economic growth in Equation (11) is decomposed into primary and secondary terms, and the following model is established:
(11)
To overcome the endogeneity problem in the model, this paper uses the Generalized Matrix Model (GMM) to analyze the influencing factors of the carbon footprint of the tourism industry. The system GMM not only includes the lagged term of the independent variable, but also the level difference term of the independent variable. It can effectively alleviate endogeneity issues and the correlation between different dependent variables and error terms [33]. The regression model is:
In this model, it is assumed that Yi-1 is not correlated with εi, Xi is not correlated with εi, and E(εi) = 0 holds. In the equation, α is the fixed effect of the dependent variable Yi Yi-1 is the lagged variable, and Xi is the vector matrix composed of all variables. μi is the time effect and εi is the random error variable.
Selection of Indicators
(1) Regional economic development level (PGDP). As the regional economy progresses, the energy and resources allocated to tourism increase, thereby contributing to higher carbon emissions. Conversely, a more advanced economic level enhances infrastructure and technological conditions, leading to a reduction in pollution emissions. Consequently, this article employs per capita GDP (PGDP) as an indicator of economic performance.
(2) Industry Structure (SEC). Tourism is part of the service sector, intertwined with various industries within services. Consequently, the development level of the service sector influences the development of the tourism industry, which can, in turn, impact the tourism industry's carbon footprint [34]. This paper utilizes the share of the tertiary sector's value addition to GDP as an indicator for the service sector's development level.
(3) Tourism Hospitality Scale (TPS). The scale of tourism hospitality is essential in determining the tourism carbon footprint [35]. This paper selects the tourism-to-population ratio of each region as the index to measure the extent of tourism acceptance.
(4) Population Quality (EDU). The quality of a population, in terms of environmental sensitivity, influences citizens' awareness of environmental protection and energy conservation. Typically, individuals with higher educational attainment exhibit greater environmental consciousness during travel, which can lead to a reduction in the tourism carbon footprint. This paper utilizes the ratio of individuals with tertiary education or above to the total population aged 6 and over as an indicator of population quality in each region.
(5) Demographic Structure (AGE). From a demographic perspective, tourism is significantly influenced by the aging of society [36]. The travel preferences of older individuals and younger people vary considerably. Specifically, age differences can affect the tourism carbon footprint. This paper employs the proportion of the population aged 65 and over in the total population of each region as a measure of demographic structure.
(6) Tourism energy consumption structure (TEP). As an essential indicator of energy efficiency and an important influencing factor of carbon emissions [37], the energy consumption structure is crucial. In this paper, the share of coal ("raw coal") in the total energy consumed by tourism is selected to illustrate the energy consumption structure.
(7) Regional science and technology level (PAN). The development of technology impacts emissions in two ways. Technological advancement implies increased usage, consumption, and thus, higher emissions. Conversely, technological progress can also lead to reduced energy consumption, better energy efficiency, and lower emissions. In this paper, the volume of patent technology applications and authorizations is used as an indicator of influence on carbon emissions.
(8) The primary focus of this study is to investigate the effects of economic, demographic, and technological variables on the tourism carbon footprint. Nevertheless, numerous factors influence the tourism carbon footprint. Drawing on existing research [38, 39], the following control variables have been chosen: urbanization level (URB), transportation infrastructure (TRA), international openness (OPE), and afforestation area (WOD) are included as control variables in the regression equation to enhance regression accuracy. Table 1 details all the variables utilized and their definitions.
Data Sources
This paper primarily utilizes statistics from the China Energy Statistical Yearbook (2006-2018), the China Tourism Statistical Yearbook (2006-2018), the Provincial (city and district) Statistical Yearbooks, and the Tourism Statistical Yearbook (2006-2018) for the analysis of the tourism industry. Due to data unavailability, the study excludes Hong Kong, Taiwan, Macao, and Xizang. The data gathered encompasses energy consumption within tourism-related industries such as transportation, wholesale, retail, catering, and accommodation, as well as tourism revenue, the value added of industries associated with tourism, the number of domestic and international tourists received, and other pertinent factors. The National Economic and Social Development Statistical Bulletin of China (2006-2018), along with the corresponding regional reports, filled in some of the missing data. Additional data sources include the Tourism Statistical Bulletin from each region, the Domestic Tourism Sample Survey Information, and the Inbound Tourism Sample Survey Information (2006-2018). Furthermore, this research divides mainland China (excluding Hong Kong, Macao, Taiwan, and Tibet) into three major regions: East, Central, and West. The Eastern region comprises Beijing, Tianjin, Hebei, Shandong, Liaoning, Jiangsu, Shanghai, Zhejiang, Fujian, Guangdong, and Hainan; the Central region includes Heilongjiang, Jilin, Shanxi, Henan, Anhui, Jiangxi, Hubei, and Hunan; the Western region encompasses Inner Mongolia, Xinjiang, Gansu, Ningxia, Qinghai, Shaanxi, Chongqing, Sichuan, Yunnan, Guizhou, and Guangxi.
Table 1.
Description of variables.
Regarding economics and other influencing factors, this paper primarily gathered data from the China Statistical Yearbook (2006-2018) and various regional statistical yearbooks (2006-2018), including per capita GDP, the tertiary industry's share of GDP, population quality, population structure, urbanization rate, patent application licenses, the combined density of roads and railroads, and the degree of outward openness. Additionally, the study compiled the energy consumption structure from the China Energy Statistical Yearbook (2006-2018) and the afforestation area from the China Forestry Statistical Yearbook. Table 2 presents the number of samples and the statistics of variables. To ensure a uniform statistical standard, this paper has aligned and integrated the industrial sectors in the National Tourism Satellite Account with the tertiary industry sectors in the regional energy balance sheet of the China Energy Statistical Yearbook, following the National Economic Industry Classification Standard (GBT4754-2011).
Table 2.
Descriptive statistics of variables.
Data Limitation
Due to data constraints and considering the impact of epidemic control policies from the end of 2019, this study selected provincial panel data from 2005 to 2017. The study acknowledges certain limitations due to data restrictions. Had urban data been used, the findings would have been more practically significant. This article offers a reference framework for subsequent related research and presents provincial-level research conclusions to facilitate comparative analysis in future studies. Consequently, the author hopes that future research will enhance urban statistical indicators, conduct in-depth analysis at the city level, and provide greater guidance for establishing tourism emission reduction goals and policies.
Results and Discussion
Spatial-Temporal Evolution of Carbon Footprint
Utilizing Equation (1-6), along with pertinent statistics and data, the tourism carbon footprint of China's provinces (cities and regions) from 2005 to 2017 has been assessed and is presented in Table 3.
On a national scale, a consistent upward trend was noted in the carbon footprint of China's tourism industry from a holistic viewpoint between 2005 and 2017, with the exception of a minor decrease in 2013. Throughout the study period, the carbon footprint of China's tourism sector increased by approximately threefold, expanding at an average annual rate of 12.25%, as indicated in Table 3.
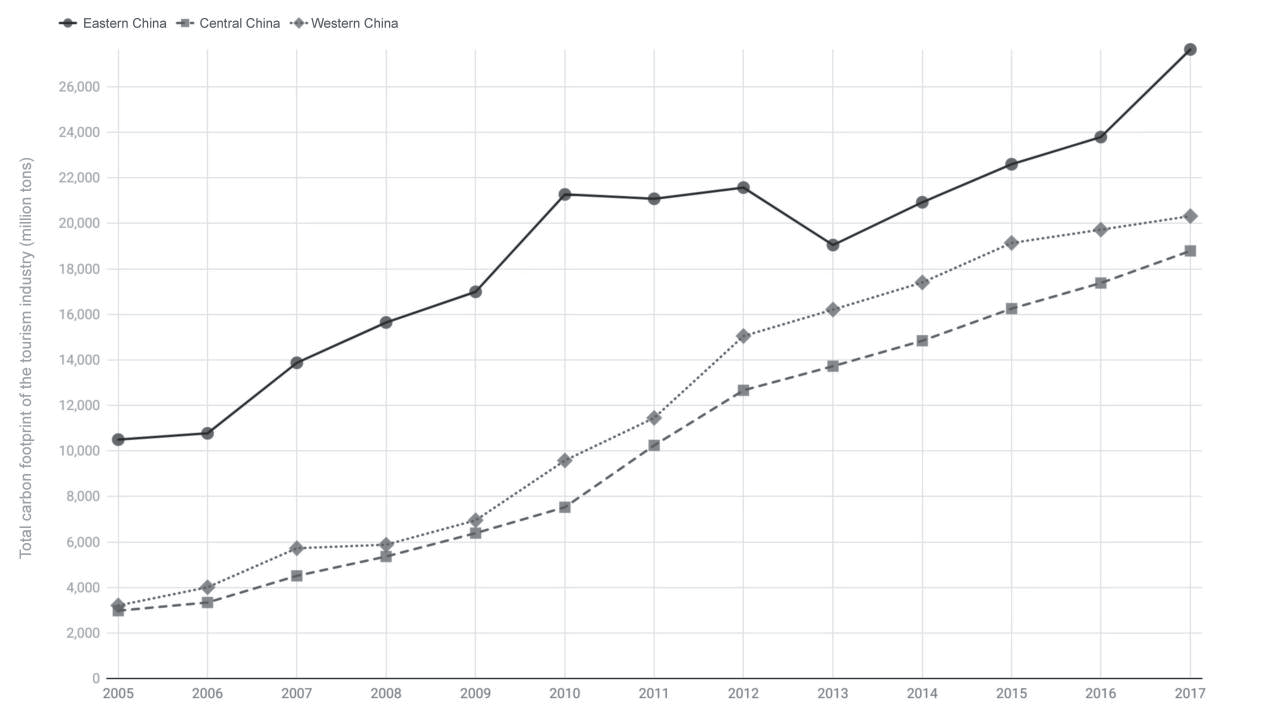
At the regional level, the tourism carbon footprint is more pronounced in the East than in the Middle and West regions throughout the survey period. However, over time, the gap between the East, Centre, and West has shown a decreasing trend. During the data observation period, the tourism carbon footprints in the East, Centre, and West increased by 1.63, 5.13, and 5.33 times, respectively. The results indicate that the growth rate of the tourism carbon footprint in the Central and Western regions is much greater than that in the Eastern region, as illustrated in Fig. 2. Therefore, fostering the sustainable and healthy growth of tourism in China, particularly in the Central and Western regions, has become an urgent issue that needs to be addressed.
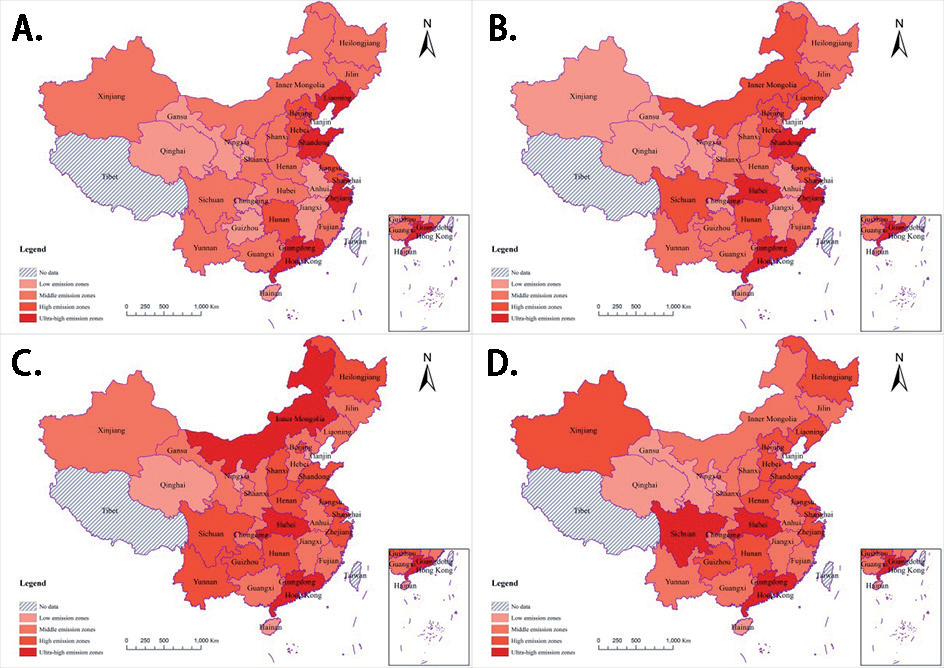
From a spatial perspective, as depicted in Fig. 3, ArcGIS 10.2 software is utilized to create a carbon footprint effect map of China's tourism industry across provinces (city and region). This study selects the years 2005, 2009, 2013, and 2017 as representative. In Fig. 3, each province's tourism carbon footprint is categorized into low, medium, high, and ultra-high values, corresponding to 0.5, 1, and 1.5 times the average annual tourist emissions. According to Fig. 3, the high and ultra-high value carbon footprint areas of China's tourism industry exhibit a gradual spatial shift from East to West over time. This trend aligns with the gradient change trend of China's economic growth level. Specifically, as regional economic development progresses, the tourism industry flourishes, leading to an increase in the tourism carbon footprint. In 2005, the high and ultra-high value areas of the carbon footprint were predominantly situated in the relatively economically developed provinces (cities and regions), such as Liaoning, Shandong, Beijing, Shanghai, Zhejiang, Guangdong, and Jiangsu along the Eastern coast. By 2009, the high-value and ultra-high-value areas had gradually shifted to the central part of the country, particularly to provinces such as Hubei, Sichuan, and Inner Mongolia, as well as Hunan. By 2009, the high-value and ultra-high-value regions had extended further westward, encompassing provinces like Qinghai, Yunnan, and Guizhou. By the end of the study period in 2017, these regions were predominantly located in tourism-rich areas, including Xinjiang, Sichuan, Hubei, Shanghai, Zhejiang, Guangdong, and Guizhou. Notably, the carbon footprint of tourism grew significantly faster in the central and western regions compared to the eastern regions.
Factors Influencing the Carbon Footprint in Tourism
Utilizing the extended STIRPAT model, this study develops an analytical framework to examine the drivers of tourism's carbon footprint, assessing the impact and operational mechanisms of various factors on the carbon emissions associated with tourism.
Evidence from STIRPAT Sample Analysis
The F-test and the Hausman test both reject the initial hypothesis at the 1% significance level, leading to the selection of the fixed effects model. Table 4 illustrates the impact of economic factors on China's total tourism carbon footprint under fixed effects. Model 1 includes only the explanatory variables, which are utilized to test the robustness of Model 1. The study progressively adds control variables from Model 2 through to Model 5:
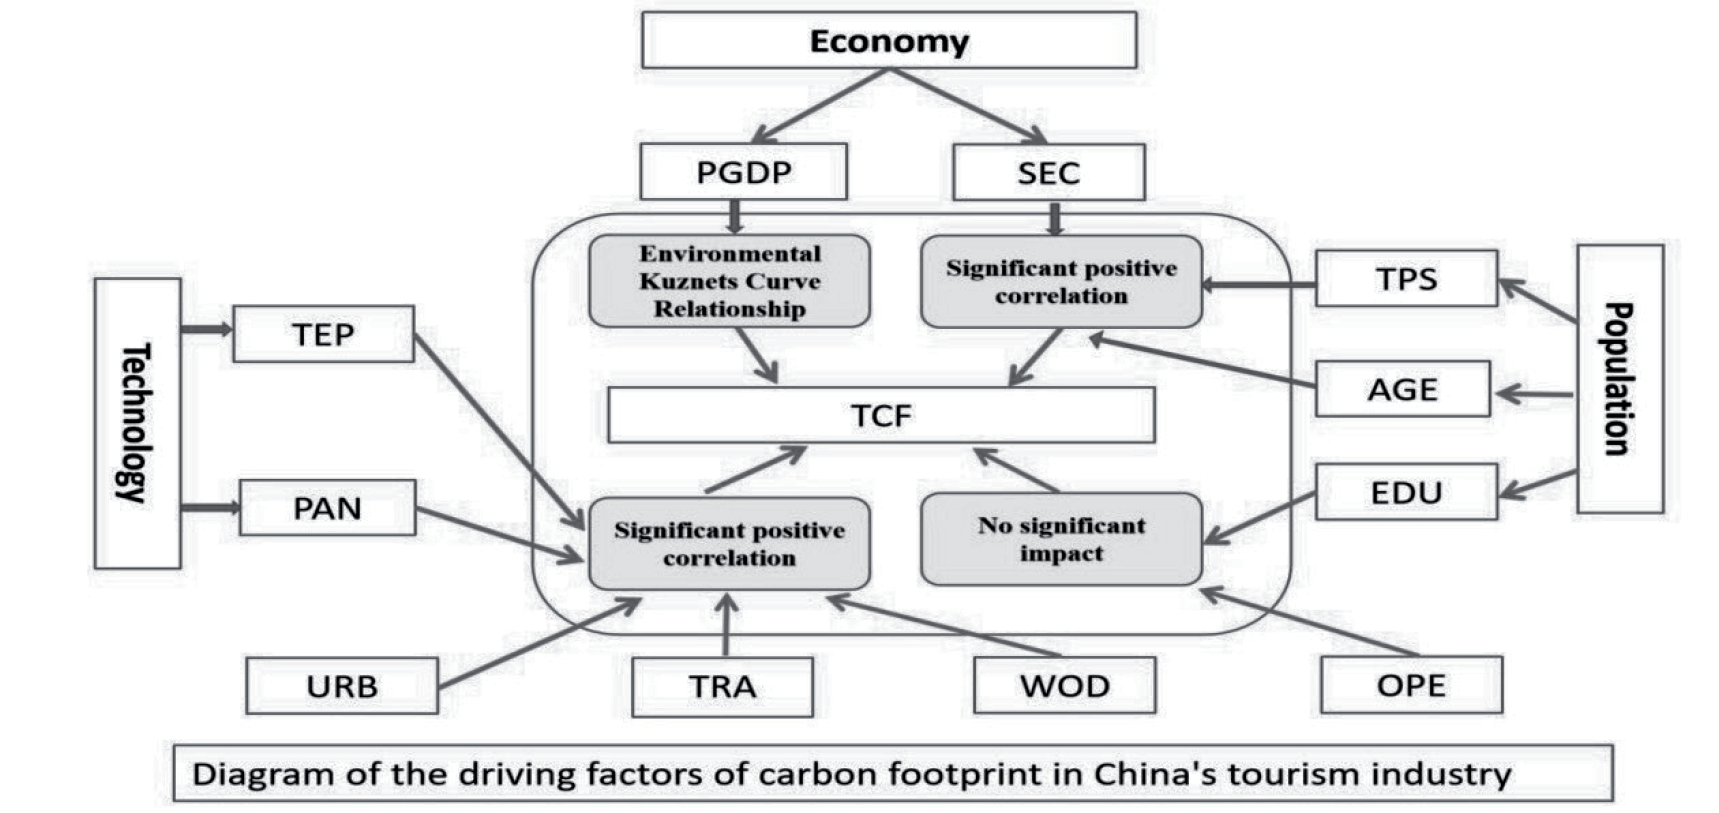
(1) The regression evidence from Model 6 shows that the effect of GDP per capita is positive, while its quadratic coefficient is significantly negative at the 1% level. It shows that the relationship between economic growth and tourism carbon footprint follows an inverted U-shaped environmental Kuznets curve. This may be due to several reasons: (a) With economic development, the Chinese government has increasingly emphasized on environmental protection. Among other things, the government has increased investment in environmental protection and increased penalties for environmental protection violations. (b) Economic development promotes technological progress, which in turn improves the efficiency of resource utilization. (c) The scale effect of tourism in developed regions can significantly reduce the carbon footprint per tourist.
Table 3.
Carbon Footprint of China’s Tourism Industry (2005-2017).
(2) From Model 1 to Model 5, technology-related indicators (energy consumption structure, regional technology level) are significantly positively correlated at the 1% level. This indicates that the structure of energy consumption and regional technology levels are key factors affecting tourism's carbon footprint. In addition, the regional technology level is significantly and positively correlated with carbon emissions from tourism. This implies that technological advancement, accompanied by high energy-consuming investments, does not contribute to the greening of the tourism industry.
(3) From Model 1 to Model 5, the number of tourists and age structure are significantly and positively correlated with tourism emissions. On the contrary, the level of education is negatively, but not significantly, related to the carbon footprint of tourism. The findings are consistent with those of previous studies on the impact of education on tourism emissions, suggesting that education, including low-carbon environmental education, does not contribute significantly to the direct reduction of tourism-related carbon emissions [40].
Table 4.
Overall regression results.
(4) From Model 1 to Model 5, indicators related to the economy, such as GDP per capita and industrial structure, are significantly and positively correlated with the carbon emissions of tourism. The results indicate that as the economy develops, the increasing share of the service sector positively impacts tourism emissions. As a component of the service sector, tourism is highly interconnected with other industries within that sector.
Regional Heterogeneity in Carbon Emissions
This paper investigates the fundamental factors that drive tourism emissions in different regions, concentrating on two key aspects: carbon footprint and tourism income. Utilizing the median values of these two aspects, we have classified China's 30 provinces and municipalities (excluding Tibet, Hong Kong, Taiwan, and Macao due to incomplete data) into four distinct groups:
High-income and High emissions (HH): Anhui, Fujian, Guangdong, Guizhou, Henan, Hubei, Liaoning, Shanghai.
High-Income Low Emission (HL): Beijing, Hunan, Jiangsu, Shandong, Sichuan, Yunnan, Zhejiang.
Low-income High emission (LH): Gansu, Guangxi, Hebei, Inner Mongolia, Ningxia, Qinghai, Shaanxi.
Low-Income Low Emission (LL): Hainan, Heilongjiang, Jilin, Jiangxi, Shanxi, Tianjin, Xinjiang, Chongqing.
Regressions at the regional level show that there is significant heterogeneity in the impact of industrial structure, tourist arrivals, economic growth rate, population composition, energy structure, and patented technologies on different regions (see Table 5).
The industrial structure has a positive impact on the carbon footprint of tourism in HH and LL regions, but shows a negative impact on the carbon footprint of the HL region. It is worth noting that the HL region includes provinces (cities and districts) with developed economies and relatively rich tourism resources, such as Beijing, Hunan, Jiangsu, Shandong, Sichuan, Yunnan, and Zhejiang. The development of the service industry in these regions promotes the effective use of tourism resources and presents a pattern of green development.
Patented technologies have a significant positive impact on tourism emissions in high-income (HH) and high-income low-emission (HL) regions, but a significant negative impact on tourism emissions in low-emission (LL) regions. It shows that technological advances in high-income regions do not always result in environmental benefits for tourism.
Economic growth has a significant effect on tourism carbon emissions in high-income low-emission (HL) and low-emission (LL) regions, but not in high-income (HH) and low-income high-emission (LH) regions. The results of the study suggest that low-emission regions face challenges as the economy grows, and there is a need to strengthen the management of carbon emissions from the tourism sector in the region.
Demographics have a significant and positive impact on tourism emissions, but this is especially true in high-income (HH) regions. This is due to the fact that the demand for tourism [41] increases as the proportion of aging population increases. However, as previously analyzed, a low-carbon model for the development of the service sector in the HH region has not yet been established, which leads to an increase in the environmental footprint.
In terms of energy structure, high-income low-emission (HL) and low-emission (LL) regions have a significant impact on tourism carbon emissions, while high-income (HH) and low-income high-emission (LH) regions have no significant impact on tourism carbon emissions. Therefore, the energy structure of low-emission regions is the key influencing factor.
Sectoral Heterogeneity Analysis
The tourism industry comprises four sectors:
(1) transportation, (2) wholesale and retail, (3) accommodations and catering, and (4) social services. Each sector is affected by these variables to varying degrees, leading to different outcomes. Consequently, more precise policy recommendations can be formulated by conducting regression analysis on the distinct sectors. Based on the results of the Hausman test, a fixed-effects model has been applied to all four sectors.
According to the results in Table 6: Except for the level of education and energy structure, the impact of other factors on the emissions of the tourism sector shows significant heterogeneity. Economic growth has a positive and significant impact on the carbon footprint of the transportation and social services sector, while negatively affecting the carbon footprint of the wholesale and retail trade sector. This negative impact may be due to the increase in online shopping, which has a considerable substitution effect on tourist shopping [42]. Moreover, in terms of impact coefficients, economic development has the greatest impact on transportation emissions. Therefore, the transportation sector should be the focus of energy saving and emission reduction in tourism. Demographics positively affect the carbon footprint of the transportation sector and negatively affect the carbon footprint of the wholesale and retail sector. This result may be related to population aging, which increases tourism demand and decreases consumption demand. Given the ageing trend in China, green travel and tourism should be actively promoted among the older population.
Table 5.
Regional panel data regression results.
Robustness and Endogeneity Tests
To further scrutinize the precision of the evaluation method and the explanatory power of the indicators discussed in this article, robustness tests were conducted by substituting the dependent variable and incorporating control variables. In addition, endogeneity tests were conducted through system GMM estimation (see Table 7).
In this study, a bottom-up approach is employed to ascertain the carbon footprint of the tourism industry. This method serves to test the robustness of the model by substituting explanatory variables initially determined through a "top-down" approach. Model 1 includes all explanatory variables, while Model 2 incorporates both explanatory and control variables. Furthermore, the conditions of tourism locations influence the carbon footprint of tourism. Since the locational conditions of each province are challenging to quantify, this research assesses the locational conditions of tourism in each province by adopting the concept of locational entropy, which is the ratio of the province's tourism revenue to GDP over the national tourism revenue to GDP. The robustness of the model is further tested by incorporating tourism location conditions into Model 3. The results of the system GMM estimation using formula 3-12 are presented in Model 4. The p-value of AR (1) is 0.03, and the p-value of AR (2) is 1.0, indicating that there is no second-order autocorrelation in the residuals, which meets the requirements of the system GMM. The P-value of the Sargan test is 0.713, indicating that the instrumental variable is effective. The findings indicate that the estimation of each parameter aligns with the previous outcomes of the full sample estimation. Additionally, while the coefficients for the variables vary in magnitude, their direction remains largely unchanged. In summary, the empirical results mentioned are robust.
Table 6.
Sectoral panel data regression results.
Conclusions
This research measures the total carbon footprint of the tourism industry in China from 2005 to 2017 and analyses the influencing factors based on the top-down approach with the tourism stripping factor. The main findings and conclusions are summarized below: Firstly, from 2005 to 2017, China's tourism carbon footprint increased by approximately threefold, with an expected annual average growth rate of 12.25%. In comparison with existing research [3], the carbon footprint of China's tourism industry accounted for approximately 13.8% of the global tourism industry's carbon footprint in 2017, and its growth rate was about 3.4 times that of the world's. On one hand, this reflects the vigorous development of China's tourism industry, and on the other hand, it also highlights the pressure faced by the green and low-carbon development of China's tourism industry. Moreover, there are significant spatial differences among the Eastern, Central, and Western regions: the Western regions exhibit a trend of faster growth compared to the Eastern regions. Additionally, the total carbon footprint of its tourism industry is greater in the East than that of the Central and Western regions, and the total carbon footprint of each sector is greater than that of its counterparts in the Central and Western regions during the same period. Secondly, there exists an inverted U-shaped correlation between economic growth and the carbon footprint of tourism. This is supported by the observation that the economically developed provinces in Eastern China fall within the high-level (HL) regions. Consequently, it can be concluded that the expansion of economic and tourism-related activities is generally not linked to high emissions, and that the efficiency gains resulting from economic growth play a mitigating role in reducing emissions from the tourism industry. Additionally, the development level of the service industry, energy consumption structure, regional technological level, and age structure have significant positive impacts on tourism emissions in China. These key findings indicate that optimizing the energy consumption structure, encouraging green technology innovation, and promoting the green development of the service industry contribute positively to the sustainability of the tourism industry. Finally, there is clear regional and sectoral heterogeneity in the carbon footprint of China's tourism industry. The primary drivers of carbon emissions in the Eastern developed regions are the energy consumption structure and regional technological levels, whereas in the Western developing regions, it is the industrial structure. Regarding sectoral heterogeneity, the carbon footprint of transportation is significantly affected by the number of tourists and demographic structure, while the carbon footprints of accommodations, catering, wholesale, and retail sectors are primarily influenced by the energy consumption structure.
Table 7.
Robustness tests for replacement variables.
Building upon the preceding discussion and conclusions, the study offers pertinent practical recommendations for sustainable tourism development: Firstly, it is essential to advance sustainable tourism development in accordance with local conditions. With the tourism industry's carbon footprint in China expanding, there is an urgent need to accelerate the transformation of the industry's development model. The levels of tourism development and resource conditions differ across various regions in China's tourism industry. Consequently, authorities at all levels must formulate policies that are suitable for their respective areas, taking into account the internal characteristics of the tourism sector, to foster tourism development while also considering environmental protection. Second, we must accelerate high-quality economic development in the Central and Western regions, promote the intensive and efficient use of resources, and encourage the emergence of an inverted U-shaped trend in tourism carbon emissions. This involves encouraging technological innovations that enhance green performance, promoting energy-efficient techniques, improving the efficient use of primary energy, and expanding the use of clean energy. Third, the economically developed eastern regions should enhance their energy consumption patterns and support the construction of green technology. Meanwhile, the western regions should accelerate the improvement of their industrial structure and promote green development within the service sector. Additionally, as the service industry develops, greater emphasis should be placed on environmental protection, and consumers should be encouraged to purchase green products.

