

Introduction
In recent years, China’s agricultural economy has rapidly advanced, continuously accelerating its transition from an agricultural giant to an agricultural powerhouse [1]. In 2021, the agricultural sector and its related output reached 1.84×10¹³ yuan, contributing 16.05% to the GDP. The deepening implementation of China’s rural revitalization strategy, coupled with the comprehensive advancement of the construction of an agricultural powerhouse, has yielded significant strides in low-carbon development within agriculture and rural areas. Central to this strategy is the promotion of green, low-carbon, and circular development, which fosters the transition of the agricultural industry towards high-quality development [2-4]. Through the promotion of low-carbon technologies and policy incentives, there has been a notable reduction in agricultural carbon emissions. Presently, global climate change stands as a formidable challenge confronting nations worldwide, engendering a consensus within the international community to curtail greenhouse gas emissions and mitigate climate change effects [5, 6]. As one of the world’s largest greenhouse gas emitters, China shoulders significant responsibilities in combating climate change. Consequently, global emission reduction targets exert a profound influence on China’s agricultural carbon emissions, impelling the nation to adopt more proactive measures in this regard. Agricultural carbon emissions, as a significant source of greenhouse gases, have become a focal point for exploration, necessitating a pathway tailored to China’s national conditions and realities to achieve low carbon emissions in agriculture [7, 8]. Agricultural carbon emissions refer to the greenhouse gases emitted during agricultural production, including carbon dioxide, methane, and nitrous oxide, accounting for 20% of the global greenhouse gas emissions [9]. In recent years, China has actively implemented measures to combat climate change, notably achieving remarkable results in advancing the “dual carbon” voluntary contributions while promoting the green transformation of the social economy [10, 11]. Nevertheless, as agricultural production expands, it inevitably leads to increased agricultural energy intensity, enhanced public investment in agriculture, and structural changes in the agricultural industry, posing significant challenges to agricultural carbon emissions [12]. On May 7, 2022, the Ministry of Agriculture and Rural Affairs, in conjunction with the National Development and Reform Commission, promulgated the “Implementation Plan for Agricultural and Rural Carbon Emission Reduction and Sequestration.” This initiative endeavors to advance carbon emission mitigation and sequestration within agricultural and rural domains through a comprehensive array of measures. Specifically, it delineates targets aimed at attaining the pinnacle of carbon emissions by 2030 and effecting carbon neutrality by 2060. By emphasizing the pivotal role of agricultural and rural carbon emission abatement and sequestration, the plan underscores their significance as fundamental avenues for combating climate change and fostering the establishment of an ecological civilization.
Foreign scholars have pioneered the conceptualization and calculation of agricultural carbon emissions. Early initiatives, such as those by West et al., constructed indicators for measuring agricultural carbon emissions based on inputs of agricultural materials and irrigation cultivation [13]. With China’s active participation in global climate governance, domestic scholars have made significant progress in the study of agricultural carbon emissions in recent years, revealing an increasing trend and significant regional disparities in China’s agricultural carbon emissions [14]. Our study focuses on the 31 provinces, municipalities, and autonomous regions in China, highlighting the current status of green agriculture development against the backdrop of the “dual carbon” initiative. It constructs an indicator system for agricultural carbon emissions from five dimensions: agricultural materials, agricultural irrigation, agricultural planting, livestock farming, and agricultural energy consumption. Furthermore, it analyzes the performance evaluation system of agricultural carbon emissions from three dimensions: input, expected output, and non-expected output. Key data elements, such as agricultural carbon emissions, population density index, decoupling elasticity, agricultural carbon emission performance, and decomposition efficiency, are accounted for. The paper explores the total volume, decoupling effects, and performance characteristics of China’s overall and regional agricultural carbon emissions from 2007 to 2020, aiming to evaluate their evolution trends, their relationship with benchmarking and economic growth, and the sources of decomposition efficiency of agricultural carbon emissions. It strives to contribute to the promotion of coordinated regional development of China’s agricultural economy, the achievement of green, energy-saving, and emission-reduction goals, and the advancement of high-quality agricultural development.
Experimental Procedures
Methods
Measurement Methods for Agricultural Carbon Emissions
This study focuses on the direct carbon emissions generated during the process of agricultural production and consumption. We establish an index system and, considering the availability of data, calculate the total inter-provincial agricultural carbon emissions in China from 2007 to 2020 in order to maintain the relative completeness of the sample data (Table 1).
The specific categories include:
1. Carbon emissions from agricultural materials: These emissions arise from the production and use of fertilizers, pesticides, agricultural films, and machinery.
2. Carbon source from water resource utilization in agricultural irrigation: This constitutes a significant carbon source.
3. Emissions of substances such as nitrous oxide resulting from rice planting and replanting within the agricultural planting category.
4. Examination of methane emissions from the three main livestock (pigs, sheep, and cattle) in livestock farming: We adjust the number of livestock based on the end-of-year inventory and slaughter numbers of pigs, sheep, and cattle. For livestock with a slaughter rate (slaughter number/end-of-year inventory) greater than 1, the feeding amount is estimated by dividing the slaughter number by 365 and then multiplying it by their production cycle. For livestock with a slaughter rate lower than 1, the end-of-year inventory is used to represent the population.
5. Agricultural energy consumption: This primarily includes coal, gasoline, diesel, and electricity. Other types of energy have minimal impact on carbon emissions and are therefore not included in the calculation of total carbon emissions in this study.
The specific calculation Equations are as follows:
where C is the total agricultural carbon emissions, ci is each type of specific carbon source, θi is the carbon emission coefficient, and n is the number of carbon sources.
Methodology for Measuring the Decoupling Effect of Agricultural Carbon Emissions
The theory of decoupling, proposed by the Organization for Economic Co-operation and Development (OECD) in 2002, has been extensively employed in the examination of the relationship between economic growth and the environment [16]. In the current realm of related research, decoupling assessment indicators primarily fall into two categories.
(1) OECD decoupling factor model. Decoupling occurs when the rate of economic growth diverges from the rate of environmental degradation or when their relationship is disrupted. The Organization for Economic Co-operation and Development (OECD) distinguishes between absolute decoupling and relative decoupling. Relative decoupling refers to a situation where the growth rate of energy consumption is positive but lower than the rate of economic growth. Absolute decoupling, on the other hand, occurs when the growth rate of energy consumption is zero or negative while economic growth persists, indicating a transition towards a more efficient economic growth model. The Equation for calculating decoupling is as follows:
Where R is the decoupling index, EP is the value of the environmental load indicator, DF is the economic driving force indicator, S represents the end year, and T represents the beginning year.
Table 1.
Agricultural carbon emission index system.
Using the OECD decoupling model, the following decoupling model is constructed using data from the reporting period and the base period:
Where Dn indicates the decoupling index in the nth year, Cn indicates the agricultural carbon emission index in the nth year, and AGRIn indicates the growth index of agricultural gross output value in the nth year. The significance of the decoupling index can be understood as follows: when D≥1, it means that the growth rate of agricultural carbon emission is synchronized with the growth rate of agricultural economy, or faster than the economic growth rate, at this time, it is said that it is not decoupled, or become absolutely linked; when 0<D<1, it means that the growth rate of agricultural carbon emission is slower than the growth rate of agricultural economy, and at this time, it is said to be relatively decoupled; when D = 0, it means that the growth rate of agricultural carbon emission is unchanged, but it can still maintain the growth rate of agricultural economy, that is, in the case of sustained agricultural economic growth, agricultural carbon emissions do not increase. In order to eliminate the influence of different units and orders of magnitude of agricultural gross output value and agricultural carbon emission, this paper adopts the dimensionless quantification of agricultural gross output value and agricultural carbon emission data to better analyze the decoupling relationship between China’s agricultural carbon emission and agricultural economic growth. Taking 2007 as the base period, the calculation Equation is as follows:
(2) Tapio decoupling model. In response to the ongoing evolution of the OECD decoupling model and the challenges it faces regarding base period selection, the Tapio decoupling model has emerged as the primary approach in current research on economic decoupling relationships. The Tapio model, alternatively referred to as the Tapio decoupling model or the Tapio decoupling index, serves as a pivotal analytical instrument designed to examine the intricate interplay between economic advancement and the concomitant pressures on resources and the environment. Originally formulated by Finnish economist Tapio in 2005, this model primarily facilitates investigations into the decoupling dynamics between economic expansion and environmental stressors, such as pollution, energy consumption, or material utilization. Its principal objective lies in determining whether a discernible dissociation, or decoupling, exists in the growth trajectories of these two domains. By introducing the concept of “elasticity,” this model facilitates the dynamic manifestation of decoupling relationships between variables. The term “decoupling elasticity” reflects the ratio of the impact of economic development changes on changes in carbon dioxide emissions, illustrating the sensitivity of carbon dioxide emission changes to changes in economic development conditions in our study. The Equation for calculation is as follows:
Where β is the decoupling index, EP is the environmental load indicator value, and DF is the economic driver indicator. According to the differences in the measured elasticity values, they can be subdivided into weak decoupling, strong decoupling, weak negative decoupling, strong negative decoupling, expansion negative decoupling, expansion connection, recession decoupling, and recession connection (Table 2).
Compared with the OECD decoupling model, the Tapio model is more reasonable for the combination of environmental loads and economic drivers, and can reflect the changes in the sensitivity of carbon emissions to economic growth [17], the following decoupling model is constructed:
Table 2.
8 levels of elasticity in Tapio.
Where e is the decoupling elasticity, C is agricultural carbon emissions, and AGRI is the gross agricultural product.
Measurement Methods for Assessing Carbon Emission Performance in Agriculture
Agricultural carbon emission efficiency is a crucial indicator for measuring agricultural production efficiency and coordination. In this study, agricultural carbon emissions are considered as undesired outputs, and the global DEA (Data Envelopment Analysis) method is employed to evaluate the total factor productivity index. When constructing the evaluation system for agricultural carbon emission efficiency, both input and output processes of agricultural production and consumption are considered (Table 3).
(1) Input Indicators: These primarily include labor, capital, and land factors. The number of employees in the primary industry, the amount of fixed asset investment in the primary industry, and the total sown area of crops are used to measure these factors. Additionally, other elements, such as pesticide usage, plastic film usage, and the total power of agricultural machinery, are incorporated.
(2) Expected Output Indicators: Agricultural output is quantified using the total agricultural output value. Furthermore, the agricultural output value is adjusted to 2007 prices using the Consumer Price Index (CPI) to maintain comparability.
(3) Undesired Output Indicators: Agricultural carbon emissions are utilized to assess the undesired consumption within agricultural production inputs.
Our study draws upon the methodology proposed by Shestalova et al. [18] for measuring the total factor productivity index through Data Envelopment Analysis (DEA), employing the Malmquist-Luenberger (ML) productivity index. The ML index serves as a benchmark, with values exceeding 1 indicating an increase in agricultural carbon emission efficiency, and values below 1 indicating a decrease. Specifically, utilizing the directional distance function based on the super-efficiency Slack-Based Measure (SBM) model for non-desirable outputs. The model can be used to assess the efficiency of decision-making units. The main advantages of this model are the ability to deal with imperfect data and uncertainty, as well as the identification of room for improvement through the introduction of slack variables. Our study uses this model to construct a directional distance function from year t to year t+1 to measure agricultural carbon performance (AMCPI). Here, K, L, Y, and C represent capital input, labor input, desirable output, and non-desirable output, respectively. The measurement Equation is as follows:
According to the decomposition results above, Agricultural Carbon Emission Performance (AMCPI) comprises changes in agricultural technology efficiency (EC) and changes in agricultural production technology (TC). The former refers to the ability to coordinate and integrate agricultural production resources to maximize economic utility at a certain level of technology. EC>1 indicates efficiency improvement, while the opposite suggests deterioration. The latter is the increase in output and profit brought about by advances in agricultural production technology. TC>1 indicates excellent performance of agricultural technology, whereas the opposite suggests poor performance.
Data Resources
Our study focuses on the spatiotemporal evolution, decoupling effects, and performance evaluation of agricultural carbon emissions at the provincial level in China from 2007 to 2020, examining the regional characteristics and disparities among 31 provinces, municipalities, and autonomous regions in China. Agricultural carbon emission data are derived from various sources, including the China Statistical Yearbook, China Agricultural Yearbook, China Environmental Statistical Yearbook, China Energy Statistical Yearbook, etc. Additionally, we extensively consulted definitions of carbon emission coefficients from institutions such as Oak Ridge National Laboratory in the United States, the Institute of Agricultural Resources and Environment of Nanjing Agricultural University, and the Intergovernmental Panel on Climate Change (IPCC). The basic data for the performance evaluation of agricultural carbon emission are primarily sourced from official websites such as the Ministry of Agriculture and Rural Affairs of China, the State Forestry Administration, the Ministry of Water Resources, the China Meteorological Administration, and the General Administration of Customs.
Table 3.
Agricultural carbon emission performance evaluation system.
Results
Changes in China’s Total Agricultural Carbon Emissions
The calculation results of agricultural carbon emissions in 31 provinces, municipalities, and autonomous regions of China from 2007 to 2020 were conducted in this study, and the change curve is depicted in Fig. 1. Overall, the total agricultural carbon emissions in China exhibited a “reverse U-shaped” curve, consistent with the Environmental Kuznets Curve under the context of a low-carbon economy [19]. The turning point from an increasing to a decreasing trend in carbon emissions occurred in 2017. Prior to 2017, the growth rate of agricultural carbon emissions had shown a trend of slowing down, and thereafter, a decline in carbon emissions was achieved, with the total carbon emissions from agricultural products returning to the level before 2013 by 2020.
Decoupling Analysis
Based on two decoupling evaluation indicators, this study calculates the decoupling types between agricultural carbon emissions and agricultural economic development in China from 2007 to 2020. The results of the OECD decoupling model are shown in Table 4, while the results of the Tapio decoupling model are presented in Table 5. A longitudinal trend chart of the decoupling ratio between agricultural carbon emissions and agricultural economic growth in China, with 2007 as the base year, is depicted in Fig. 2. It can be observed that from 2007 to 2016, the decoupling ratio exhibited a declining trend. In 2017, there was a brief growth in the decoupling ratio, with the value approaching the level of 2015, followed by a stable decline thereafter.
According to the results calculated by the Tapio decoupling evaluation indicators in Table 6, it is evident that during the period from 2007 to 2020, the decoupling types between changes in agricultural carbon emissions and agricultural economic development in China are primarily weak decoupling and strong decoupling. Specifically, divided by 2017 as a dividing line, two phases can be identified. In the first phase (2007-2016), both agricultural carbon emissions and agricultural economy maintained an upward trend. After reaching its first peak in 2009, the growth rate of agricultural carbon emissions gradually declined, dropping to a low point of 0.003 in 2016. Although the growth rate of agricultural economy also showed a similarly gentle decline during this period, it still far exceeded the growth rate of carbon emissions, demonstrating the characteristic trend of weak decoupling of agricultural carbon emissions. In the second phase (2017-2020), there was a strong negative decoupling feature in China’s agricultural carbon emissions in 2017, meaning that while the growth rate of agricultural carbon emissions was positive, the growth rate of agricultural economy was negative. Over the following three years, agricultural carbon emissions continued to decline annually, while agricultural economy grew steadily, with an accelerating growth rate each year, indicating the characteristic trend of strong decoupling of agricultural carbon emissions.
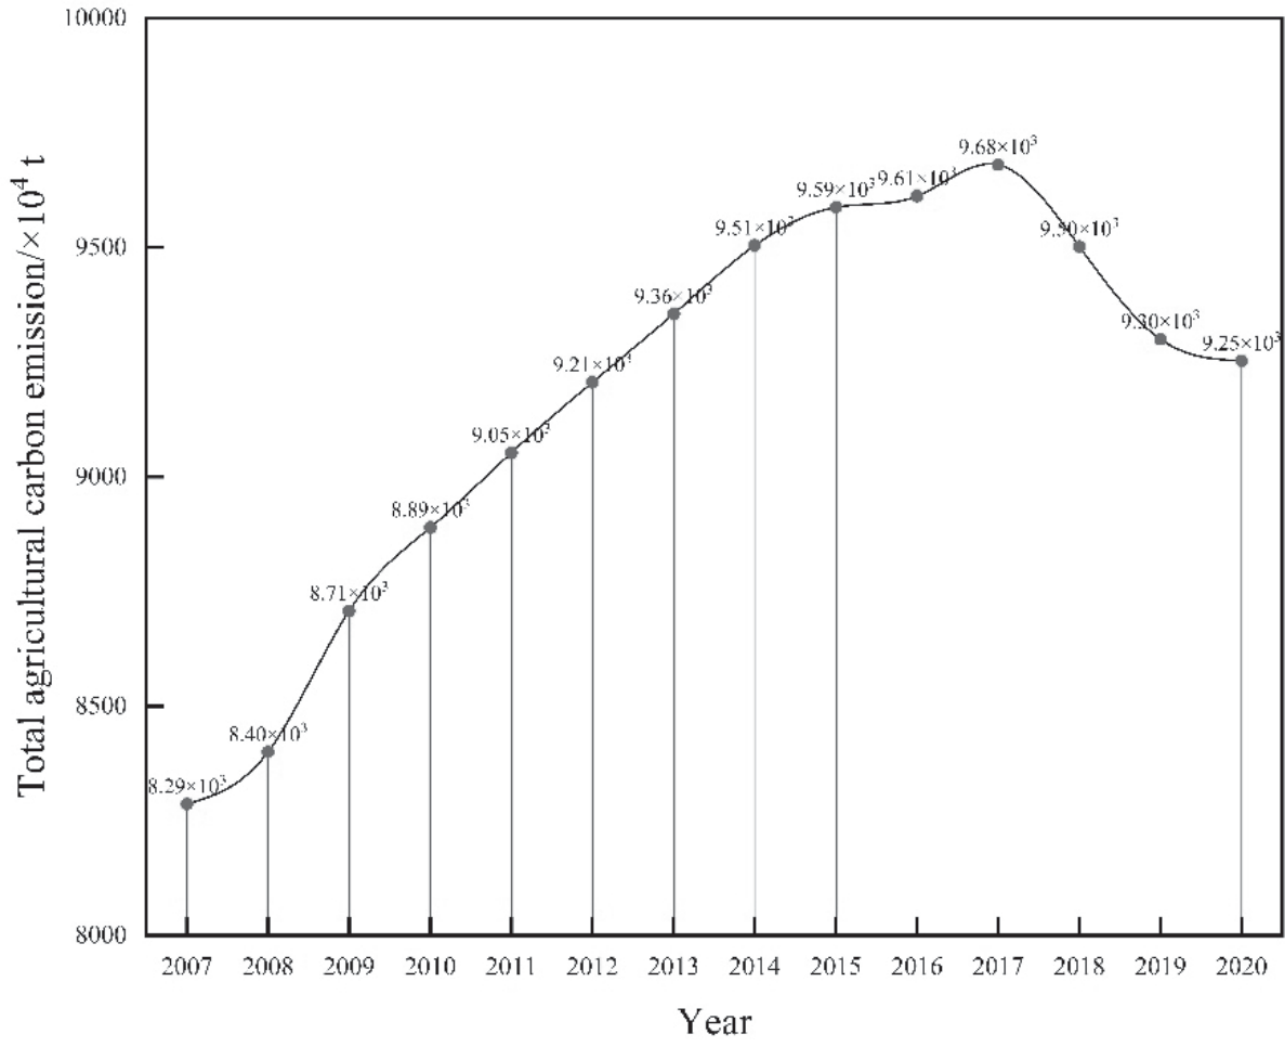
Table 4.
The decoupling relationship between agricultural carbon emission and agricultural economic development in China from 2007 to 2020: based on OECD decoupling evaluation index.
Fig. 2.
Run chart of the decoupling ratio between China’s agricultural carbon emissions and agricultural economic growth.
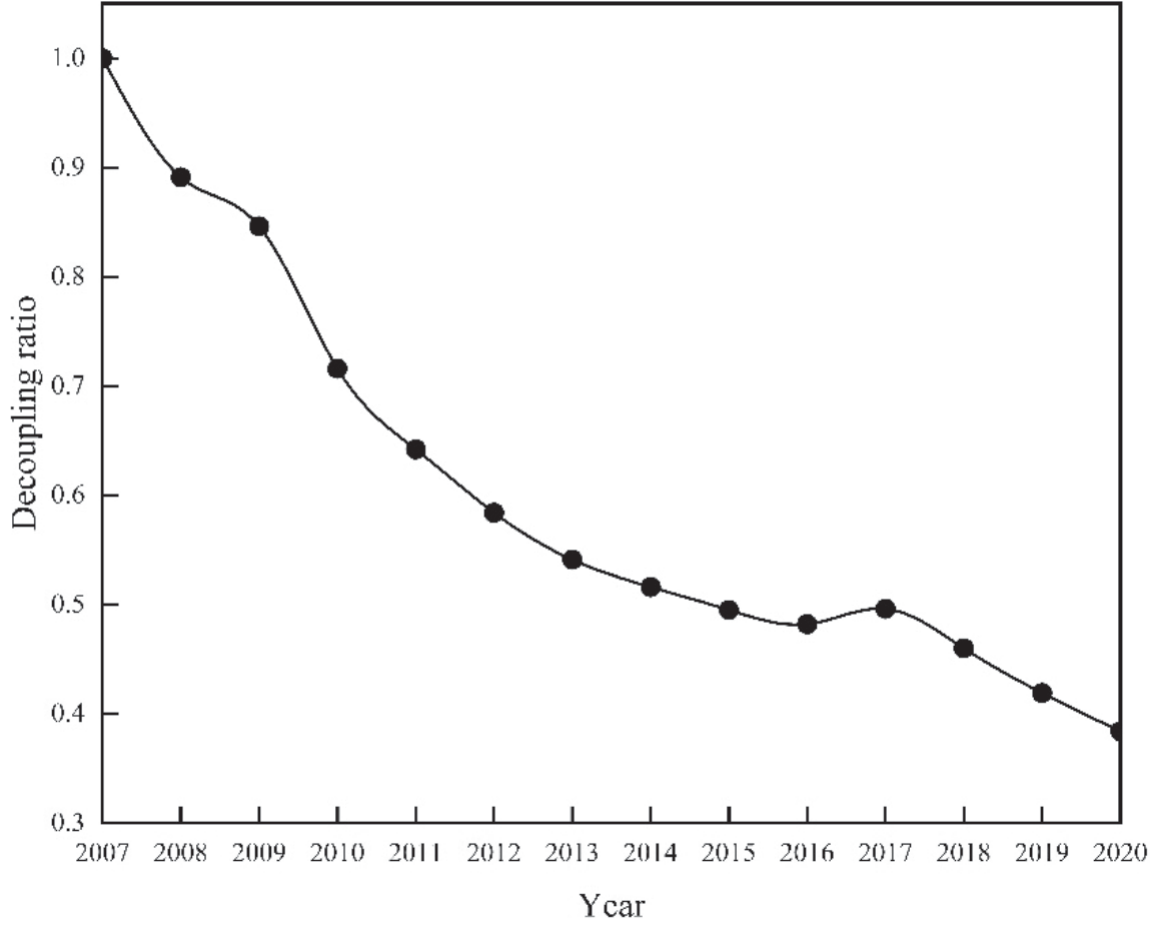
Table 5.
The decoupling relationship between agricultural carbon emission and economic development in China from 2007 to 2020: based on Tapio decoupling evaluation index.
Performance Assessment of Agricultural Carbon Emissions
Table 6 illustrates the overall performance of agricultural carbon emissions efficiency in China from 2007 to 2020. It demonstrates a generally increasing trend with fluctuations, with only the AMCPI value being less than 1 in 2016. The assessment reveals that the agricultural carbon emissions efficiency peaked in 2009, with a value of 1.176, and hit its lowest point in 2016, standing at only 0.997. Further analysis of the decomposition results indicates that technological change (TC) played a crucial role in improving China’s agricultural carbon emissions efficiency from 2007 to 2020. It experienced subpar performance in promoting agricultural technological progress only in 2008 and 2016, while witnessing a growth rate of technological progress of 20.604% in 2017, subsequently aiding in the gradual recovery of China’s agricultural carbon emissions efficiency from its trough. The contribution of technological efficiency change (EC), however, was significant but relatively weaker. In 2013 and 2014, there were consecutive years of weakening technological efficiency effects, with the EC value plummeting to 0.933 in 2014. Although there was some alleviation afterward, it remained unstable.
It is noteworthy that the rate of change in China’s agricultural carbon emissions efficiency has been continuously declining since 2009, with only slight mitigation in 2015, until it reached its lowest point in 14 years in 2016, indicating a significant decline in assessment efficiency. A deeper examination of this phenomenon reveals several factors: Firstly, frequent adjustments to agricultural product structure across regions, such as the implementation of policies like “rice to beans,” “dry to wet,” and “grain to feed,” have led to contradictions in grain supply and demand. According to publicly available data from the National Bureau of Statistics, China’s grain output decreased year-on-year for the first time in 13 years in 2016. Secondly, while agricultural scale continues to expand, rising agricultural input prices, convoluted paths to agricultural mechanization, and low enthusiasm for rural productivity have increased production costs, limiting income growth and quality improvement. Thirdly, frequent natural disasters in agriculture, such as severe flooding in the north in 2012 and frequent extreme convective weather in 2016, have exacerbated the situation.
Table 6.
Performance evaluation and decomposition of China’s agricultural carbon emissions in 2007-2020.
Discussion
Most of the current unified measurements of China’s agricultural carbon emissions focus on planting or livestock farming respectively, while few analyses of carbon emissions from agriculture as a whole have been carried out. Our study on the spatiotemporal evolution characteristics of agricultural carbon emissions in China revealed an overall “inverted U-shaped” trend in total agricultural carbon emissions from 2007 to 2020. Starting from 2017, there was a downward trend in the “inverted U-shaped” curve, with total emissions in 2020 dropping to levels seen before 2013, indicating certain positive effects of emission reduction and carbon reduction efforts in agriculture. It is noteworthy that at the end of 2016, China formally implemented environmental protection taxes, marking a transition from “fees” to “taxes”. This tax imposition played a proactive role in pollution control, emission reduction, and ecological environment protection. The intensity of environmental taxation was in line with the overall carbon emissions, exhibiting an “inverted U-shaped” curve. With strengthened tax administration and refined environmental taxation, the pressure to reduce carbon emissions has driven agricultural product merchants and enterprises towards green transformation, actively reducing pollution emissions and pollution control [20- 22]. While the spatial pattern of agricultural carbon emissions among provinces remains relatively stable, the path and difficulty of achieving “dual carbon” vary significantly due to differences in industrial foundations and resource endowments across regions [23-26]. Over the years, China’s agricultural production has developed distinct regional agricultural development models. Therefore, when optimizing the agricultural production structure, it is essential to make reasonable plans based on local economic conditions, resource endowments, climate conditions, and cultural traditions [27]. It is necessary to fully unleash the vitality of innovative elements such as knowledge, technology, talents, and information in the agricultural field within and between regions to achieve complementary advantages and win-win cooperation. The total amount and performance level of agricultural carbon emissions may generate spillover effects between regions. Therefore, adhering solely to the concept of “who pollutes, who controls” should be avoided to prevent the vicious cycle of “pollution in one place, transfer to another”. Moreover, reducing agricultural public investment and regional assistance due to limited agricultural carbon reduction effects in specific areas should also be avoided. Provinces and regional blocs should share low-carbon technologies, leverage policy demonstration effects between adjacent regions, and foster a virtuous interactive community of technological exchange within regions, ultimately radiating to all parts of the country.
Currently, most scholars adopt two models, the OECD model and the Tapio model, to select decoupling indicators [18, 28]. Among them, more scholars use the Tapio model, which incorporates the concept of elasticity, to study the decoupling types between China’s agricultural carbon emissions and agricultural economic development. Our study calculates the decoupling types of China’s agricultural carbon emissions and agricultural economic growth based on both models. According to the decoupling evaluation indicators of the OECD model, the decoupling ratio trend from 2007 to 2020 shows a downward trend overall. It fluctuated around 0.5 from 2014 to 2017 and further decreased to 0.396 in 2020. Based on the Tapio decoupling evaluation indicators, the decoupling type results from 2007 to 2020 show weak decoupling between China’s agricultural carbon emissions and agricultural economic growth from 2007 to 2016, turning into strong negative decoupling in 2017, and reaching strong decoupling from 2018 to 2020. In 2016, the State Council issued the “National Agricultural Modernization Plan (2016-2020)”, pointing out the significant structural imbalance between supply and demand in some areas of China’s agricultural products. In this context, China urgently needs to seize favorable conditions for existing agricultural modernization and inject new driving forces into agricultural transformation and upgrading. However, to promote green agricultural development, there may be a slowdown or even a decline in economic development speed and continuous difficulty in increasing farmers’ income during the initial stage of construction. This could lead to an increase in agricultural carbon emissions as agricultural practitioners increase inputs such as fertilizers to boost income, which aligns with the strong negative decoupling between agricultural carbon emissions and agricultural economic development in China in 2017. To prevent further deterioration of soil pollution on agricultural land in China and promote ecological civilization construction, the “Law of the People’s Republic of China on Prevention and Control of Soil Pollution” was enacted in 2018. This law clarifies the accountability system for soil pollution, filling the legal gap in soil pollution prevention and control in China. While improving China’s environmental protection legal system, it also contributes policy wisdom to agricultural carbon reduction and the achievement of strong decoupling between agricultural carbon emissions and agricultural economic development.
From 2007 to 2020, China’s agricultural carbon emissions performance showed a trend of “rapid rise-slow decline-stable improvement”. Analyzing the intrinsic reasons for the improvement in China’s agricultural carbon emissions performance and decomposition changes, we find that, on the one hand, technological progress and efficiency improvement in agricultural production are key driving forces for improving China’s agricultural carbon emissions performance [7]. While factors such as increased agricultural capital, improved labor quality, and ecological environment improvement are important guarantees for improving agricultural carbon emissions performance, technological progress and efficiency improvement are the main driving forces for advancing rural revitalization and achieving agricultural modernization [29, 30]. Agricultural technology encompasses new categories, equipment, technologies, and models that promote agricultural development, such as scientific control of pesticide and fertilizer ratios, promotion of water-saving irrigation technology, application of unmanned aerial vehicle pest control systems, and construction of digital farm intelligent platforms, all of which play a role in promoting sustainable green agricultural development [31]. On the other hand, while developing and utilizing new agricultural technologies and dynamics, attention should also be paid to maintaining and improving technological efficiency, especially the changes in technological efficiency caused by scale efficiency [32, 17]. China has a rapidly expanding market demand for agricultural products, and agricultural scientific and technological innovation is a long-term process. Accelerating the overall efficiency of agricultural technology to quickly catch up with the world’s advanced level is imminent. Guided by market demand, focusing on tracking agricultural foundational technologies and core areas, and emphasizing existing scale effects and technological efficiency are particularly important.
Nevertheless, our study is not devoid of limitations, with the most significant being its reliance on provincial data. This dataset may not comprehensively capture the local intricacies and variations in agricultural carbon emissions. However, we remain committed to delving into more granular data in forthcoming research endeavors. Such an approach will enable us to furnish a more precise analysis of the intricate relationship between agricultural carbon emissions and economic development, specifically within the context of China.
Conclusions
The spatiotemporal evolution characteristics of agricultural carbon emissions in China demonstrate an “inverted U-shaped” curve from 2007 to 2020, with an overall rise followed by a decline. Significant regional disparities are observed, while the distribution of emission levels remains stable. The eastern region exhibits the most optimal reduction in agricultural carbon emissions with the least regional variation. The central region has the highest number of provinces, with elevated levels of agricultural carbon emissions, leading to a “polarized” distribution. In the western region, carbon emissions are more dispersed, imposing greater pressure on overall emission reduction and carbon mitigation.
The decoupling analysis between changes in agricultural carbon emissions and agricultural economic development in China reveals a downward trend in the decoupling ratio, fluctuating at a low level around 0.5 from 2014 to 2017, and declining to 0.396 in 2020. Overall, the relationship between agricultural carbon emissions and agricultural economic growth in China has transitioned from weak decoupling to strong decoupling, characterized by a stable period of weak decoupling (2007-2017) and a transitional period maintaining strong decoupling (2018-2020). China’s agricultural economy is gradually reducing its reliance on agricultural carbon emissions.
The assessment of agricultural carbon emission performance and its decomposition results from 2007 to 2020 depict a trend of “rapid increase, slow decrease, and steady improvement.” The Northwest Economic Zone and the Northern Coastal Economic Zone respectively rank highest and lowest, with agricultural production technology changes (TC) exhibiting a more prominent contribution compared to changes in technical efficiency (EC).

