

Introduction
Cancer is a disease that consists of an uncontrolled proliferation of abnormal cells that induce the formation of malignant tumors that can spread to different tissues and organs, causing multiple alterations to their biological functions. It is known that cancer is caused by the development of mutations in some types of genes, such as protooncogenes, tumor suppressor genes, and DNA repair genes, which are responsible for controlling cell growth and division [1]. According to statistics from the World Health Organization, 18,094,716 million cases of cancer were diagnosed in 2020, of which 8,751,759 million cases corresponded to the female population [2]. Among the main types of cancer with a major incidence in women, cervical cancer is the fourth most frequent cancer, with more than 604,000 new cases in 2020. It consists of the development of malignant tumor cells on the cervix zone that connects the vagina with the uterus and produces severe health complications such as pain, bleeding, and kidney failure [3].
There are multiple factors that induce the development of cervical cancer. One of them is the infection by human papillomavirus types 16 and 18, which generate important mutations on the DNA of cervix cells and alter their proliferative rate [4]. On the other hand, it is also known that the overproduction of free radicals by a chronic inflammatory process in the organism represents another risk factor for the development of cervical cancer due to the fact that these radical compounds produce damage to different organs and tissues, including the cervix, in which the exposition of cervical cells to free radicals also induces irreversible mutations in their DNA material and causes a malignant transformation [5].
Nowadays, multiple therapies can be employed for the treatment of cancer. One of them is chemotherapy, which consists of the administration of drugs with cytotoxic effects on tumor cells. One of them is cisplatin [cis-diamminedichloridoplatinum (II)], which is a platinum-based chemotherapeutic agent that was discovered in 1845 by Michele Peyrone, but whose antitumor properties were not reported until 1965 by Barnett Rosenberg [6]. Cisplatin is used for different types of cancer, such as lung, head and neck, breast, testicular, and bladder [7]. Moreover, cisplatin is one of the main chemotherapeutic drugs employed for the treatment of cervical cancer [8]. The mechanism of action of cisplatin to eliminate tumor cells is associated with its capacity to crosslink with the purine bases on the DNA to form adducts that prevent the repair of the DNA and lead to DNA damage that induces apoptosis in cancer cells [9].
Although there are many chemotherapeutic agents to treat patients with cancer, it is known that drug resistance can limit the efficacy of these treatments and cause the progression of tumor cell proliferation [10]. For this reason, several strategies have been developed to increase the effectiveness of chemotherapeutic therapies. One of them is the evaluation of the combination of chemotherapeutic agents with natural treatments such as plant extracts that can enhance their anticancer effects [11, 12].
Plant extracts are complex mixtures of phytochemicals, that include a group of secondary metabolites, which are organic molecules produced by plants that are not essential for their growth and reproduction, in contrast to primary metabolites such as lipids, amino acids, carbohydrates, and nucleic acids [13]. However, it is known that secondary metabolites exhibit diverse biological properties for human health that contribute to the prevention of the development of chronic diseases. For this reason, it has been of interest to recover secondary metabolites from plant material by different methods of extraction. One of them is decoction, which consists of the extraction of water-soluble and thermostable metabolites from plant material that is dissolved in an aqueous solution in which heat is applied until boiling point [12]. According to previous studies, compounds such as phenolic compounds and flavonoids found in plant extracts have demonstrated cytotoxic properties through a decrease in the proliferation of tumor cells [13, 14]. In addition, these metabolites exhibit antioxidant properties due to their capacity to decrease or inhibit free radicals [15]. For this reason, the antioxidant activity of these compounds can contribute to the prevention of the progression of cancer by eliminating the radicals that produce alterations to DNA genes associated with abnormal cell division.
Currently, there is a wide variety of plant species that are used in traditional medicine and represent possible potential sources of phenolic compounds with antitumor and antioxidant properties whose combinations with conventional chemotherapeutic agents could contribute to increasing their effectiveness. The aqueous extracts obtained by decoction from some medicinal plants such as Cassia angustifolia, Arnica montana, Mentha piperita, Artemisia ludoviciana, Equisetum arvense, Verbascum thapsus, Origanum vulgare, Parthenium hysterophorus, Illicium verum, and Tilia mexicana are commonly employed as traditional treatments for several health issues such as gastrointestinal conditions, respiratory disorders, fever, skin irritation, and muscular pain [16]. However, there is minimal information about the antioxidant and antitumor effects of the aqueous extracts from these plant species and their potential to increase the effectiveness of chemotherapeutic agents such as cisplatin.
For the above reasons, the aim of this study was to determine the phenolic composition of eleven aqueous extracts and evaluate their effect on the viability of the human cervical cancer cell line HeLa, as well as to establish if the combination with cisplatin enhances the antitumor activity. Finally, the antioxidant capacity of the plant extracts was also evaluated.
Material and Methods
Plant Material
The plant materials of Cassia angustifolia, Arnica montana, Mentha piperita, Artemisia ludoviciana, Equisetum arvense, Verbascum thapsus, Origanum vulgare, Parthenium hysterophorus, Illicium verum, and Tilia mexicana were purchased at local markets in Saltillo, Coahuila, Mexico. The plant material employed by each species to prepare aqueous extracts is shown in Table 1.
Preparation of Plant Extracts
The eleven aqueous extracts from the medicinal plants were prepared by the extraction method of decoction, following the methodology previously reported by Alfaro-Jiménez et al. (2021) [12]. Briefly, the plant material of each species was dried in a hot air oven at 30ºC and ground into a powder by manual grinding. Then, the powder material was immersed in distilled water to a proportion of 10% weight/volume of solvent (w/v) in Erlenmeyer flasks and incubated at 4ºC for 48 h. Subsequently, the flasks were heated to boiling point for 15 min. Then, the flasks were incubated again at 4ºC for 48 h. Thereafter, the suspensions were filtered with Whatman filters No. 4 (20 µm) and concentrated to dryness by lyophilization (Labconco FreeZone 1 Liter Benchtop Freeze Dry System, Labconco, Kansas, MO, USA) for 72 h, obtaining the aqueous plant extracts. The yield percentages (Y%) were calculated with the following formula:
Determination of Total Phenolic Content (TPC)
The evaluation of TPC on the eleven plant extracts was performed using the method of Folin-Ciocalteu and following the protocol previously reported by Gu et al. (2019) and Iqbal et al. (2022) with some modifications [17, 18]. In this procedure, 20 µL plant extract samples (1 mg/mL) were added with 90 µL diluted Folin-Ciocalteu reagent (1:10) in each well of a 96-well microplate. The microplate was shaken for 1 min and incubated for 5 min. Then, 90 µL Na2CO3 6% was added to each well, and microplate was incubated for 1 min. Subsequently, the microplate was incubated in darkness at room temperature for 90 min. Finally, absorbances were measured at 630 nm wavelength in a plate reader (Synergy HTX, BioTek, Santa Clara, CA, USA). A standard curve of gallic acid (6.25-100 µg/mL) was performed to determine the TPC, which was calculated by linear regression and expressed as milligrams of gallic acid equivalents per gram of dry extract weight (mg GAE/g).
Determination of Total Flavonoid Content (TFC)
The evaluation of TFC on the eleven plant extracts was assessed using the aluminum chloride method and following the methodology reported by Gu et al. (2019) and Iqbal et al. (2022) with some modifications [17, 18]. In this procedure, 20 µL plant extract samples (1 mg/mL) were added with 10 µL aluminum chloride 10% and 10 µL potassium acetate 1 M in each well of a 96-well microplate. The microplate was shaken for 1 min. Subsequently, 160 µL distilled water was added to each well, and microplate was shaken for 1 min. Subsequently, the microplate was incubated in darkness at 37ºC for 40 min. Finally, absorbances were measured at 415 nm wavelength in a plate reader (Synergy HTX, BioTek, Santa Clara, CA, USA). A standard curve of quercetin (2.5-100 µg/mL) was performed to determine the TFC, which was calculated by linear regression and expressed as milligrams of quercetin equivalents per gram of dry extract weight (mg QE/g).
Table 1.
Vegetal organs of the medicinal plants evaluated.
Identification of Phenolic Compounds in Plant Extracts by Reverse Phase Performance Liquid Chromatography Accoupled to Mass Spectrometer (RP-HPLC-MS)
The phenolic phytochemical profile of the eleven plant extracts was evaluated by RP-HPLC-MS analysis, according to De León-Medina et al. (2020) [19]. The chromatographic analysis was carried out on a Varian HPLC system, including an autosampler (VarianProStar 410, Palo Alto, CA, USA), a ternary pump (VarianProStar 230I, Palo Alto, CA, USA), and a photo diode array (PDA) detector (VarianProStar 330, Palo Alto, CA, USA). A liquid chromatograph ion trap mass spectrometer (Varian 500-MS IT Mass Spectrometer, Palo Alto, CA, USA) equipped with an electrospray ion source was also used. Samples (5 µL) were injected onto a Denali C18 column (150 × 2.1 mm, 3 µm, Grace, Palo Alto, CA, USA). The oven temperature was maintained at 30ºC. The eluents were formic acid (0.2%, v/v; solvent A) and acetonitrile (solvent B). The following gradient was applied: initial, 3% B; 0-5 min, 9% B linear; 5-15 min, 16% B linear; 15-45 min, 50% B linear. Run time: 65 min. The column was then washed and reconditioned. The flow rate was maintained at 0.2 mL/min, and elution was monitored at 245, 280, 320, and 550 nm wavelengths. The whole effluent (0.2 mL/min) was injected into the source of the mass spectrometer without splitting. All MS experiments were carried out in the negative mode [M-H]−1. Nitrogen was used as a nebulizing gas and a helium as damping gas. The ion source parameters were: spray voltage 5.0 kV and capillary voltage and temperature 90.0 V and 350ºC, respectively. Data were collected and processed using MS Workstation software (V 6.9, VarianProStar Palo Alto, CA, USA). Samples were first analyzed in full scan mode in the m/z range of 50-2000.
Determination of Cytotoxic Activity of Plant Extracts and Cisplatin
The cytotoxic activity of the eleven plant extracts and cisplatin was evaluated on in vitro human cervical cancer cells (HeLa cell line) by the cell viability assay of MTT (3-(4,5-dimethylyhiazol-2-il)-2,5-diphenyl tetrazolium bromide), following the methodology previously reported by Zugasti et al. (2020) [20]. The present evaluation was approved by the Ethics Committee (approval code: 19-2021, 4th February 2021) of the Faculty of Chemistry of the Autonomous University of Coahuila. In this procedure, the HeLa tumor cells were seeded in 96-well cell culture plates (5 x 10³ cells/well) and incubated at 37ºC overnight in a 3.5% CO2 atmosphere. A stock solution of each plant extract (4000 µg/mL) and cisplatin (50 µg/mL) was prepared by dissolving the treatments in Roswell Park Memorial Institute – 1640 medium (RPMI-1640) (Life Technologies Gibco, Grand Island, NY, USA) and sterilized by filtering through 0.22-µm sterile syringe filters (Merck Millipore®). Subsequently, the cells were treated with the different plant extracts (25-3200 µg/mL) or cisplatin (2.5-20 µg/mL). The plates were incubated at 37ºC for 72 h in a 3.5% CO2 atmosphere. After incubation, the cell viability was determined with the MTT assay, in which 40 µL MTT reagent were added to each well and incubated for 4 h. Thereafter, the supernatants were removed, and 100 µL di-methyl sulfoxide (DMSO) was added in each well to dissolve the formazan crystals. Finally, absorbances were measured at 540 nm wavelength in a plate reader (Synergy HTX, BioTek, Santa Clara, CA, USA). The results were expressed as percentages of cell viability (cell viability %) which were calculated with the following formula:
where: At: Test sample absorbance, and An: Negative control absorbance
Evaluation of the Cytotoxic Effect of Aqueous Plant Extracts in Combination with Cisplatin
The half-maximal lethal concentration (LC50) values of the plant extracts and cisplatin were determined by linear regression. Subsequently, the combination of the LC50 value of cisplatin with each LC50 value of the different plant extracts was also evaluated on HeLa tumor cells under the same experimental conditions to determine a possible significant enhancement of the antitumor activity.
Determination of the Antioxidant Activity of Plant Extracts
DPPH Radical Scavenging Assay
The antioxidant activity of the eleven plant extracts was determined with the DPPH (2,2-diphenyl- 1-picrylhydrazyl) assay, according to the methodology previously reported by Alfaro-Jiménez et al. (2021) [12]. In this procedure, a DPPH˙ radical solution (1 mM) was prepared in ethanol at 96°. Subsequently, 50 μL of this solution was added to a 150 μL sample of the plant extracts (25-3600 µg/mL) in 96-well microplates. The mixtures were incubated in darkness at 25ºC for 30 min, and absorbances were measured at 517 nm wavelength in a plate reader (Synergy HTX, Bio Tek, Santa Clara, CA, USA). The radical scavenging activity was expressed as the inhibition percentage of DPPH˙radical (DPPH Inhibition %) and calculated with the following formula:
Where: Anegative control: Absorbance of negative control, and Asample: Absorbance of sample.
ABTS Radical Scavenging Assay
The antioxidant activity of the eleven plant extracts was also determined with the ABTS (2,2’-azino-bis (3-ethylbenzothiazoline-6-sulfonic acid) assay, following the protocols previously reported by Wong-Paz et al. (2015) and Aranda-Ledesma et al. (2022) with some modifications [21, 22]. In this procedure, the ABTS•+ radical cation was prepared with an aqueous ABTS solution (7 mM) and potassium persulfate solution (2.45 mM) which were mixed and incubated in darkness at room temperature for 12 h. Thereafter, the ABTS•+ radical cation solution was diluted with ethanol to adjust an absorbance value of 0.700±0.020 at 734 nm wavelength. Subsequently, 5 µL sample of the plant extracts (25-3200 µg/mL) was added in 95 µL ABTS•+ radical cation solution in 96-well microplates. The mixtures were incubated for 1 min and absorbances were measured at 734 nm wavelength in a plate reader (Synergy HTX, Bio Tek, Santa Clara, CA, USA). The radical scavenging activity was expressed as the inhibition percentage of the ABTS•+ radical (ABTS Inhibition %) and calculated with the following formula:
Where: Anegative control: Absorbance of negative control, and Asample: Absorbance of sample.
FRAP Scavenging Assay
The antioxidant potential of the eleven plant extracts was also evaluated with the ferric-reducing antioxidant potential (FRAP) assay, according to the methodology previously reported by Gu et al. (2019) and Aranda-Ledesma et al. (2022) with some modifications [17, 22]. In this procedure, 5 µL sample of the plant extracts (1 mg/mL) was added in 12 µL phosphate buffer (pH 7.0) in a 96-well microplate. Subsequently, 22 µL potassium ferricyanide 1% was added to each well, and microplate was mixed and incubated at 50ºC for 20 min. After incubation, 12 µL trichloroacetic acid 10%, 45 µL distilled water, and 10 µL ferric chloride 0.1% were added to each well. Finally, absorbances were measured at 700 nm wavelength in a plate reader (Synergy HTX, BioTek, Santa Clara, CA, USA). A standard curve of ascorbic acid (6.25-100 µg/mL) was performed to determine the antioxidant activity, which was calculated by lineal regression and expressed as milligrams of ascorbic acid equivalents per gram of dry extract weight (mg AAE/g).
Statistical Analysis
All evaluations were performed in triplicate, and the results were presented as the mean±standard deviation (SD). The sample means were compared by one-way ANOVA, followed by Dunnett’s multiple comparison test, using the SPSS 16.0 statistical software. Differences between means at 95% (*p<0.05) were considered statistically significant.
Results and Discussion
Yields and Phytochemical Characterization of Plant Extracts
In this study, a total of eleven aqueous extracts from selected medicinal plants were obtained by the extraction method of decoction, and their % Y values are shown in Table 2. The extraction yield is a parameter that indicates the amount of metabolites that can be recovered from plant material after a process of extraction. In this study, the method of decoction was employed for the obtention of water-soluble and thermostable phytochemicals from the different plant species. According to the results, the eleven extracts exhibited different extraction yields, being the extracts from P. hysterophorus (21.57±0.02%), and C. angustifolia (17.86±0.12%) showing the highest yield values. On the other hand, the extract from A. montana (7.62±0.71%) exhibited the lowest yield. Regarding the extract from P. hysterophorus, its yield percentage obtained is higher than the value previously reported by Hernández-Marín et al. (2018), who prepared a methanolic extract of leaves and bark from the species Parthenium incanum by Soxhlet extraction and obtained a yield of 8.05% [23]. On the other hand, the yield from C. angustifolia is higher than the previous value reported by VijayaSekhar et al. (2016), who prepared an aqueous extract from the leaves of C. angustifolia by Soxhlet extraction and obtained a yield of 11.60% [24]. For the above, it is suggested that the extraction method of decoction in the plants P. hysterophorus and C. angustifolia could contribute to obtaining major yields on the recovery of phytochemicals. Moreover, the differences in yield percentages between the eleven aqueous extracts can be associated with the types of metabolites and their concentrations that constitute the phytochemical profile of each plant. It is known that the influence of genetics, as well as environmental conditions, such as geographical location, temperature, humidity, light, soil type, and mineral composition, can induce the production of different phytochemical compounds among plant species [25]. For this reason, it is possible that the differences in the phytochemical composition of the eleven plant extracts are also reflected in their yield values.
On the other hand, as part of the evaluation of the phytochemical constituents of the plant extracts, the determination of total phenolic content (TPC) and total flavonoid content (TFC) was performed by the colorimetric methods of Folin-Ciocalteu and aluminum chloride, respectively (Table 2). According to the results, the extracts from M. piperita (88.47±0.65 mg GAE/g), A. ludoviciana (87.70±2.42 mg GAE/g), and T. mexicana (83.00±0.42 mg GAE/g) exhibited the highest phenolic content values. Moreover, the extracts from A. ludoviciana (33.25±3.80 mg QE/g), V. thapsus (22.36±0.40 mg QE/g), and M. piperita (22.11±3.91 mg QE/g) also showed the highest flavonoid contents. Previous studies have also reported that extracts from some of these plants and related species, such as the aqueous extract from C. angustifolia (47.60 mg GAE/g), hydroalcoholic extracts from A. montana (97.17 mg GAE/g), M. piperita (62.6 mg GAE/g), and Artemisia vulgaris (28.62 mg GAE/g), methanolic extract from P. hysterophorus (89.36 mg GAE/g), and ethanolic extract from I. verum (127 mg GAE/g) are important sources of phenolic compounds [24-29].
It is known that the phenolic compounds are secondary metabolites widely distributed in plants, whose chemical structure is characterized by the presence of phenolic groups constituted by benzene rings with one or more hydroxyl substituents [30]. According to their classification, the phenolic compounds are divided into different categories, with flavonoids being one of the most relevant due to the beneficial biological properties that these have demonstrated for human health, including the capacity to prevent the development of cancer and other chronic diseases such as cardiovascular and neurodegenerative affections associated with oxidative stress and inflammation [31, 32]. Therefore, the previous TPC and TFC values exhibited by the plant extracts demonstrated that these species could be sources of metabolites with cytotoxic effects on human cancer cells and antioxidant potential.
Subsequently, the evaluation of the phytochemical composition of the eleven extracts was complemented with an analysis by RP-HPLC-MS to identify the phenolic compounds found in each extract (Table 3). According to the results, all aqueous extracts were found to be sources of phenolic compounds, with a total of 63 different metabolites identified. Moreover, the extracts of A. ludoviciana (16), M. piperita (14), and C. angustifolia (13) exhibited the highest number of compounds detected, while in the extracts of P. hysterophorus (3), I. verum (Fruits) (4), and I. verum (Seeds) (2), found the minor numbers of metabolites were found. These results demonstrated a correlation with the previous evaluations of phenolic and flavonoid content, in which the extracts from A. ludoviciana and M. piperita exhibited some of the highest values, while the extracts from I. verum (Fruits) and I. verum (Seeds) showed the lowest levels of these metabolites. On the other hand, the phytochemical families of flavonols and hydroxycinnamic acids were those groups with the highest number of compounds identified in the extracts by RP-HPLC-MS analysis.
It is known that flavonols are one of the most relevant subclasses of bioactive compounds that belong to the broad family of flavonoids. These are widely diffused in plant species and can be found on fruits, flowers, leaves, and stems [33]. Quercetin and kaempferol are metabolites that belong to the group of flavonols, which have exhibited major relevance due to their beneficial properties for human health, including antitumor and antioxidant activities [34]. Some derivatives of quercetin (quercetin, quercetin 3-O-rutinoside, quercetin 3-O-glucoside, and quercetin 3-O-xylosyl-glucuronide) and kaempferol (kaempferol, kaempferol 3,7,4’-O-triglucoside, kaempferol 3-O-rutinoside, kaempferol 3,7-O-diglucoside, and kaempferol 3-O-galactoside 7-O-rhamnoside) were identified in various of the plant extracts evaluated in the present study, such as C. angustifolia, A. ludoviciana, E. arvense, V. thapsus, and I. verum (Fruits).
Table 2.
Yields, total phenolic and flavonoid contents of plant extracts.
On the other hand, hydroxycinnamic acids are compounds that belong to the group of phenolic acids that are present in a variety of plant-based foods [35]. These metabolites are mainly recognized for their radical scavenging activities [32]. According to the results obtained by RP-HPLC-MS analysis, some metabolites that belonged to this phytochemical family, such as caffeic acid 4-O-glucoside and 1-caffeoylquinic acid, exhibited a major prevalence in the plant extracts, being distributed among the extracts from A. montana, M. piperita, A. ludoviciana, V. thapsus, P. hysterophorus, and T. mexicana. Previous studies have reported that derivative compounds from these hydroxycinnamic acids demonstrated cytotoxic effects on human cancer cells and antioxidant properties. Kanimozhi and Prasad (2015) evaluated the cytotoxic activity of caffeic acid on the in vitro culture of the HeLa cell line, determining a significant decrease in cell viability through the induction of apoptosis [36]. Moreover, Mohammed et al. (2022) identified the presence of 1-caffeoylquinic acid and some derivatives such as 3-caffeoylquinic acid and 1,3-dicaffeoylquinic acid in a hydroalcoholic extract from Jasonia glutinosa, which exhibited cytotoxic antitumor effects against the human cancer cell lines of breast (MCF-7) and liver (HepG2) [37]. In addition, Kim et al. (2020) also reported that an ethanolic extract from Lepisorus thunbergianus demonstrated an antioxidant potential that was attributed to the presence of several derivatives of caffeoylquinic acids such as 3-caffeoylquinic acid, 4-caffeoylquinic acid, and 5-caffeoylquinic acid [38].
Scopoletin is a metabolite that belongs to the group of coumarins that also showed a major prevalence in the plant extracts, being identified in the extracts from A. montana, M. piperita, A. ludoviciana, and V. thapsus. This compound has exhibited the capacity to decrease the proliferation of human tumor cells [39]. A previous study performed by Tian et al. (2019) demonstrated scopoletin produced cytotoxic effects on the HeLa cell line, as well as other human cancer cell lines such as breast (MCF-7 and MDA-MB-435), liver (HepG2), and lung (A549) [40]. Hence, it is possible that the presence of the previous metabolites in the different plant extracts can contribute to producing antitumor and antioxidant effects.
Cytotoxic Activity of Plant Extracts, Cisplatin, and Their Combinations
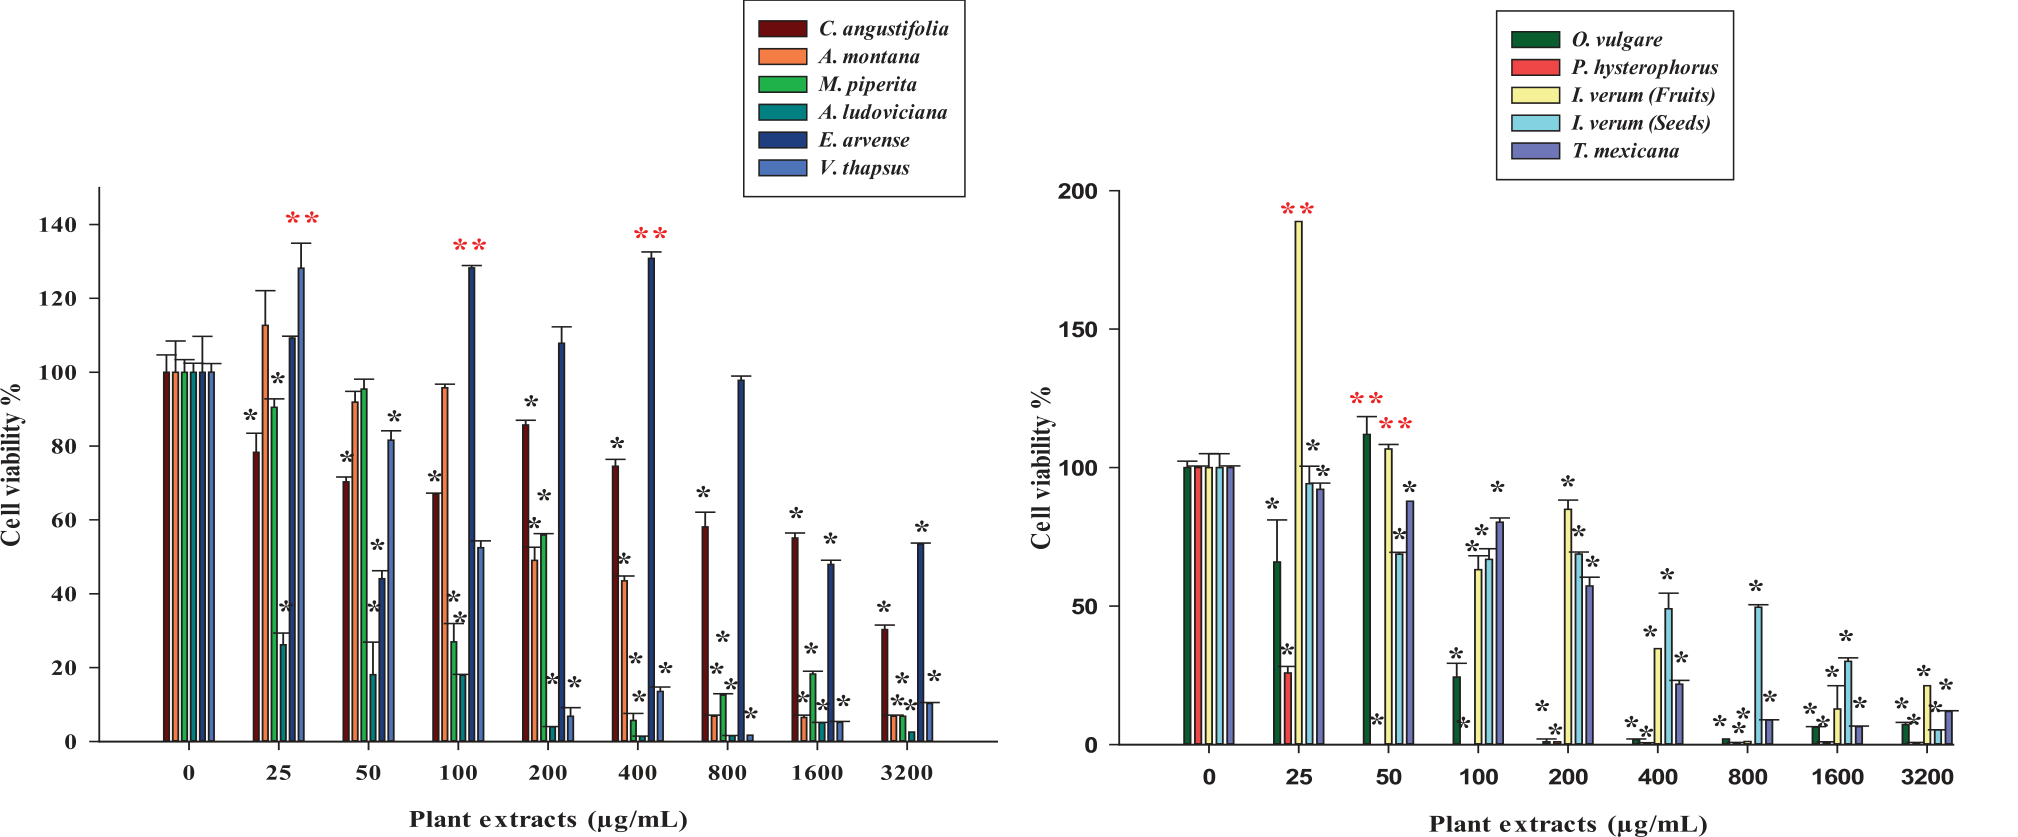
Subsequently, the cytotoxic activity of the eleven plant extracts (25 to 3200 µg/mL) and cisplatin (2.5 to 20 µg/mL) was evaluated on the HeLa cell line to determine their effect on the viability of human cervical cancer cells by MTT assay (Fig. 1). The principle of this colorimetric method is based on the capacity of the mitochondrial enzyme succinate dehydrogenase for reducing 3-(4,5-Dimethylthiazol-2-yl)-2,5-diphenyl-2H-tetrazolium bromide) (MTT tetrazolium salts) to (E,Z)- 5-(4,5-dimethylthiazol-2-yl)-1,3-diphenyl-formazan (formazan crystals) during cellular mitochondrial respiration. Hence, the MTT assay is a sensitive and reliable indicator of the metabolic activity of viable cells, which is reflected in their capacity to produce formazan crystals, which can be measured spectrophotometrically at 540 nm wavelength [41]. According to the results obtained in MTT assay, the extracts from C. angustifolia (85.71±1.25 to 30.27±1.25%), A. montana (112.66±9.41 to 6.82±0.32%), M. piperita (95.43±2.66 to 6.84±0.00%), A. ludoviciana (26.18±3.16 to 1.36±0.09 %), E. arvense (130.86±1.73 to 44.09±2.16%), V. thapsus (121.20±2.46 to 1.70±0.80%), O. vulgare (135.54±7.83 to 1.20±0.20%), P. hysterophorus (25.81±2.36 to 0.00±0.10%), I. verum (Fruits) (188.83±0.00 to 1.12±0.00%), I. verum (Seeds) (94.19±6.31 to 5.26±0.06%), and T. mexicana (92.17±2.28 to 12.18±0.27%) induced a significant decrease of the viability of the HeLa cell line in most of their concentrations, compared to the negative control (*p<0.05). On the other hand, the cisplatin significantly decreased the viability of the HeLa cell line in a concentration dependent manner (65.09±2.02 to 3.77±0.10%) (Fig. 2).
Among the different aqueous extracts evaluated, the extracts from A. ludoviciana and P. hysterophorus exhibited the highest cytotoxic activities against the HeLa cell line. The cytotoxic effects produced by the aqueous extract from A. ludoviciana on the HeLa cell line were higher than those reported by Khan et al. (2022), who evaluated the effect of a methanolic extract from Artemisia judaica on the HeLa cell line, exhibiting a decrease in cell viability of about 50.00% at a concentration of 100 µg/mL [42]. On the contrary, the extract from A. ludoviciana exhibited a percentage of cell viability of 17.91±0.28% at the same concentration. Moreover, previous studies have also reported that aqueous and ethanolic extracts obtained from other species of the genus Artemisia, such as A. campestris and A. capillaris, induced cytotoxic effects on the human cancer cell lines of the colon (HT-29) and liver (Huh-7 and HepG2), respectively [43, 44].
On the other hand, the cytotoxic antitumor activity demonstrated by the aqueous extract from P. hysterophorus is higher than that reported by Sharma et al. (2015), who evaluated the potential of a methanolic extract from P. hysterophorus (125-1000 µg/mL) to decrease the viability of the HeLa cell line, exhibiting a minor cytotoxic activity that was reflected in the attainment of major percentages in cell viability (82.30 to 30.00%) than those exhibited in the present work (25.81±2.36 to 0.00±0.10%) [45]. Moreover, Kumar et al. (2014) also determined the effect of an aqueous extract from P. hysterophorus flowers on the viability of the human cancer cell lines of lung (A549) and colon (HCT-116), obtaining a significant decrease in cell viability in both cell lines [46]. According to the authors, these antitumor properties were attributed to the presence of flavonoids in the plant extract, which exhibited a concentration of 20.25±0.12 mg QE/g, while the aqueous extract from P. hysterophorus evaluated in the present study also showed to contain flavonoids with a concentration of 9.87±0.43 mg QE/g. Therefore, it is possible that the antitumor potential demonstrated by the aqueous extracts from A. ludoviciana, P. hysterophorus, and the rest of the plant species evaluated in this study can be associated with the presence of phenolic compounds and flavonoids, which are considered pharmacologically active metabolites whose application as possible adjuvant treatments for cancer could contribute to inhibiting the proliferation of malignant tumor cells [31, 47].
Table 3.
Phytochemical compounds identified in aqueous plant extract by RP-HPLC-MS. Table 3. Phytochemical compounds identified in aqueous plant extract by RP-HPLC-MS. Table 3. Phytochemical compounds identified in aqueous plant extract by RP-HPLC-MS. Table 3. Phytochemical compounds identified in aqueous plant extract by RP-HPLC-MS.
[i] R.T.: Retention time; 1: C. angustifolia; 2: A. montana; 3: M. piperita; 4: A. ludoviciana; 5: E. arvense; 6: V. thapsus; 7: O. vulgare; 8: P. hysterophorus; 9: I. verum (Fruits); 10: I. verum (Seeds); 11: T. mexicana; *compound detected.
[ii] R.T.: Retention time; 1: C. angustifolia; 2: A. montana; 3: M. piperita; 4: A. ludoviciana; 5: E. arvense; 6: V. thapsus; 7: O. vulgare; 8: P. hysterophorus; 9: I. verum (Fruits); 10: I. verum (Seeds); 11: T. mexicana; *compound detected.
Fig. 1.
Effect of plant extracts on the viability of the HeLa cell line. The HeLa cell line was seeded on culture plates and treated with the plant extracts (25–3200 µg/mL). Subsequently, the plates were incubated at 37ºC for 72 h, and viability was determined by MTT assay. The results were subjected to ANOVA statistical analysis and evaluated by Dunnett’s multiple comparison test. The data is shown as mean (n = 3) values±standard deviation. *: Significant decrease of cell viability compared to negative control (p<0.05). **: Significant increase of cell viability compared to negative control (p<0.05).
Regarding cisplatin, the results exhibited its capacity to decrease the viability of the HeLa cell line in a concentration dependent manner. Cisplatin is a platinum-based chemotherapeutic agent widely employed for the treatment of different types of cancer, including cervical cancer. However, the use of cisplatin in cancer therapy is limited by the acquired or intrinsic resistance of cells to the drug, which is a consequence of a reduced uptake or retention of this chemotherapy in the organism and results in a decrease in cytotoxicity on malignant tumor cells [48, 49]. For this reason, an evaluation of the effect of cisplatin in combination with each plant extract was performed to determine a possible enhancement of their cytotoxic activities. In this procedure, the LC50 values of plant extracts and cisplatin were calculated by lineal regression based on the concentration-response curves (Table 4).
According to the results, cisplatin exhibited a LC50 value of 5.83 µg/mL that is similar to the LC50 reported by Sidhu and Capalash (2021), who evaluated the cytotoxic activity of cisplatin on the HeLa cell line and obtained a LC50 value of 4.5 µg/mL [50]. Moreover, previous studies have also determined the LC50 values of cytotoxic antitumor effects on HeLa cell lines of different extracts obtained from some of the plant species evaluated, such as M. piperita (hydroalcoholic extract, LC50: 160 µg/mL), E. arvense (petroleum ether extract, LC50: 760 µg/mL), and O. vulgare (ethyl acetate extract, LC50: 50 µg/mL) [51-53]. The differences in these LC50 compared to the values determined in this study can be attributed to possible variations in the phytochemical composition of the extracts due to the polarity of the organic solvents employed for the extraction of secondary metabolites from the plant material. It is known that the types of phytochemicals that can be recovered in a process of extraction depending on their affinity for the polarity of the organic solvent selected [54].
Fig. 2.
Effect of cisplatin on viability of the HeLa cell line. The HeLa cell line was seeded on culture plates and treated with cisplatin (2.5–20 µg/mL). Subsequently, the plates were incubated at 37ºC for 72 h, and viability was determined by MTT assay. The results were subjected to ANOVA statistical analysis and evaluated by Dunnett’s multiple comparison test. The data is shown as mean (n = 3) values±standard deviation. *: Significant decrease of cell viability compared to negative control (p<0.05).
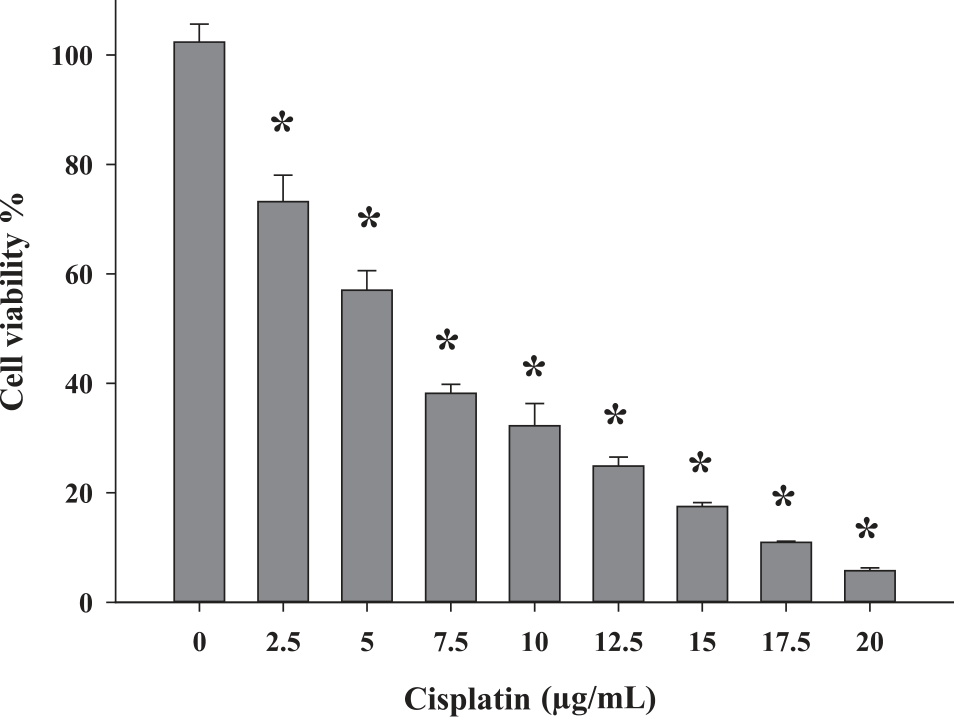
Table 4.
LC50 values of plant extracts and cisplatin on HeLa cell line.
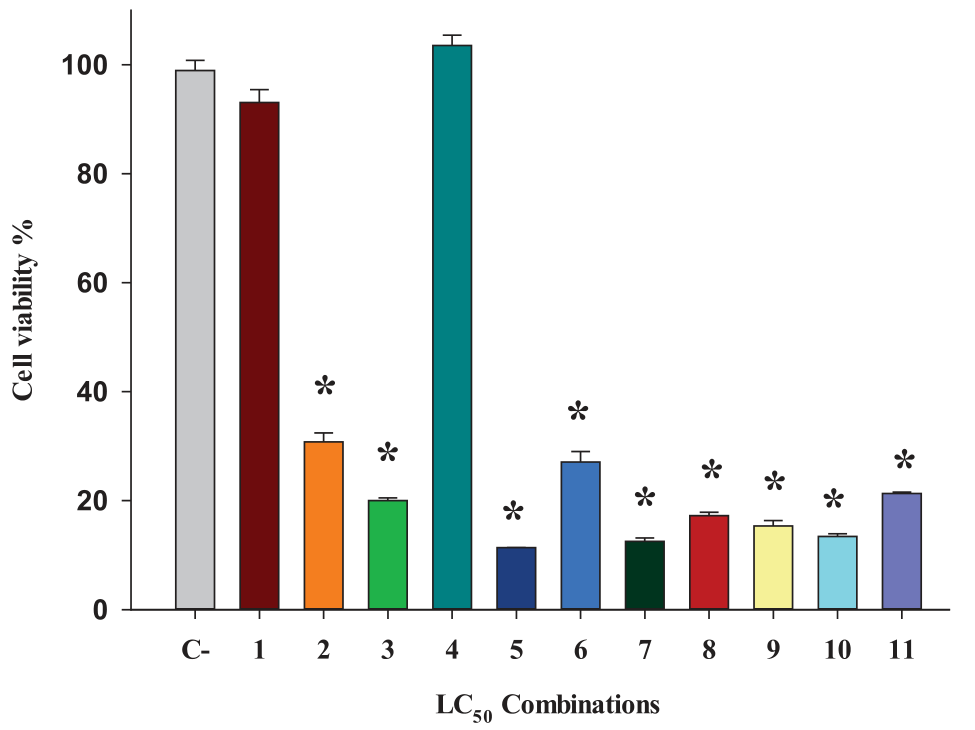
Subsequently, the HeLa cell line was treated with different combinations of the LC50 of cisplatin with the LC50 of each extract to establish a possible enhancement of its antitumor potential. According to the results shown in Fig. 3, the LC50 of cisplatin combined with the LC50 values of A. montana (30.91±1.65%), M. piperita (20.02±0.49%), E. arvense (11.53±0.05%), V. thapsus (24.98±4.49%), O. vulgare (13.23±1.52%), P. hysterophorus (12.30±0.37%), I. verum (Fruits) (15.31±0.80%), I. verum (Seeds) (13.14±0.72%), and T. mexicana (21.09±0.50%) produced a significant decrease of cell viability compared to negative control (100.00±4.89%), showing percentages of viability lower than 50% that demonstrate a significant increase of the cytotoxic activity compared to the effects of the single treatments. Moreover, the extract from P. hysterophorus exhibited the highest cytotoxic effects in combination with cisplatin on the HeLa cell line due to its capacity to produce a high reduction in cell viability with the lowest LC50 (16.85 µg/mL) compared to the other combinations with the LC50 values from the rest of the plant extracts.
Previous studies have also reported the capacity of different plant extracts to enhance the antitumor activity of cisplatin against different human cancer cell lines. Ghavami et al. (2020) evaluated the effect of an ethanolic extract from Morus alba in combination with cisplatin on the viability of the human gastric adenocarcinoma cell line (AGS). The results exhibited that the combination produced a significant increase of cytotoxic activity compared to the single effects of the M. alba extract and cisplatin [55]. Moreover, Sureshkumar et al. (2023) demonstrated the capacity of the combination of an ethanolic extract from Tiliacora triandra with cisplatin for enhancing the antitumor activity on human cholangiocarcinoma cell lines (KKU-M213B and KKU-100) [56].
Fig. 3.
Effect of the combinations of LC50 of cisplatin with LC50 of plant extracts on the viability of the HeLa cell line. The HeLa cell line was seeded on culture plates and treated with combinations of LC50 value of cisplatin with LC50 values of plant extracts of C. angustifolia (1), A. montana (2), M. piperita (3), A. ludoviciana (4), E. arvense (5), V. thapsus (6), O. vulgare (7), P. hysterophorus (8), I. verum (Fruits) (9), I. verum (Seeds) (10), and T. mexicana (11). Subsequently, the plates were incubated at 37ºC for 72 h, and cell viability was determined by MTT assay. The results were subjected to ANOVA statistical analysis and evaluated by Dunnett’s multiple comparison test. The data is shown as mean (n = 3) values±standard deviation. LC50: half maximal lethal concentration. *: Significant decrease of cell viability compared to negative control (C-) (p<0.05).
The mechanism of action related to the cytotoxic activity of the combinations of the plant extracts with cisplatin is unclear, but it is possible that multiple compounds are involved. One of the most important is the group of flavonoids. Previous studies have demonstrated that the combination of cisplatin with some flavonoids such as kaempferol, isorhamnetin, apigenin, and quercetin enhanced the cytotoxic effects against the human cancer cell lines of ovarian (OVCAR-3), lung (A-549), bladder (T24), and liver (Hep3B), respectively [57-60]. In the present study, the presence of derivatives from these flavonoids in the plant extracts could be associated with the enhancement of the cytotoxic activity in combination with cisplatin on the HeLa cell line. This can be associated with the capacity of the metabolites to affect cervical cancer cells through different mechanisms of action that complement the cytotoxic effects of cisplatin and increase the process of cell death.
On the other hand, the combination of the LC50 of cisplatin with the LC50 values of C. angustifolia (92.48±4.33%) and A. ludoviciana (102.51±1.84%) did not produce a significant decrease in cell viability compared to the negative control. Previous studies have also reported that the combination of different plant extracts with cisplatin caused a reduction in the cytotoxic antitumor effects. Pinmai et al. (2008) determined that the combination of cisplatin with the aqueous extracts from Phyllantus emblica and Terminalia bellerica on the human cancer cell line of the liver (HepG2) produced a significant reduction in cytotoxic activity compared to the effects exhibited by the single treatments [11]. Moreover, Mutalib et al. (2023) demonstrated that the combination of cisplatin with the ethanolic extract from Chromolaena odorata decreased the cytotoxicity on human cancer cell lines of the breast (MCF-7 and MDA-MB-231) compared to their single cytotoxic effects [61]. According to the previous results, it is unknown how the mechanism of the combinations of cisplatin with the aqueous extracts of C. angustifolia and A. ludoviciana reduce the antitumor effects on the HeLa cell line. However, the presence of some of the metabolites identified in the extracts could have contributed to blocking the antitumor activity of cisplatin. Gallic acid 3-O-gallate is a compound found in the extract from C. angustifolia. A previous study performed by Mamat et al. (2020) demonstrated that the combination of gallic acid and cisplatin produced a decrease in the cytotoxic activity on the HeLa cell line at some concentrations [62]. On the other hand, myricetin 3-O-rhamnoside was another metabolite identified in the extract from A. ludoviciana. Liu et al. (2008) reported that the compound myricetin decreased the cytotoxic activity of the chemotherapeutic agent bortezomib on human lymphoma cell lines HRC57 and DoHH2, as well as the human myeloma cell lines RPMI-8226 and U266 [63]. According to the authors, the reduction of the antiproliferative effect on the human cancer cell lines was produced by the chemical interactions of myricetin with the boronic acid group found in bortezomib, which induced the formation of new chemical structures with less cytotoxic effects. For this reason, it is possible that the presence of these metabolites in the extracts from C. angustifolia and A. ludoviciana and their chemical interactions with cisplatin could have contributed to a decrease in the cytotoxic effects on the HeLa cell line [64]. However, further studies are required to confirm this hypothesis.
Antioxidant Activity of Plant Extracts
As a part of the evaluation of the biological properties of the eleven aqueous extracts, their antioxidant activities were determined by the spectrophotometric assays of DPPH, ABTS, and FRAP. The DPPH scavenging assay is an antioxidant method based on the reduction of the DPPH˙radicals by the donation of hydrogen atoms, which produces a change of color from violet/purple to pale yellow that reflects the formation of stable compounds [65]. According to the results, the eleven extracts showed a significant antioxidant capacity, being the extracts from C. angustifolia (68.84±0.19%), M. piperita (72.15±0.35%), E. arvense (74.91±0.22%), and I. verum (Seeds) (74.27±4.80%) which exhibited the highest percentages of DPPH˙inhibition at the concentration of 3200 µg/mL. On the contrary, the extracts of A. montana (28.98±1.41%) and I. verum (Fruits) (23.54±1.35%) showed the lowest percentages of radical inhibition at the same concentration. The half-maximal inhibitory concentration (IC50) of each extract is shown in Table 5. Previous studies have also determined the antioxidant properties of extracts of these plant species and others belonging to the same genus. Yadav and Singh (2022) evaluated the antioxidant activity of an aqueous extract from M. piperita (250 µg/mL), obtaining a percentage of DPPH˙ inhibition of 27.11% [66]. Moreover, Sureshkumar et al. (2021) and Abid et al. (2023), determined the capacity of an methanolic extract from Equisetum ramosissimum (123.89 µg/mL) and an ethanolic extract from I. verum (750 µg/mL) to scavenge DPPH˙radicals, exhibiting inhibitory percentages of 50.00% and 78.30%, respectively [67, 68].
On the other hand, the ABTS assay was performed to complement the evaluation of the antioxidant activity of the plant extracts. The principle of this method is based on the generation of a blue/green ABTS•+ radical cation that is reduced by the secondary metabolites through the transference of electrons and causes a color loss of ABTS that is proportional to the antioxidant activity [69]. According to the results, the eleven extracts showed the capacity to inhibit ABTS•+ radical in a concentration dependent manner. However, the extracts from M. piperita, O. vulgare, and T. mexicana exhibited major antioxidant activity, with percentages of ABTS•+ inhibition higher than 90.00% (94.61±0.75% to 100.00±1.88%) since the concentration of 200 µg/mL. On the contrary, the extract from I. verum (Seed) showed a lower antioxidant effect compared to the other extracts because of the minor percentages of inhibition obtained in the range of concentrations from 25 to 1600 µg/mL (2.51±1.64% to 55.05±0.95%). The IC50 values of each extract are shown in Table 6. Previous evaluations have reported that extracts obtained from plants belonging to the same genus also exhibited the capacity to inhibit the ABTS•+ radical. Guemidi et al. (2023) evaluated the antioxidant effect of an hydroalcoholic extract from M. piperita, obtaining a percentage of the inhibition of ABTS•+ radical of about 50.00% at 2500 µg/mL [25]. Moreover, Benslama et al. (2021) also reported that a methanolic extract from Origanum majorana exhibited the capacity to inhibit the ABTS•+ radical, with an IC50 of 19.66 µg/mL [70].
Finally, the evaluation of the antioxidant potential of the plant extracts was also performed with the FRAP assay. The principle of this method is based on the capacity of metabolites found in the plant extracts to act as reducing agents through the reduction of ferric ion radicals (Fe3+) to ferrous ions (Fe2+) [71].The results obtained in this assay demonstrated that the eleven extracts exhibited antioxidant activity, being the extracts from A. montana (5.12±0.54 mg AAE/g), M. piperita (5.77±0.30 mg AAE/g), O. vulgare (5.65±0.37 mg AAE/g), and T. mexicana (5.54±0.25 mg AAE/g), which demonstrated the major capacity of radical inhibition. On the contrary, the extract from I. verum (Seeds) (0.45±0.67 mg AAE/g) exhibited the lowest antioxidant potential (Table 7). Previous studies also exhibited that alcoholic extracts from A. montana (158.59 mg TE/g), O. vulgare (13.7 mg TE/g), and Tilia argentea (53.01 mg TE/g) demonstrated the capacity of reducing Fe3+ ion radicals by FRAP assay [72–74].
Table 5.
DPPH ˙ radical inhibitory activity of plant extracts.
Table 6.
ABTS radical inhibitory activity of plant extracts.
Table 7.
Ferric reducing antioxidant potential (FRAP) of plant extracts.
According to the previous results, the eleven extracts demonstrated to have antioxidant potential, being the extracts from M. piperita, O. vulgare, and T. mexicana which showed high antioxidant activities in the radical scavenging assays. These antioxidant properties can be associated with the total phenolic content values previously determined by the Folin Ciocalteu method in which these extracts also exhibited a high concentration of these metabolites compared to the other extracts. It is known that the phenolic compounds are secondary metabolites with powerful antioxidant properties because these have the capacity to inhibit free radicals through different mechanisms, such as the transference of hydrogen atoms or single electrons, and the chelation of transition metals [75]. Previous studies have determined there is a correlation between the antioxidant potential of plant extracts and their concentrations of phenolic compounds, exhibiting that a major prevalence of these metabolites can contribute to increasing the antioxidant activity and preventing the development of cancer through the elimination of radicals [25, 76]. Hence, the high antioxidant activity exhibited by the plant extracts from M. piperita, O. vulgare, and T. mexicana is correlated with a major concentration of phenolic compounds.
Conclusions
In this study, the eleven aqueous extracts from C. angustifolia, A. montana, M. piperita, A. ludoviciana, E. arvense, V. thapsus, O. vulgare, P. hysterophorus, I. verum (fruits and seeds), and T. mexicana demonstrated to be sources of phenolic compounds and flavonoids with the capacity to decrease the viability of the human cervical cancer cell line HeLa and enhance the cytotoxic effects of the chemotherapeutic agent cisplatin, with the extract from P. hysterophorus exhibiting the highest cytotoxic activity in HeLa cells. Moreover, the aqueous extracts also showed antioxidant activity, with the extracts from M. piperita, O. vulgare, and T. mexicana having the highest capacity to scavenge radicals. Hence, the present aqueous extracts from selected medicinal plants are promising sources of secondary metabolites such as phenolic compounds and flavonoids with antitumor and antioxidant activities that have not been exploited completely, but further studies for determining their cytotoxic effects in other in vitro and in vivo models of cancer cells and their capacity to increase the antitumor potential of cisplatin and other chemotherapeutic agents will contribute to demonstrating the possible potential of these extracts to be employed as auxiliar treatments in cancer therapy.

