

Introduction
Climate change is a global environmental issue that has plagued humanity since the Industrial Revolution [1]. China is one of the countries with high greenhouse gas emissions, and agriculture is a direct source of greenhouse gas emissions in China, accounting for around 24% of total greenhouse gas emissions [2-4]. China is a large producer and consumer of rice, with China’s rice production reaching 2.08×10⁸t in 2022, placing it first in the world [5]. Rice paddies are considered to be a significant source of greenhouse gas emissions, accounting for approximately 11% and 30% of global N2O and CH4 emissions from agroecosystems, respectively [6-8]. As a result, Chinese agriculture must implement significant carbon sequestration and emission reduction strategies to contribute to the objective of carbon neutrality by 2060 [9-11]. On the other hand, the world’s food supply will continue to be put to the test as the world’s growing population drives increasing human demand for arable land resources [12, 13]. Ecological rice farming methods integrating rice and aquaculture are actively being developed to convert from petroleum-based agriculture to ecological agriculture in order to minimize global warming and achieve sustainable output [14, 15].
Rice-fishery co-cropping model is a new three-dimensional aquaculture technology developed in recent years to scientifically integrate planting and fishing under artificial conditions, such as a symbiotic ecosystem formed after the introduction of aquatic populations in the rice-fishery ecosystem with rice and aquatic organisms as the dominant organisms [16-18]. The most prominent of them are rice-shrimp co-cropping and rice-crab co-cropping models. The Liaohe River basin area is abundant in Chinese mitten crabs and is one of China’s three primary crab production locations [19]. Panjin City is located in the southern section of the Liaohe River Basin’s alluvial plain, where rice is widely cultivated, and is one of the key rice-producing sites in the basin [20]. Panjin has steadily developed a unique rice-crab co-cultivation model since the early twentieth century. Rice-crab co-cropping has emerged as an important ecological agricultural model in China’s Liaohe River Basin as a sustainable rice ecological farming model. Organic rice-crab co-cropping has been shown to increase not only rice yield but also soil organic carbon content and substantially improve the quantity and composition of soil carbohydrates [21]. Rice-crab co-cropping has the potential to control and minimize pests, illnesses, and weeds while also reducing the usage of chemical fertilizers and pesticides. Additionally, it enhances crab production [22, 23]. It provides larger economic rewards while also benefitting the environment. Rice-shrimp co-cropping is the use of rice paddy soil and water environment for rice cultivation and small Chinese long arm shrimp farming ecological farming model, with the total area of rice-shrimp co-cropping in 2020 reaching 1.26×10⁶ hm-2, has developed into an emerging rice paddy aquaculture composite ecological model in China [24, 25]. In comparison to rice monoculture, the rice-fishery co-cropping model promotes the reduction of chemical fertilizer and pesticide application, biodiversity conservation, soil improvement, and greenhouse gas emission reduction, and can significantly increase farmers’ income [26].
Carbon footprinting is a popular method for accounting for carbon emissions from agroecosystems [27, 28]. It refers to the total direct or indirect carbon emissions in terms of carbon dioxide equivalents during the life cycle of a product, service, or activity. In the agriculture sector, carbon footprint evaluations often employ the life cycle assessment approach, which accounts for the entire direct or indirect carbon emissions caused by farming operations and agricultural inputs during the agricultural production process. Due to the monoculture character of its functional output, the choice of functional units in the carbon footprint analysis of the traditional rice cropping model is usually unit area, unit weight, or unit energy, etc. In summary, this study uses field trials of rice monoculture, rice-shrimp co-cropping, and rice-crab co-cropping in Panjin City, Liaoning Province, as a case study, and combines the life-cycle assessment method to compare the carbon footprints of different rice cropping models using unit area and output value as functional units, respectively. The findings of this study can be used to give technical support for a more thorough carbon footprint assessment of agricultural production systems with multifunctional outputs.
Experimental
Study Area and Data Sources
This research was conducted in 2022 at Panjin, Liaoning Province, which is one of China’s most major commercial grain production bases, with a rice production of 4.25×10⁶ t and a planted area of 5.21×10⁵ hm-2 in 2021. Panjin is located in Liaoning Province’s south-central region, on the lower banks of the Liaohe River, with a mean annual temperature of 10.7ºC and an annual precipitation of 821.6 mm. Panjin City, one of 14 prefecture-level cities in Liaoning Province, is extremely suitable for the rice-fishery co-cropping model due to geographic and climatic factors, and the rice and aquatic products produced in the region are renowned as geographical indications products in China. Due to climate limits, Panjin can only cultivate rice for a single season each year, with seeding in late May and harvesting in early October. The data for this study were collected in 2022 at the Panjin integrated rice-farming experimental base and included two integrated farming models, rice-shrimp co-cropping (T1) and rice-crab co-cropping (T2), with rice alone serving as the control. Three paddy fields, each 667 m2, were set up as replicates for each model. In the experiment, the rice variety employed was Yanfeng 47, the crab species was Chinese mitten crab, and the shrimp species was Chinese tiny long arm shrimp. At harvest, the related paddy yields, including rice yield and fisheries output, were reported. In addition to the agricultural input variables described above, data used for carbon footprint and economic benefit study includes machinery, diesel, electricity, and labor.
Carbon Footprint Estimation
The carbon footprint estimation in this work is based on total life cycle GHG emissions from rice production, including CH4 and N2O.The GHG emissions in the three rice farming models are primarily indirect and direct emissions from the production, storage, and transport of various agricultural inputs, as computed by the formula:
Where: CFA denotes the carbon footprint per unit area [kg (CO2-eq)·hm-2]; Qi denotes the amount of agricultural inputs for agricultural production per unit area, specifically chemical fertilizer, organic fertilizer, fodder, pesticide, and rice seed, as well as the consumption of electricity and diesel fuel in the irrigation, land preparation, and harvesting processes. Aquatic animal saplings and anti-evasion facilities were not addressed in the carbon footprint accounting of this study due to a lack of relevant carbon emission components. Changes in soil organic carbon pools were not considered due to a lack of long-term soil organic carbon monitoring. Furthermore, because the straw in this experiment was not returned to the field, the CO2 and straw components in the farming stage were not included in the carbon accounting. The carbon emission coefficients of different farming materials [kg(CO2-eq)·Unit-1] are represented by ki, and the cumulative emissions of CH4 and N2O (kg·hm-2) produced in the farming stage are represented by QCH4 and QN2O. QCH4 and QN2O denote the total amount of CH4 and N2O emitted during the farming stage (kg·hm-2). The CH4 emissions of rice monoculture, rice-shrimp co-cropping, and rice-crab co-cropping model were 315.30 kg·hm-2, 231.20 kg·hm-2, and 268.20 kg·hm-2, respectively. On a 100-year scale, the warming trends of CH4 and N2O are 34 and 298 (in CO2-eq). Only N2O emissions from fertilizer application or fodder feeding were examined in this study; N2O emissions from other sources were excluded for the time being. As a result, the cumulative N2O emission from paddy fields can be stated as follows:
Where: N is the amount of pure nitrogen introduced into the system by the application of chemical fertilizer, organic fertilizer, or feeding feed [kg(N)·hm-2]; an is the emission coefficient of N2O emission caused by N inputs, with rice monocropping set at 0.5%, rice-shrimp co-cropping set at 0.3%, and rice-crab co-cropping set at 0.3%; and 44/28 is the coefficient for N2O conversion.
Analysis of Net Economic Benefits of Ecosystems (NEEB)
Calculate the net ecosystem economic benefit with reference [29]:
NEEB = rice field benefits-rice
field input costs-carbon costs
Carbon cost = GWP × carbon price
Table 1.
Emission factors used to estimate GHG emissions from the production, storage and transport of different agricultural inputs and farm management.
Grain yield returns are based on current grain prices and grain production. Agricultural input costs include mechanical tillage, rice seed, fertilizer, irrigation, and pesticides. Carbon costs are the carbon trading price (42 yuan/t CO2-eq) and GWP. GWP is the amount of GHG emissions converted to CO2-eq.
Data Statistics And Analysis
Using DPS 18.1 software [30], the trial’s raw data were submitted to one-way ANOVA after being tallied using Excel 2019.
Results
Paddy Yields and Agricultural Inputs
As shown in Table 2, there were significant disparities in overall economic production across the three rice farming models. Shrimp and crab production in rice fields produced larger economic returns than rice cultivation alone. Looking at rice yields from the standpoint of food security, we can also see that T1 and T2 rice yields are greater than CK, with T1 being the most significant, with its rice yield being over 4.00% higher than CK. However, what causes farmers to earn greater economic returns remains mostly dependent on fishing output in paddy fields, which is 17.04 percent higher in T2 compared to T1. Of fact, this variance is mostly due to the market economy, and fishing production in various places may be radically contrary. In terms of input costs, T1 and T2 are 47.47 percent and 44.89 percent more, respectively, than CK. The ultimate net profit, however, is 66.67% and 78.68% more than that of CK, respectively.
Carbon Footprint
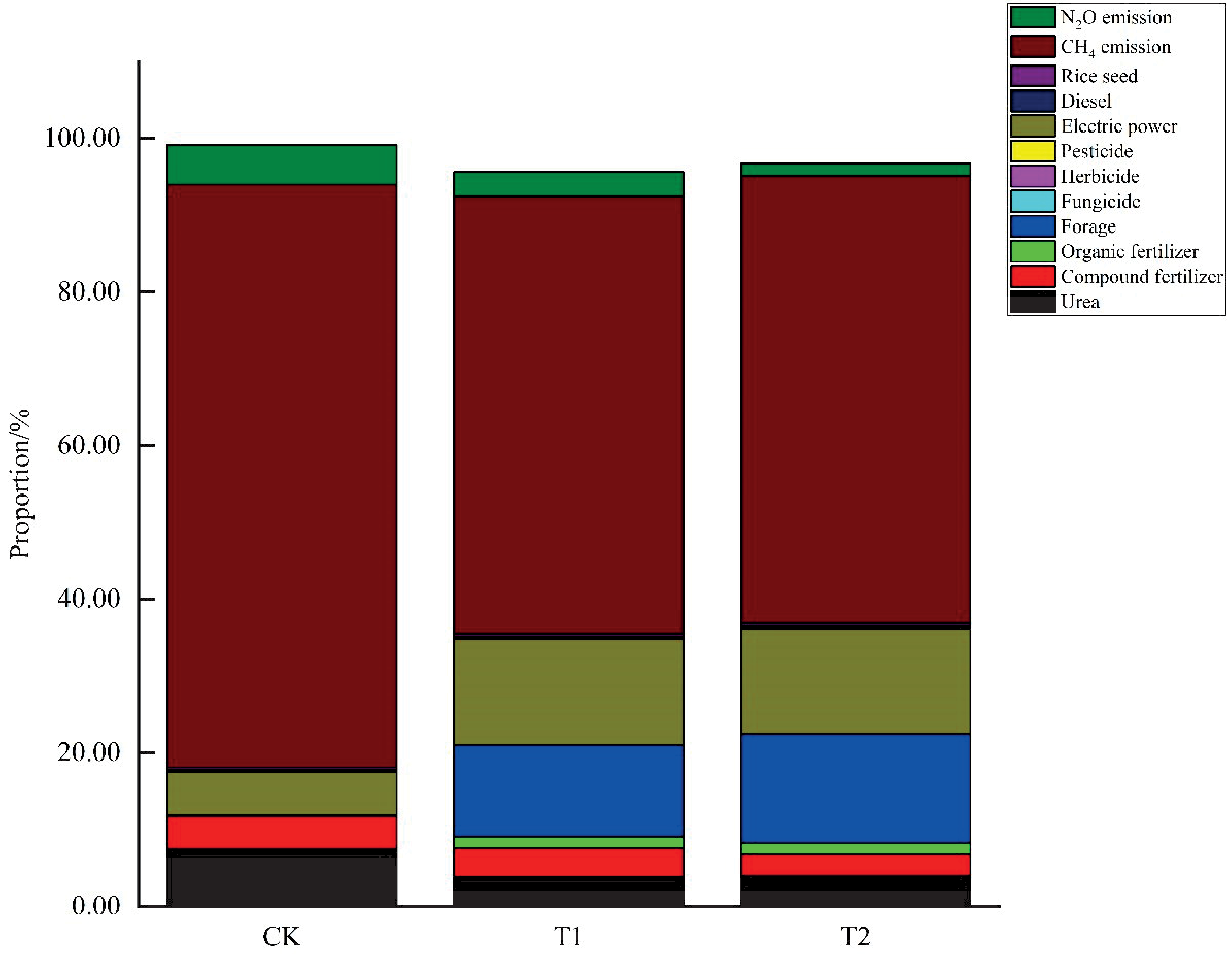
Aside from the economic benefits, the ecological benefits of various rice-fishery co-cropping methods are a focus. As a result, we used the LCA methodology to account for the carbon footprints of the three rice farming models (Table 3). The T1 treatment has the smallest carbon footprint per unit area, 13791.78 kg (CO2-eq)·hm-2, which is 2.34% and 11.69% less than the CK and T2 treatments, respectively. The influence of direct emissions from the field on CK treatment was significant, with CH4 emissions contributing up to 75.91% and N2O emissions contributing 5.16%. Urea, compound fertilizer, and electricity contributed 7.48, 4.18, and 5.64 percent, respectively. During the stages of agricultural production, distribution, and transport, whereas other agricultural inputs, such as rice seeds, insecticides, and diesel fuel, contributed less than 1%. Similarly, the effect of direct emissions from the field was stronger for the T2 and T3 treatments, with contributions of 57.00 and 58.39% for CH4 emissions and 3.19 and 1.60% for N2O emissions, respectively. Unlike the CK treatments, the T1 and T2 treatments increased the use of organic fertilizers and fodder without pesticide inputs. The contribution of organic manure in T1 and T2 treatments was more or less the same, but the contribution of fodder in T2 treatment was increased by 2.41 per cent relative to T1 treatment. The contribution of electricity in T1 and T2 treatments was increased by 8.17 per cent and 8.09 per cent relative to CK, respectively.
Net Ecosystem Economic Benefits
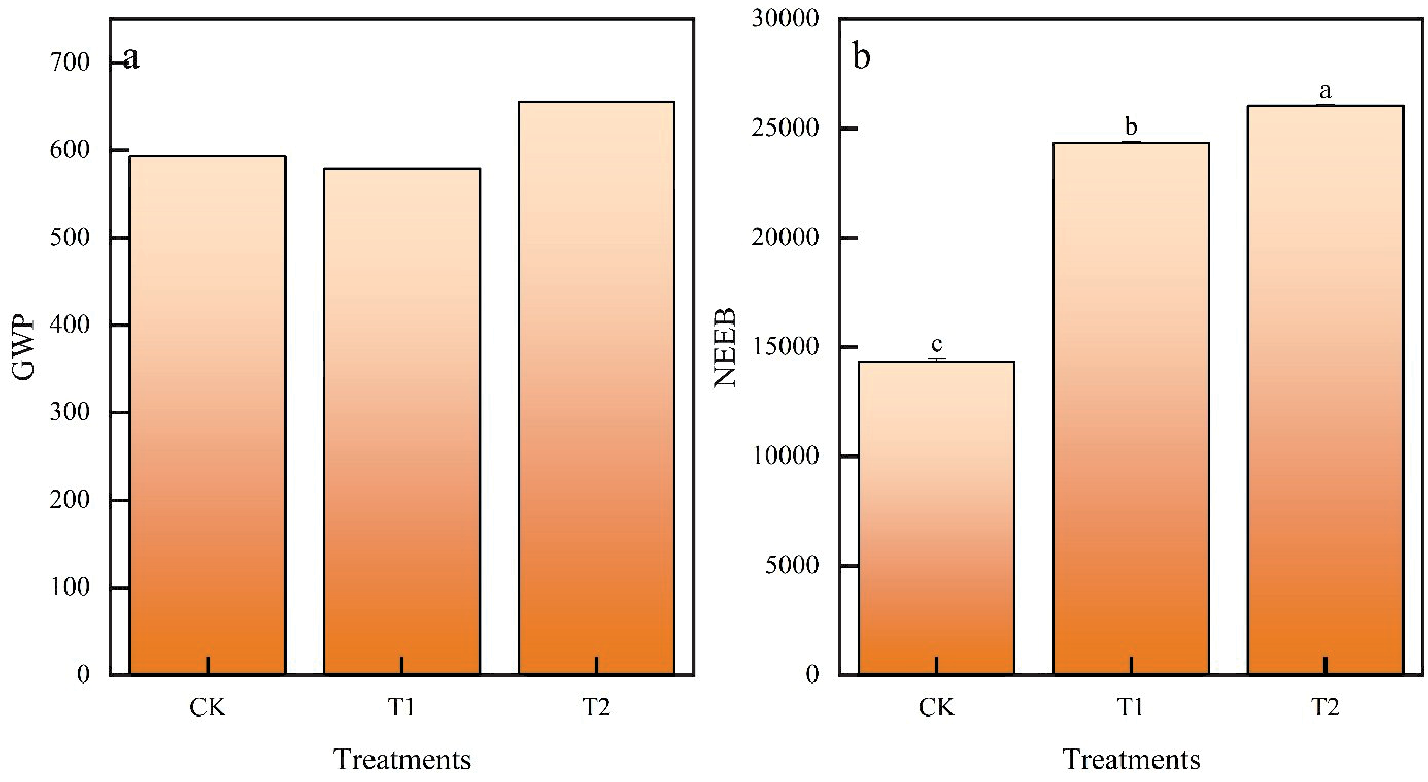
T2 therapy had the greatest GWP cost, as shown in Fig. 2, followed by CK and T1 treatments. When compared to CK therapy, the GWP cost of T1 treatment was lowered by 2.34 percent. When compared to CK and T1 therapies, the GWP cost of T2 therapy rose by 10.58% and 13.24%, respectively. There were considerable variances in NEEB between the three paddy cropping types. T2>T1>CK in the order of magnitude of NEEB. T1 and T2 therapies were shown to be more effective than CK by 81.45% and 69.52%, respectively. T2 therapy resulted in a 7.06% improvement over T1 treatment.
Discussion
The rice-fishery co-cropping model, as a typical circular agricultural paradigm, efficiently combines rice development with aquaculture of fish, shrimp and crab. In comparison to the traditional rice monoculture model, rice-fishery co-cropping model can improve soil fertility, restrict the establishment of rice field pests and diseases, and improve the rice field’s ecological environment [31]. As a new form of rice-fishery co-cropping model, the integrated rice farming model’s agricultural inputs and production management differ from those of the classic rice monoculture model, and the amount and content of its carbon footprint has also altered. Because of the necessity to establish a favorable environment for shrimp and crab development and reproduction, the rice-fishery co-cropping model not only increases feed products, but also increases the needs for water management. As a result, as compared to the rice monoculture model, carbon emissions from power utilized for drainage and irrigation are much higher under the rice-fishery co-cropping model. Furthermore, the newly added fodder products considerably contributed to the rice-fishery co-cropping model’s carbon emissions. According to the findings of this study, the rice-shrimp co-cropping model significantly changed the magnitude of direct carbon emissions (CH4 and N2O) from the paddy field, whereas an increase in agricultural material inputs significantly increased the indirect carbon emissions from the paddy field. However, due to the greater output value and profit of shrimp and crab, the unit output value and unit profit under the rice-shrimp co-cropping model were much higher than those under the rice monoculture model in terms of economic advantages. The NEEB results also revealed that the NEEB of the two rice-fishery co-cropping models in this study was greater than the NEEB of the rice monoculture model. As a result, the trade-off between carbon emissions and economic advantages should be prioritized, and the search for efficient and low-carbon rice-fishery co-cropping techniques should be a major goal in this sector.
Table 2.
Comparison of rice field outputs of three rice farming models.
Table 3.
Agricultural inputs and carbon footprint per unit area of different rice farming models.
Conclusions
In this study, economic output, carbon footprint and NEEB were analyzed for rice monoculture, rice-shrimp and rice-crab co-cropping models. Ultimately, it was found that the rice-shrimp co-cropping model had the lowest overall carbon emission and the rice-crab co-cropping mode had the highest economic output and NEEB. However, the rice-crab co-cropping model was not conducive to reducing carbon emissions from rice fields.

