

Introduction
Atmospheric particulate matter (PM) is considered a significant air pollutant that poses a threat to human health: it can cause cardiovascular disease, lung function damage, and increased cancer risk [1-4]. In recent years, a global continuous monitoring network for PM has been established, and relevant policies have been formulated to eliminate PM pollution [5]. Related studies have mainly focused on PM of sizes less than or equal to 2.5 μm (PM2.5) or 10 μm (PM10). The possible damage that can be caused by PM varies according to the PM’s physical properties, chemical composition, and origin [6]. PAHs are products of incomplete combustion, and prolonged exposure to PAHs can lead to a range of cancer-related health problems [7, 8]. PM2.5 and PM10 combined with PAHs can cause different health effects [9-13]. Currently, long-term and synchronous monitoring of PM2.5- and PM10-bound PAHs is very limited, especially in developing countries suffering from severe air pollution [1].
Impervious surface cover within urban environments alters the hydrology, energy distribution, and non-point source pollution load [14, 15]. Research has found that impervious surfaces can develop organic film 11-1000 nm thick and with an organic matter content of 5-40%. This organic film has a substantial impact on the migration and fate of organic pollutants in the surrounding environment [16]. A variety of persistent organic pollutants, including polycyclic aromatic hydrocarbons (PAHs), have been detected in organic film on glass surfaces [17]. In addition, organic film has the ability to respond quickly to changes in air pollution [18]. The film can record the air quality at the time of sampling and predict short-term changes in airborne organic pollutants [19, 20].
In 2022, PM2.5 and PM10 were the primary airborne pollutants in 141 cities in China [21]. PAHs are carried by PM2.5 into human alveoli and pose a substantial threat to human health [13]. Therefore, taking into consideration Shanghai’s dominant wind direction and urban-rural gradient, this study selected representative sampling sites to measure and compare the component characteristics and pollution levels of PAHs in PM2.5, PM10, and organic film. The study also examined the distribution characteristics of PAHs in the organic film-atmosphere and analyzed the PAH sources in order to provide theoretical and data support for the study of multimedia urban PAHs.
Materials and Methods
Sample Collection
Using Zhongshan Park as the central sampling location, seven sampling sites were selected, including central urban (Zhongshan Park-ZSP), suburban (Tangqiao-TQ, Zhoupu-ZP, Huinan-HN, Jiuting-JT, and Songjiang University Town-SJUT), and rural (Shengang-SG) sites (Fig.1). In addition, samples of PM2.5 and PM10 under haze (ECNU(H)) and non-haze (ECNU(NH)) weather conditions were collected at East China Normal University (ECNU). Two total suspended particulate (TSP) integrated samplers (Laoying 2050, Qingdao Laoying, China) were used to collect PM2.5 and PM10 samples between 8:00 a.m. and 6:00 p.m. using the process developed by Wang et al. [22]. The sampling data and meteorological parameters are shown in Table 1. To collect the organic film, purified low-dust wiping paper stained with methylene chloride (Kimwipes, Kimberly Clark, USA) was used to wipe glass surfaces. The collected samples were wrapped in aluminum foil in a self-sealing bag. The complete collection process is described by Yu et al. [23]. In order to discuss the condensation and distribution process of PAHs between PM and organic film, samples of PM and organic film were collected simultaneously at each sampling site.
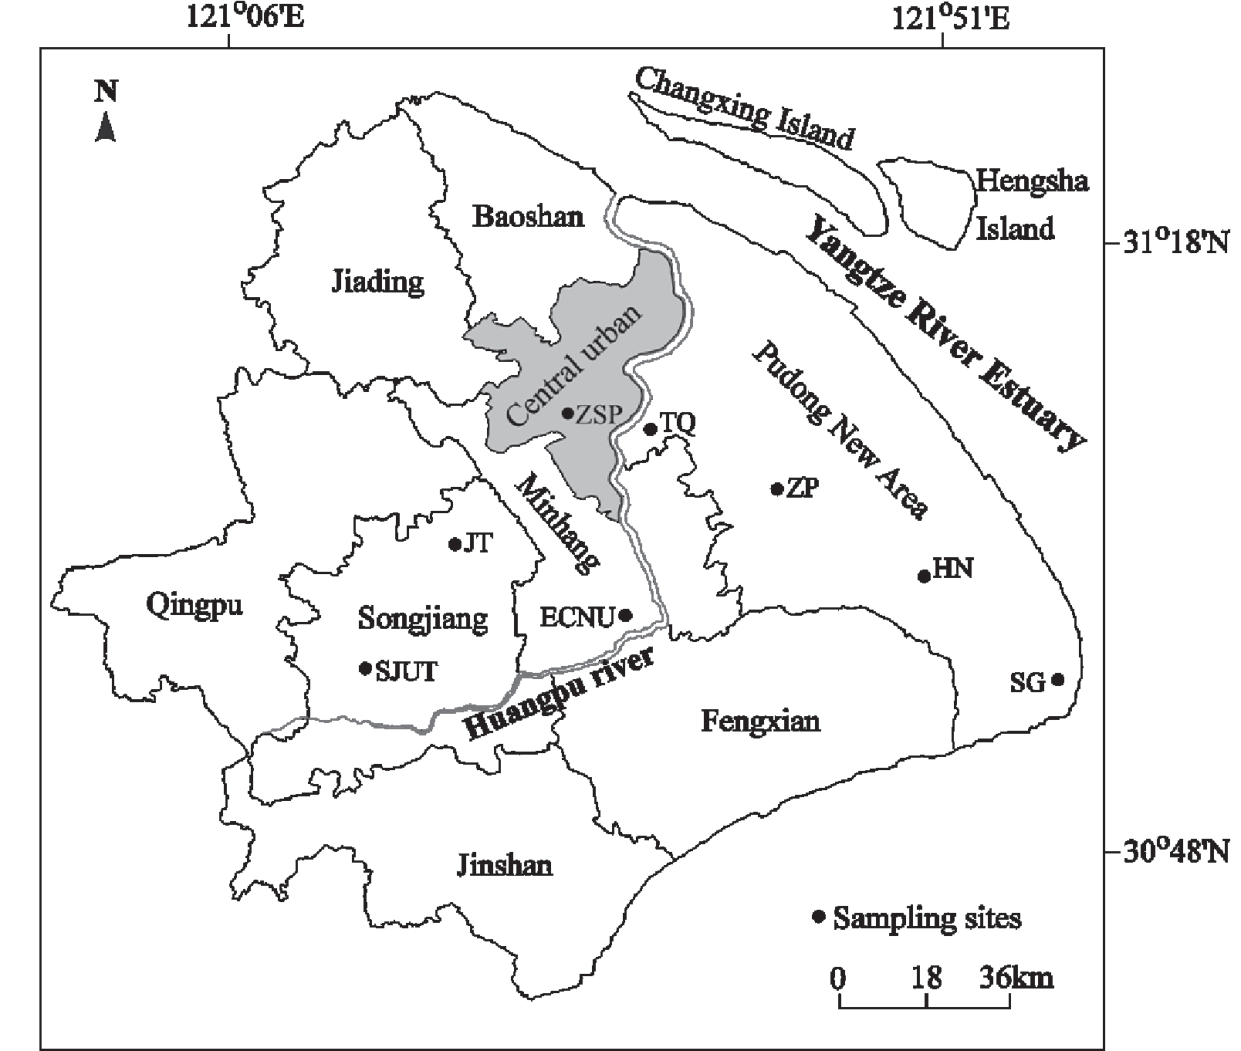
Table 1.
Sampling data and meteorological parameters.
Sample Pretreatment and Instrument Analysis
The PAH extraction procedure used in this study was modified from the procedure described by Yu et al. [23]. The weighed samples (organic film/PM2.5/PM10), copper powder (3g), and anhydrous sodium sulfate (5g) were filled with deuterated internal standards (naphthalene-d8, acenaphthene-d10, phenanthrene-d10, chrysene-d12, and perylene-d12) in the filter paper tank (Dr. Ehrenstorfer GmbH, Germany). A 120 mL mixture of acetone and methylene chloride (volume ratio = 1:1) was prepared. Continuous reflux extraction was performed for 24 hours (4 times/hour) using a Soxhlet extractor. The extraction solution was rotated and evaporated to 1 mL, and the solvent was replaced with n-hexane. Impurities were removed using a silica-alumina chromatography column (volume ratio = 2:1, wet filling), and alkanes and aromatic hydrocarbon components were eluted using n-hexane (15 mL) and mixture solvent (70 mL; volume ratio of dichloromet hane and n-hexane = 3:7). The aromatic hydrocarbon components were evaporated to 1 mL for instrumental analysis.
Gas chromatography-mass spectrometry (GC-MS, Agilent, 7890A/5975C, Agilent Technologies Co. Ltd., USA) was used to detect 16 PAHs(naphthalene(Nap), acenaphthylene(Acy), acenaphthene(Ace), fluorene(Fluo), phenanthrene(Phe), anthracene (An), fluoranthene(Fl), pyrene(Pyr), benzo[a]anthracene(BaA), chrysene(Chry), benzo[b]fluor anthene(B[b]F), benzo[k] fluoranthene(B[k]F), benzo[a]pyrene(BaP), indeno[1,2,3- cd]pyrene (InP), dibenz[a,h]anthracene(DahA) and benzo[ghi]perylene(BghiP)) that are priority controlled by the USEPA. B[b]F and B[k]F were calculated together as B[b+k]F because their peaks could not be identified separately in the chromatographic analysis. The chromatographic column was a DB-5 polysiloxane polymer column (30 m × 0.25 mm × 0.25 μm). The temperature was held at 55ºC for 2 min to heat the instrument. The temperature was then increased at 20ºC/min to 280ºC, followed by 10ºC/min to 310ºC. The carrier gas consisted of high-purity helium; the flow rate was 1 mL/min, and SIM scanning was used.
Quality Assurance and Quality Control
Nap and Phe were detected in some field blank samples (less than 3% of the actual sample content). No PAHs were detected in the method blank, and the recovery rate of the 16 PAHs was 71.1-110%. The recovery rates of the deuterated internal standards Nap-d8, Ace-d10, Phe-d10, Chry-d12, and Per-d12 were 79.5-94.6%, 78.4-95.7%, 75.4-98.1%, 78.4-106.2%, and 79.5-101.6%, respectively.
Data Processing and Mapping
The mass concentration of PAHs on the glass surface is calculated as follows: Area - normalized mass concentration = C/A(The unit is ng/m2, C is the average mass concentration of 2 samples per sampling site, and A is the sampling area). The Freehand and Originpro 2022 software were used to draw the graphs.
Table 2.
Concentrations and ratios of atmospheric particulate matter (mg/m3) and PAHs (ng/m3).
Results and Discussion
Concentration Characteristics
As shown in Table 2, with the exception of ECNU(H), the mass concentration of PM2.5 ranged from 6.92 to 15.75 mg/m3, and the mass concentration of PM10 ranged from 37.98 to 89.50 mg/m3. Among the sample sites, the PM2.5 mass concentration was lowest at ECNU(NH) (6.92 mg/m3) and highest at ZP (15.75 mg/m3). The PM10 mass concentration was lowest at ZSP (37.98 mg/m3) and highest at SG (89.50 mg/m3). The SG samples were collected under foggy weather conditions. High humidity air increases the volume of aerosol particles, significantly reduces the visibility, and further aggravates the pollution. This cumulative effect of significantly increases the concentration of PM10. The proportion of PM2.5/PM10 at each sampling point ranged from 12.9% to 35.6%, indicating that under good air quality conditions, 2.5-10 μm particles are the most abundant particle sizes in the atmosphere of Shanghai. In contrast, during haze weather, the mass concentration of PM2.5 at ECNU(H) was 224.44 mg/m3, while PM10 was 248.99 mg/m3; the mass concentration ratio of PM2.5/PM10 was as high as 90.1%, indicating that during haze weather, the particulate matter in Shanghai’s atmosphere is generally less than 2.5 μm.
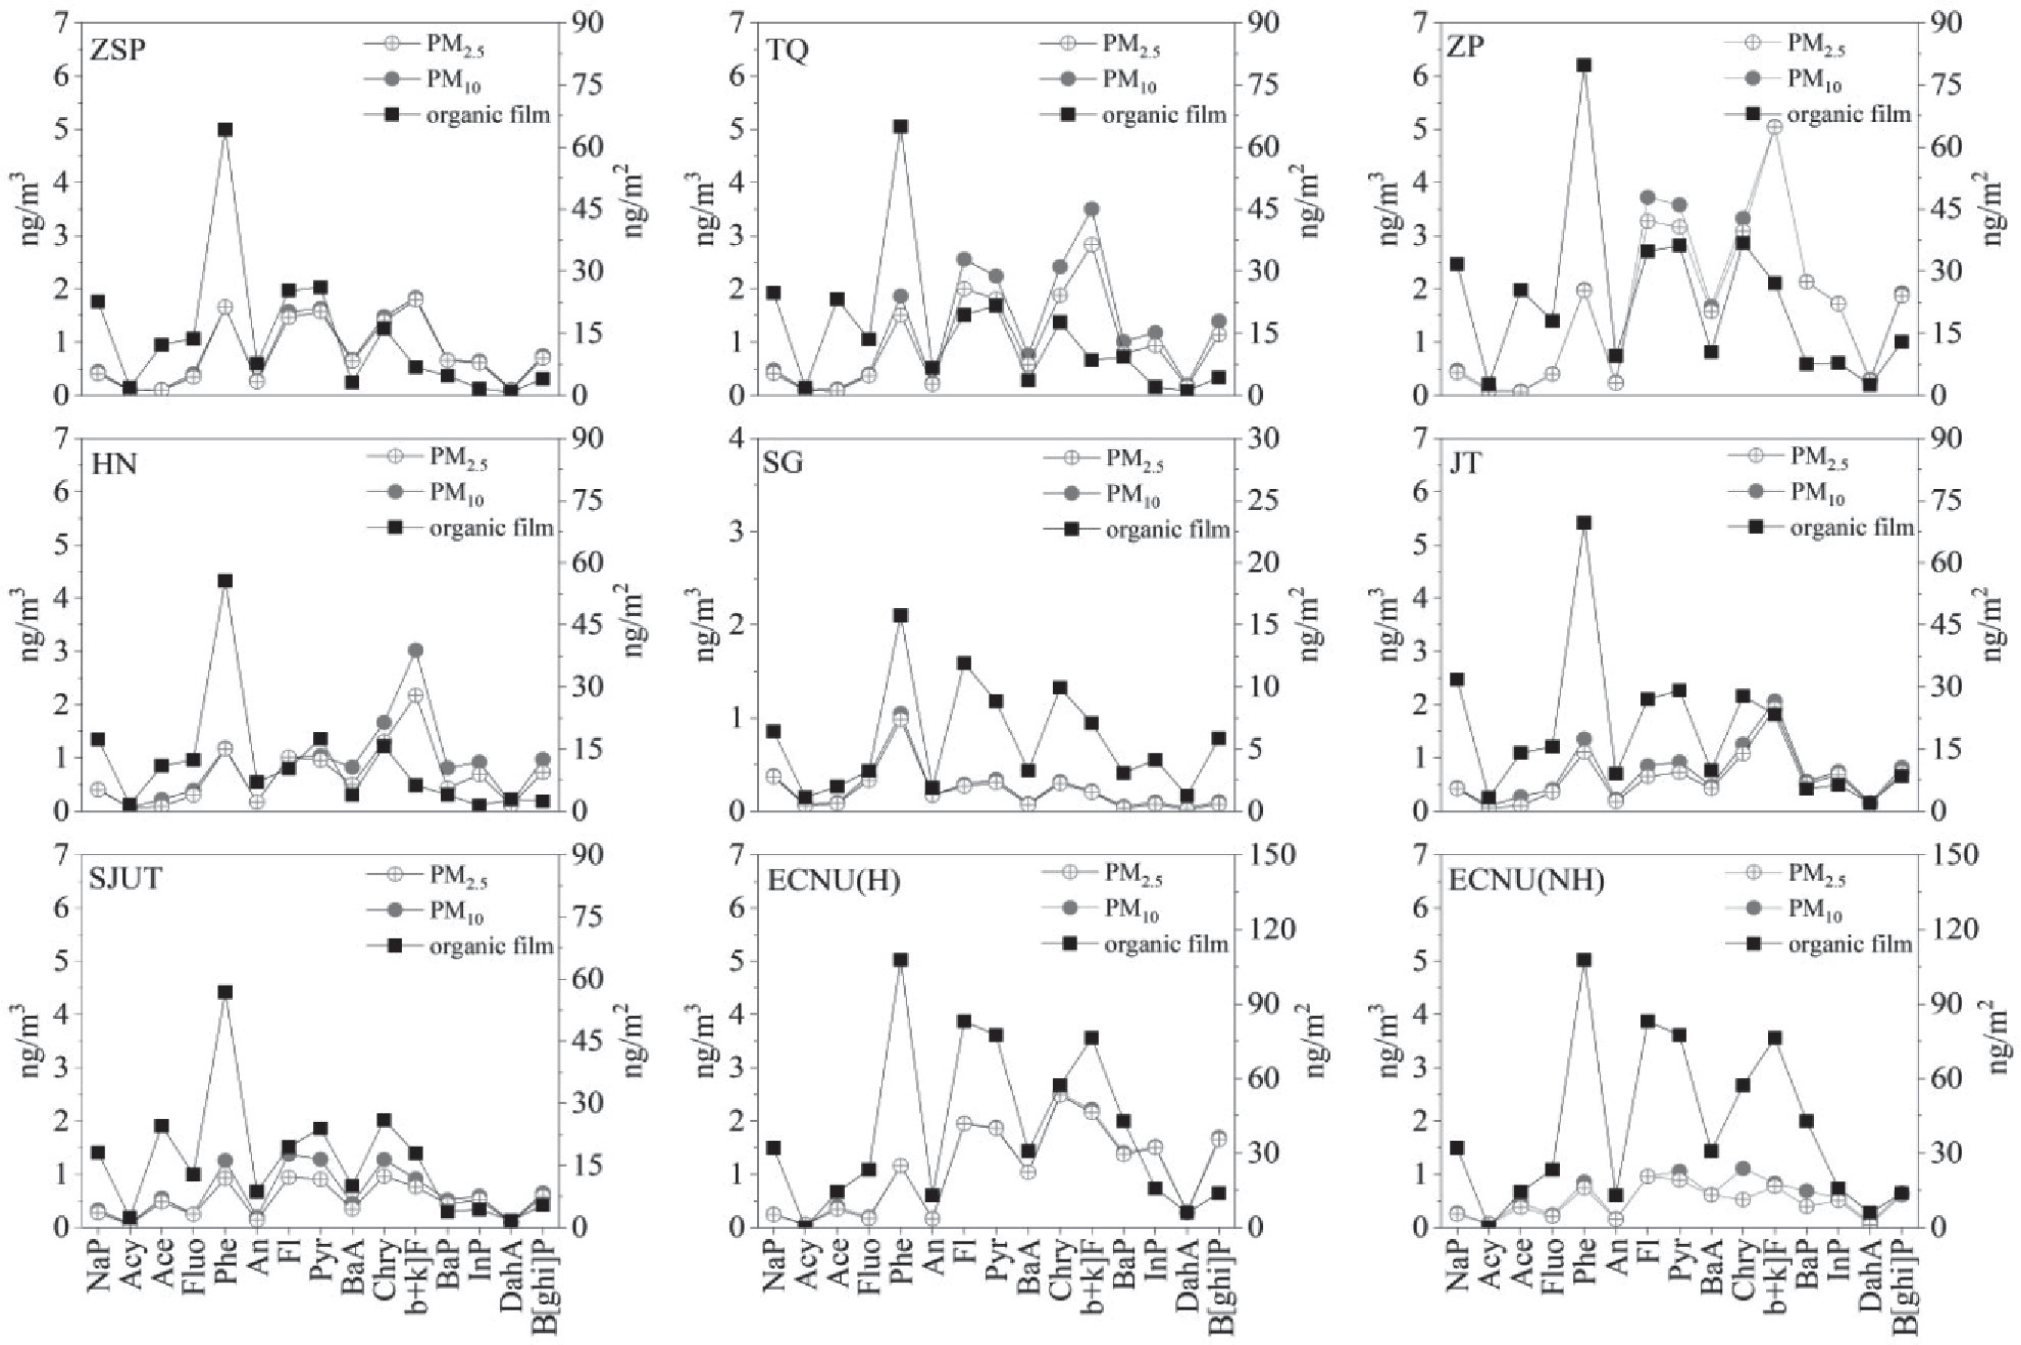
Under good air quality conditions, the mass concentration of PAHs in PM2.5 was 3.5-25.5 ng/m3, and the mass concentration of PAHs in PM10 was 3.6-26.7 ng/m3. The highest mass concentrations of PAHs in PM2.5 and PM10 (25.5 ng/m3 and 26.7 ng/m3, respectively) were recorded at ZP, while the lowest mass concentrations were recorded at SG (3.5 ng/m3 and 3.6 ng/m3, respectively). The mass concentrations of PAHs in PM2.5 and PM10 in haze weather were 16.6 ng/m3 and 16.8 ng/m3, respectively. The mass concentration ratio of PAHs in PM2.5 and PM10 was as high as 77.6-98.8%, indicating that PAHs are more likely to adsorb on PM2.5 than on PM10, which is consistent with the studies of Wang et al. [22]. Environmental monitoring and management departments should pay special attention to PM2.5 emissions because PM2.5-bound PAHs easily enter the human respiratory system, including the lungs, causing substantial harm to the human body [1]. The normalized mass concentration of PAHs on glass surfaces was 85.9-592.9 ng/m2. The highest concentrations were recorded at ECNU (592.9 ng/m2) and ZP (343.8 ng/m2); the lowest concentration was recorded at SG (85.9 ng/m2). ECNU is located in Minhang District, close to the Wujing Town thermal power plant and the Huangpu River freight terminal. Emissions from coal-fired power plants and passing ships, the main sources of PAHs in the organic film, adsorb easily onto glass surfaces. In contrast, the SG sampling site is located in the undeveloped Nanhuizui area of Shanghai, where agricultural production is the main industry and where there is no large pollutant emission source. The mass concentration characteristics of specific monomeric PAHs are shown in Table 3 and Fig. 2.
Compositional Characteristics
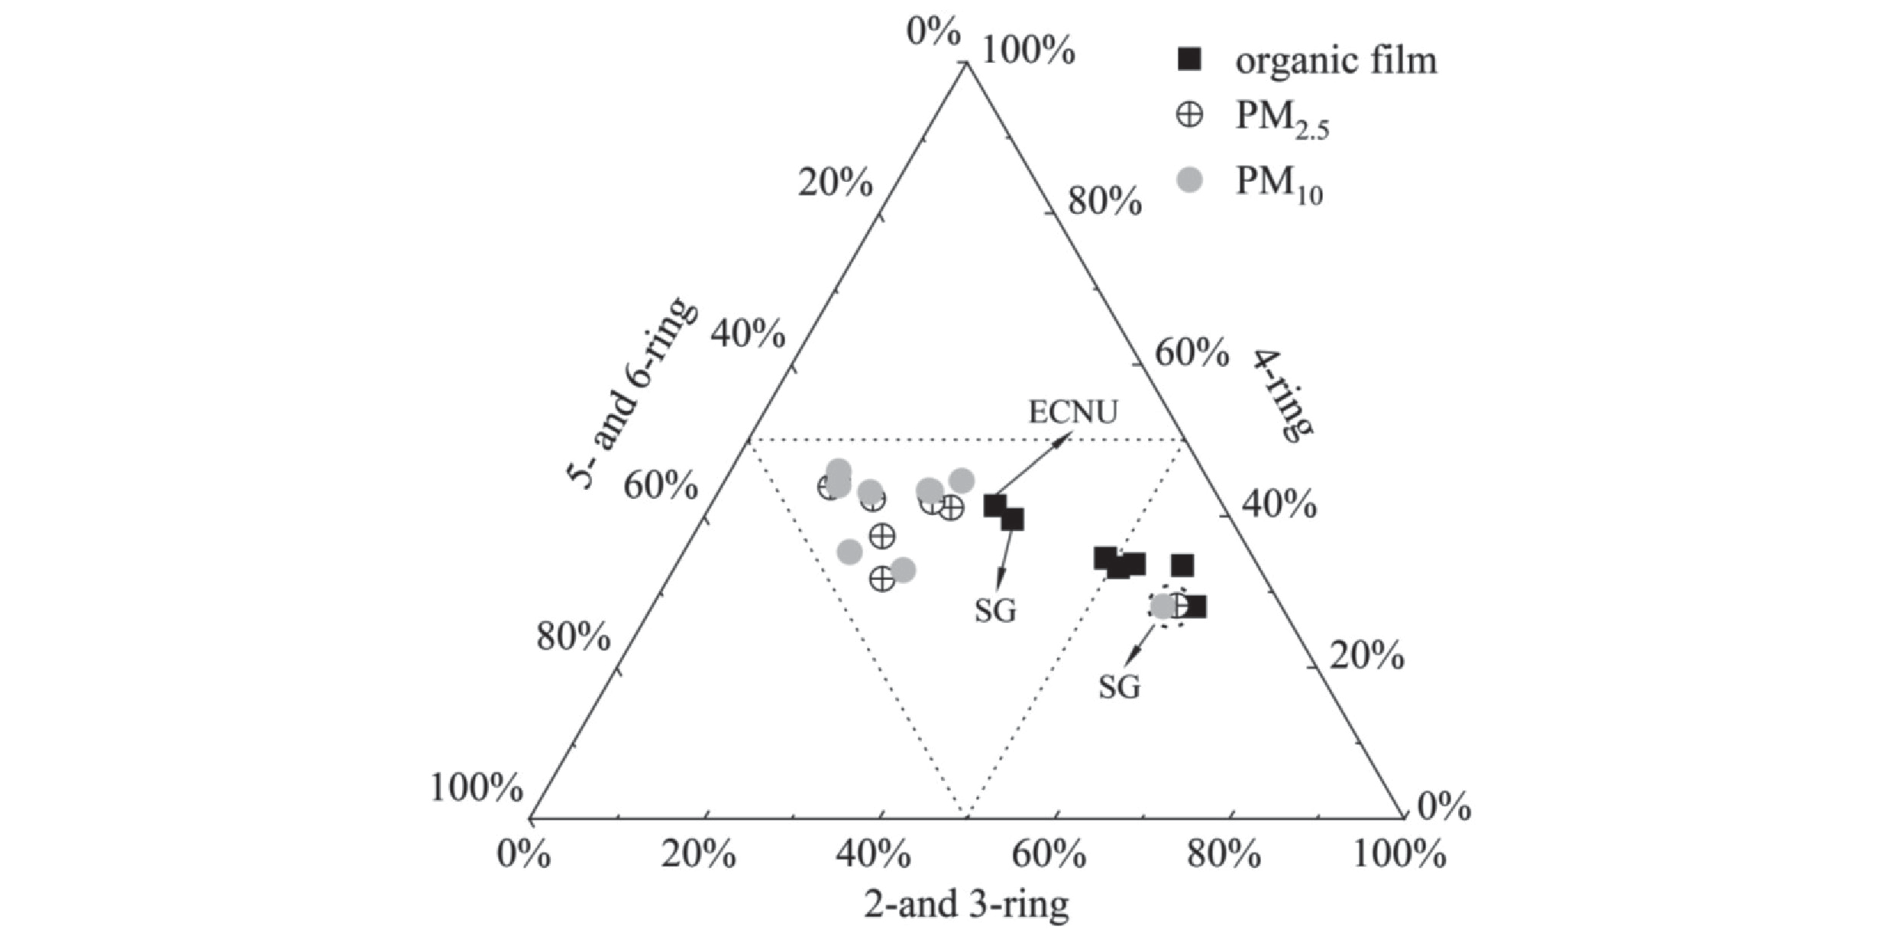
PAHs are a class of semi-volatile organic compounds. Due to the small particle-gas distribution coefficient of low molecular weight PAHs, they are easily distributed in the gas phase and can condense and adsorb on glass surfaces. In contrast, high molecular weight PAHs have a larger particle-gas distribution coefficient and are more inclined to be distributed in PM. The compositional characteristics of PM2.5- and PM10-bound PAHs and organic film are shown in Fig.3. Except at sample site SG, the most abundant PAHs in PM2.5 and PM10 are 4-ring PAHs (PM2.5: 31.0%-44.4%, with an average of 40.5%; PM10: 33.6%-46.1%, with an average of 41.8%), followed by 5- and 6-ring PAHs (PM2.5: 31.2%-43.8%, with an average of 38.3%; PM10: 31.9%-46.1%, with an average of 38.0%). The least abundant PAHs are 2- and 3-ring PAHs (PM2.5: 12.6%-27.7%, with an average of 21.2%; PM10: 12.4%-27.0%, with an average of 20.2%). The geographical location of SG differs from that of the other sampling sites, and there are differences in the sources and types of pollutants. At SG, 2- and 3-ring PAHs are most abundant (PM2.5: 60.5%, PM10: 57.9%), followed by 4-ring PAHs (PM2.5: 27.4%, PM10: 28.8%). The 5- and 6-ring PAHs are least abundant (PM2.5: 12.1%, PM10: 13.3%). The most abundant PAHs in organic film are 2- and 3-ring PAHs (32.0%–62.1%, with an average of 49.9%), followed by 4-ring PAHs (28.0%-41.9%, with an average of 34.1%), and 5- and 6-ring PAHs (8.6%-26.1%, with an average of 16%). As shown in Fig. 3, the compositional characteristics of PM2.5- and PM10-bound PAHs at SG differ greatly from those at other sampling sites but are similar to the composition of PAHs in organic film. Further research on the composition of PAHs is needed.
Table 3.
Concentrations of polycyclic aromatic hydrocarbons in atmospheric particulate matter (ng/m3) and organic film (ng/m2)
Gas-Film Partitioning
Condensation and distribution processes control the migration and fate of organic pollutants in environmental media [24]. Mackay described the distribution processes of different soluble compounds between multiple interfaces and concluded that organic pollutants adsorb to glass surfaces through condensation to form an organic loading layer. The process of distribution between the air-organic film interface can then occur. Octanol, a substitute for the organic phase in the environment, can be used to describe the distribution characteristics of organic pollutants between organic film and the atmosphere via the octanol-air partition coefficient (KOA). Harner tested the accuracy of KOA and predicted the distribution characteristics of organic pollutants between the gas phase and the particle phase [25]. In addition, KOA can be used to predict the distribution of organic pollutants between the gas-soil and gas-vegetation system interfaces [26].
The KOA is calculated using the formula:
where CO is the concentration of octanol compounds, CA is the concentration of pollutants in the atmosphere, KOW is the octanol-water distribution coefficient, KAW is the infinite air-water distribution coefficient equal to H/(RT), H is the Henry constant, R is the ideal gas constant, and T is the absolute temperature.
The experimentally deduced organic film-air distribution coefficient (KFA) is calculated using the formula:
where FC is the concentration of the organic film (unit area concentration/volume organic film thickness (Ft), Ft = M(mg/m2)×109(nm/m)/1.7×109 (mg/m3), M is area - normalized mass concentration, 1.7×10⁹(mg/m3) is the density of aerosol.) and PC is the geometric mean concentration of PM2.5 and PM10.
KFA describes the balanced distribution of organic pollutants in organic film and the atmosphere; it is meaningful only in that the atmospheric-organic film balance is achieved because organic film is very thin in nature, allowing the rapid attainment of equilibrium [16]. Whether organic pollutants have reached an equilibrium between the organic film and the atmosphere can be assessed by comparing logKFA and logKOA [27]. In this study, the logKFA (3% OM) and logKFA (20% OM) of Nap, Acy, Ace, Fhe, Phe, An, Fl, Pyr, and Chry are more than one order of magnitude higher than the logKOA in the literature (Table 4), which indicates that these monomer PAHs reach a dynamic equilibrium between the organic film and PM. These results also imply that when the concentration of PAHs in the urban atmosphere decreases over a period of time, the concentration in the organic film also decreases accordingly [28]. This process could also explain Gustafson and Dickhut’s observation that PAHs can evaporate into the atmosphere from the surface of the contaminated impervious layer with increasing temperature [29].
Source Analysis
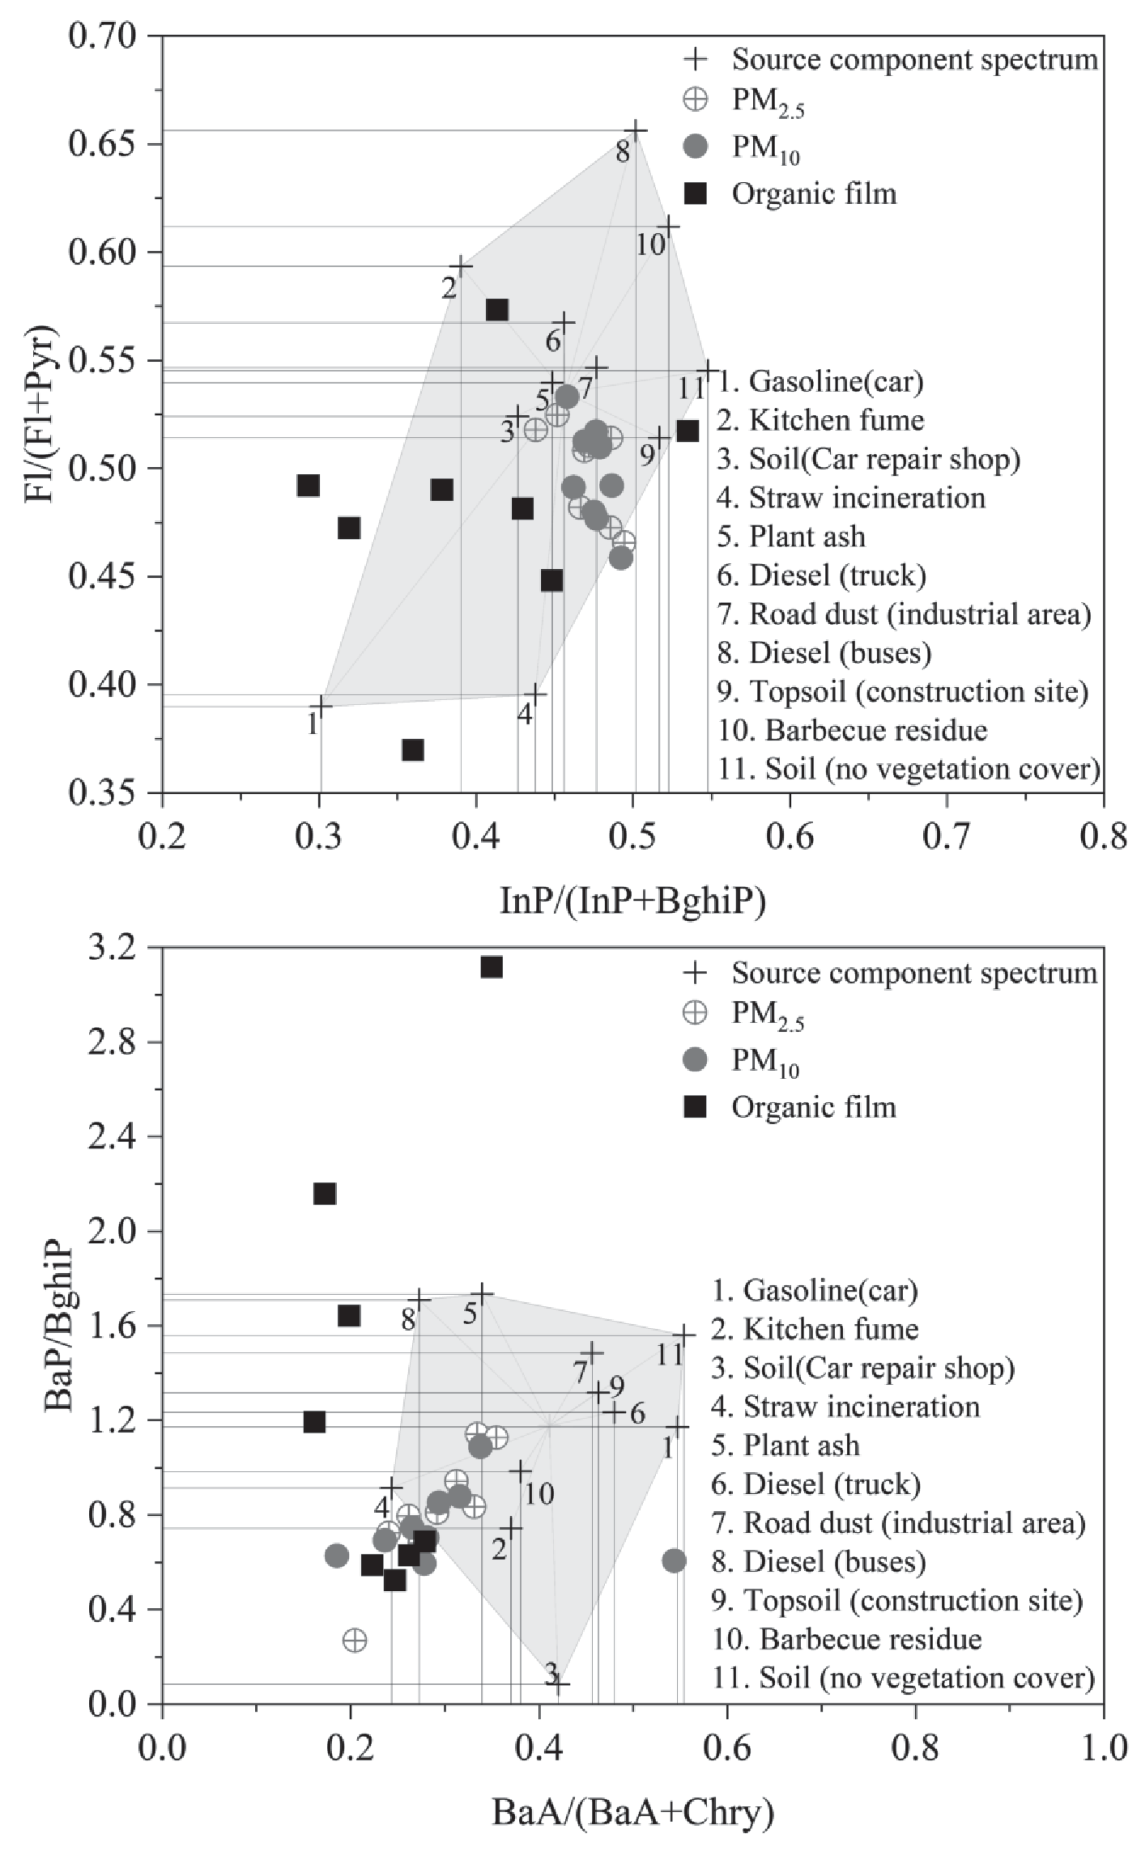
The composition of PAHs in the environmental medium varies due to different pollution sources [30,31]. Therefore, Fl/(Fl + Pyr), InP/(InP + BghP), BaP/BghP, and BaA/(BaA + Chry), which have relatively stable characteristics, are often used as indicators to determine PAH sources. Previous studies have shown that an InP/ (InP + BghP) ratio between 0.2 and 0.5 indicates that oil combustion is the primary PAH source; a ratio greater than 0.5 indicates that coal, grass, and wood combustion are the sources. A Fl/(Fl + Pyr) ratio of less than 0.4 indicates that oil emission is the primary PAH source. When the ratio is between 0.4 and 0.5, liquid fuel combustion is the primary PAH source, and when it is greater than 0.5, biomass and coal combustion is the primary PAH source. A BaA/(BaA + Chry) ratio of less than 0.2 indicates that the PAH source is oil emissions. A ratio of between 0.2 and 0.35 indicates a mixed oil and liquid fuel combustion sources, and a ratio of greater than 0.35 indicates a biomass and coal combustion source. When the BaP/BghP ratio is less than 0.6, non-motor vehicle emissions are the primary PAH source; when it is greater than 0.6, vehicle emissions represent the primary PAH source. As shown in Fig.4, in this study, the ratio of InP/(InP + BghP) in organic film, PM2.5, and PM10 is generally between 0.2 and 0.5, while the ratio of Fl/(Fl + Pyr) is generally between 0.4 and 0.5, indicating that the PAH source is related to the combustion of liquid fuels, including the combustion of petroleum substances such as diesel and gasoline. The ratio of BaA/(BaA + Chry) is mainly between 0.2 and 0.35, and the ratio of BaP/BghP is generally greater than 0.6, indicating that the PAHs are derived primarily from mixed petroleum and liquid fuel sources, especially motor vehicle emissions. In conclusion, the PAHs in the organic film, PM2.5, and PM10 are derived from petroleum combustion, and the contribution of automobile exhaust is obvious.
Due to notable differences in environmental parameters in different study areas, the degradation rate of PAHs in the migration process may also differ; thus, there may be some errors in source determination results obtained by referring to the isomer ratio in other studies. In this study, the source component spectrum data of PAHs in Shanghai were used to determine PAH sources. As shown in Fig. 4, the InP/(InP + BghP) ratios of PM2.5 and PM10 are relatively close to source component spectra 3, 5, 6, 7, and 8, which represent diesel vehicle exhaust (buses and trucks), plant ash, industrial road dust, and exposed garage topsoil. The ratios of Fl/(Fl + Pyr) are relatively close to spectra 3, 5, and 9, which represent exposed garage topsoil, plant ash, industrial road dust, and construction site topsoil. These ratios indicate that PAHs in Shanghai are mainly generated from automobile exhaust and dust sources. The BaA/ (BaA + Chry) ratios are close to those of 4, 5, and 8, which represent the compositions of plant ash, burning straw, and diesel vehicle exhaust (buses); the BaP/BghP ratio is close to 2, 4, 6 and 10, which represent the compositions of kitchen lampblack, plant ash, barbecue residues, and diesel vehicle exhaust (trucks). These results indicate that diesel vehicle exhaust, domestic emissions (kitchen lampblack and barbecue residues), and field straw and vegetation incineration contribute greatly to PAHs. The above analysis shows that PAHs in PM2.5 and PM10 primarily come from automobile exhaust (diesel vehicles), fugitive dust (road dust, bare surface, and vegetation/straw burning) and domestic emissions (kitchen lampblack and barbecue residues). The isomer ratio of PAHs in organic film is dispersed, and there is a significant difference compared to PM. It is possible that a strong photodegradation process occurs on the glass surface but not on the other media. The degradation rate of some monomer PAHs in organic film (such as BaA) is relatively fast. The source analysis of PAHs in organic film should be further studied using other methods..
Table 4.
Comparison of calculated KFA with literature values of KOA.
Conclusions
In this study, we measured the mass concentration of PAHs in PM2.5, PM10, and organic film. The results show that the mass concentrations, compositional characteristics, and PAH sources in PM2.5, PM10, and organic film vary substantially in different sampling areas. Under normal weather conditions, 2.5-10 μm particles are particularly abundant in the atmosphere of Shanghai; during haze periods, less than or equal to 2.5 μm particles are more abundant. Organic film tends to adsorb 2- and 3-ring PAHs, while PM2.5 and PM10 are more enriched in 4-ring PAHs. Nap, Acy, Ace, Fluo, Phe, An, Fl, Pyr, and Chry quickly reach a dynamic equilibrium between the organic film and the atmosphere but rapidly adjust when the environment (e.g., temperature and light) changes. PAHs in PM2.5, PM10, and organic film are derived primarily from automobile exhaust, ground dust, and domestic emission sources; however, due to strong photodegradation on glass surfaces, source analyses of PAHs in organic film need to be studied more comprehensively.

