


Introduction
Chili is a healthy spice crop belonging to the family Solanaceae, subfamily Solanoideae and tribe Capsiceae. It is imperatively used in almost every cuisine in Bangladesh and other South Asian countries due to its pungent taste, attractive color, and flavor [1]. Besides its culinary use, it has nutritional and medicinal properties [2]. Chili is a great source of dietary phytochemicals, such as capsaicin, phenolics, flavonoids, carotenoids, oleoresin, chlorophyll, saponins, cyanogenic glycosides, stilbenes, tannins, nitrogenous compounds (alkaloids, amines, betalains), terpenoids, and other endogenous metabolites [3]. Capsaicin (C18H2703) is the main nutritional substance found in chili. It is a crystalline acrid volatile alkaloid compound that can decrease free radicals [4-6]. Capsaicin can reduce the risk of obesity and type II diabetes; it prevents sinusitis, stomach ulcers, and the spread of prostate cancer. It is also useful for the remission of headaches and physical pain and for reducing the risk of cardiovascular diseases and arthritis [7,8]. Chili contains a large amount of vitamin C (ascorbic acid) and other vitamins, particularly vitamin A, vitamin B3 (niacin), vitamin B6 (pyridoxine), vitamin B9 (folate), vitamin E (α-Tocopherol), and vitamin K. It also contains a range of minerals, namely K, Ca, Mg, Na, P, Fe, Cu, Mn, and Zn [9].
Though it has many nutritional and medicinal properties, very few studies have been conducted to improve its quality traits. Knowing the nature and extent of genetic variability among the germplasm is crucial to help identify desirable parents for an efficient breeding program. A broad range of genetic variability exists in the chili landraces that are currently cultivated in Bangladesh. The desired nutritional traits of variable indigenous and exotic genotypes must be combined in a single genotype to develop varieties of increased nutritional quality. In Bangladesh, few attempts have been made to establish chili varieties, and their breeding attempt for nutritionally rich chili varieties is lacking. To date, only six chili varieties have been developed in Bangladesh. Among these six varieties, four varieties, namely BARI Morich-1, BARI Morich-2, BARI Morich-3, and BARI Mistimorich-1, were released by Bangladesh Agricultural Research Institute [10]; one chili variety, BU Capsicum 1, has been developed by Bangabandhu Sheikh Mujibur Rahman Agricultural University [11]; and one chili variety, Binamorich-1, has been introduced by Bangladesh Institute of Nuclear Agriculture [12]. Of the six varieties, only Binamorich-1 is rich in vitamins A and C. This study aimed to exploit valuable genetic constituents of six diverse parents to improve nutritional phytochemicals by selecting desirable parents and superior F1 hybrids based on combining ability and the magnitude of both mid-parent and better-parent heterosis.
Experimental
Plant materials
The genetic variability of twenty diverse chili genotypes was studied, and based on the desired traits, six genotypes were selected [9]. These six genotypes were used as parents (P1: Red Chili, P2: Chili Padi, P3: PLP-2s, P4: Chili Japan, P5: Morich-8, P6: BU Capsicum 1) for crossing to produce F1s (6x6 half diallel population) by following Griffing’s diallel Method II [13]. In our previous study in 2017, these six parents and fifteen F1 hybrids were used to study combining ability and heterosis for yield and yield-related characteristics [14]. This study collected samples from the same parents and fifteen F1 hybrids in the same year (2017) to study combining ability and heterosis for nutritional phytochemicals. Two nearly symmetrical mature fruits (green and red) were collected from five randomly selected chili plants from each genotype in three replications (six parents and fifteen hybrids). Part of the freshly harvested mature green fruits was transferred to the laboratory for phytochemical analysis. The rest of the harvested green fruits were stored at -20°C for further investigation, and these fruits were used within a week to avoid any chance of quality deterioration. Mature red fruits were oven-dried, ground, and stored in an airtight polythene bag for future use.
Biochemical Analysis for Nutritional Phytochemicals
Table 1.
Analysis of variance (ANOVA) for nutritional traits in a 6×6 half diallel population of chili.
[i] **significance at p < 0.01; The values presented in the parentheses are degrees of freedom. †CAP: Capsaicin content (%); AAC: Ascorbic acid content (mg/100g); AOC: Antioxidant capacity (µg/g FW); BCC: β - carotene content (mg/100g); Chl a: Chlorophyll a content (mg/g); Chl b: Chlorophyll b content (mg/g); TCC: Total carotenoid content (mg/g); TPC: Total phenolic content (µg/g FW); TFC: Total flavonoids content (µg/g FW); TAC: Total anthocyanin content (µg/g FW); K: Potassium content (%); Mg: Magnesium content (%); Ca: Calcium content (%); Na: Sodium content (%).
The capsaicin content (CAP) of chili was estimated by following the colorimetric method described by Das et al. [15] using a spectrophotometer (PD-303UV, APEL, Japan). The ascorbic acid content (AAC) was measured following the method provided by Oberbacher and Vines [16]. The antioxidant capacity (AOC) of chili fruit was measured by DPPH (1, 1-diphenyl-2-picrylhydrazyl) radical scavenging assay following the procedure described by Zellama et al. [17]. Total β-carotene content (BCC) was measured by following the method described by Prasad et al. [18] using a spectrophotometer (PD- 303UV, APEL, Japan). The chili samples for measuring total carotenoid content (TCC) and chlorophyll content (Chl a and Chl b) were prepared via the González-Cortés et al. [19] method. TCC, Chl a, and Chl b were quantified following the formulas provided by Aslam et al. [20]. Chili fruit’s total phenolic content (TPC) was determined by following the Folin-Ciocalteu method [17].
Total flavonoid content (TFC) was determined spectrophotometrically by following the method described by Sarkar et al. [21]. A calibration curve was prepared from the standards, and the TFC (μg/g fresh weight) was expressed as catechin equivalent. For measuring total anthocyanin content (TAC), the chili samples were prepared following the protocol described by Lim et al. [22]. TAC (μg/g fresh weight) was calculated as cyanidin- 3-O-glucoside equivalent using the absorbance and a molar extinction coefficient for anthocyanin at 530 nm of 30000 L-1M-1cm-1 [23]. Potassium (K), magnesium (Mg), calcium (Ca), and sodium (Na) contents were determined by following the procedures provided by Piper [24] using an atomic absorption spectrophotometer (Model 200-30, Hitachi, Japan).
Statistical Analysis
Computer software Statistical Tools for Agricultural Research (STAR) was used to analyze variance (ANOVA). Mean, standard error (SE), coefficient of variation (CV), and Tukey’s honest significant difference (HSD) for different nutritional phytochemicals were computed. Combining ability analysis was done by following the Diallel Method II Model I of Griffing [13] via the Diallel-R program in R software version 2.11.1. Griffing’s analysis was selected with the intention to determine the parents’ performance and relative contribution to the F1s, as determined by the general and specific combining abilities. The statistical model of Method II Model I of Griffing [13] for the combining ability analysis has been described below:
where, i,j = 1 …………… p (p = no. of parents)
k = 1 …………… b (b = no. of blocks/replications)
l = 1 …………… c (c = no. of observation in each plot)
xij is the mean of xij th genotype across k and l; u is the population mean; gi is the GCA effect; sij is the SCA effect such that Sij = Sji and eijkl is the environmental effect specific to ijkl th observation. Restrictions imposed are
The sum of squares (SS) was calculated as follows:
where SSg = sum of squares due to GCA
SSs = sum of squares due to SCA
Xi. = mean of the ith parent
xii = mean value of ith parent
X.. = mean of the
The effects were calculated as follows:
Standard errors of effects were calculated as follows:
Mid-parent heterosis and better-parent heterosis were computed for all the nutritional traits following the formulae described by Tyagi et al. [25].
Mid parent heterosis (MPH) =
where
Better parent heterosis (BPH) or heterobeltiosis
where
Table 2.
Analysis of variance (ANOVA) of combining ability for nutritional traits in a 6×6 half diallel population of chili.
[i] **significance at p < 0.01. †GCA: General combining ability; SCA: Specific combining ability. ‡CAP: Capsaicin content (%); AAC: Ascorbic acid content (mg/100g); AOC: Antioxidant capacity (µg/g FW); BCC: β - carotene content (mg/100g); Chl a: Chlorophyll a content (mg/g); Chl b: Chlorophyll b content (mg/g); TCC: Total carotenoid content (mg/g); TPC: Total phenolic content (µg/g FW); K: Potassium content (%); Na: Sodium content (%). §σ2g: General combining ability variance; σ2s: Specific combining ability variance; (H1/D)0.5: Degree of dominance; h2n: Heritability in narrow sense.
Table 3.
General combining ability (GCA) effects for nutritional traits in 6×6 half diallel population of chili.
[i] * and ** significance at 5% and 1% levels, respectively. †CAP: Capsaicin content (%); AAC: Ascorbic acid content (mg/100g); AOC: Antioxidant capacity (µg/g FW); BCC: β - carotene content (mg/100g); Chl a: Chlorophyll a content (mg/g); Chl b: Chlorophyll b content (mg/g); TCC: Total carotenoid content (mg/g); TPC: Total phenolic contents (µg/g FW); K: Potassium content (%); Na: Sodium content (%). P1: Red Chili, P2: Chili Padi, P3: PLP-2s, P4: Chili Japan, P5: Morich-8, P6: BU Capsicum 1.
Results
Genetic Parameters Analysis for Nutritional Traits
Simple ANOVA indicated that variations attributable to the parents and F1s were significant for all the nutritional phytochemicals except TAC, TFC, Ca, and Mg contents (Table 1). The subsequent analyses did not include the non-significant traits (Table 1). The combining ability analysis indicated that variation attributable to GCA and SCA was highly significant for the nutritional phytochemicals. General combining ability variance (σ2g) was highest for TPC, which indicated the predominance of additive gene effects for this trait (Table 2). The high specific combining ability variance (σ2s) for AAC, AOC, BCC, and TPC revealed that non-additive gene effects played a significant role in the inheritance of these traits. σ2g was lower than σ2s for all the phytochemicals studied, and the lower σ2g/σ2s ratio (<1) was also found for all the nutritional phytochemicals that revealed non-additive gene action for all the nutritional characters. The (H1/D)0.5 ratio indicates that the degree of dominance was greater than zero but less than one for all the nutritional traits except CAP (1.32) and TPC (1.11), and the heritability in the narrow sense (h2n) was high (>0.5) for all the traits except CAP (0.33) and TPC (0.45) (Table 2).
Analysis of Combining Ability for Nutritional Traits
The estimation of GCA effects revealed that the parents P3, P4, and P5 showed the highest and most significant positive value for CAP among the parents (Table 3). The most significant positive GCA effects for AAC and BCC were found in parent P3 followed by parent P6. For AOC, the most substantial positive GCA effects were observed in parent P1 followed by parent P3. The most significant positive GCA effects were observed in the parent P2 for Chl a and Chl b. For TCC, parent P3 showed the highest GCA effects, followed by parent P2. Parent P5 had the most significant positive GCA effects for TPC, followed by parents P4, P6, and P3. The most substantial positive GCA effects for K were recorded in parent P4, parents P6, and P1; parent P2 showed the highest GCA effect for Na followed by parents P4 and P6.
Table 4.
Specific combining (SCA) ability effects for nutritional traits in 6×6 half diallel population of chili.
[i] * and ** significance at 5% and 1% levels, respectively. †CAP: Capsaicin content (%); AAC: Ascorbic acid content (mg/100g); AOC: Antioxidant capacity (µg/g FW); BCC: β - carotene content (mg/100g); Chl a: Chlorophyll a content (mg/g); Chl b: Chlorophyll b content (mg/g); TCC: Total carotenoid content (mg/g); TPC: Total phenolic contents (µg/g FW); K: Potassium content (%); Na: Sodium content (%). P1: Red Chili, P2: Chili Padi, P3: PLP-2s, P4: Chili Japan, P5: Morich-8, P6: BU Capsicum 1.
The estimation of SCA (Table 4) of F1 hybrids for nutritional phytochemicals revealed that for CAP, the hybrids P3×P5 exhibited the highest SCA following the hybrids P3×P4, P4×P6, P1×P4, and P3×P6. For AAC, the hybrid P1×P2 had maximum SCA followed by P3×P4, P4×P6, P3×P6, and P3×P5. The hybrid P3×P6 exhibited the maximum and significant positive SCA for AOC, followed by the hybrids P1×P5, P2×P4, and P4×P5. The higher SCA for BCC was found in the hybrids P4×P6 and P3×P6. Besides significant positive SCA, the hybrids P2×P6 contained the highest amount of Chl a followed by P3×P4 and P3×P5. In the case of Chl b, the F1 P2×P6 indicated the maximum significant and positive SCA. For TCC, the higher significant positive SCA were recorded in P3×P5, P1×P2, P3×P4, P2×P6, and P3×P6. The highest significant positive SCA TPC was observed in hybrids P3×P5, followed by P1×P6 and P3×P6. The hybrids P4×P5 showed the highest significant positive SCA for K, while the most effective positive SCA for Na was observed in the hybrid P1×P3.
Estimation of Heterosis for Nutritional Traits
The analysis of mean performance revealed the existence of suitable genetic variation among the six parental genotypes and fifteen F1s for the nutritional traits that can be exploited through heterosis breeding (Table 5). The superiority of F1 hybrids or the mid-parent (average or relative) heterosis and better-parent heterosis (heterobeltiosis) for nutritional phytochemicals are presented in Table 6 and Figures 1, 2 & 3, respectively.
The mid-parent heterosis (%) revealed all the F1 hybrids except P2×P5, P2×P6, P4×P5, and P5×P6 had significant and positive relative heterosis for CAP. The higher significance and positive mid-parent heterosis for AAC were observed in the hybrids P1×P2, P4×P6, P3×P6, and P3×P4. The hybrids P1×P5 and P3×P6 exhibited significant positive relative heterosis for AOC, and the hybrids P4×P6, P3×P6, P1×P2, and P2×P5 had significant positive relative heterosis for BCC. The mid-parent heterosis for both Chl a and Chl b was positive and significant for the hybrids P2×P6, P3×P4, P3×P5, and P4×P6. The hybrids P3×P5, P3×P6, and P1×P2 showed higher significant relative heterosis for TCC, and the hybrids P3×P5, P1×P6, and P3×P6 exhibited significant positive relative heterosis for TPC. For K, the hybrids P4×P5, P3×P5, and P4×P6 expressed higher significant positive relative heterosis, and all the F1’s figured significant positive relative heterosis in the case of Na except P1×P2, P2×P4, P2×P5, P4×P5, and P4×P6 (Table 6).
Fig. 1.
Percentage of heterobeltiosis for CAP: Capsaicin content (%); AAC: Ascorbic acid content (mg/100g); AOC: Antioxidant capacity (µg/g FW). Non-significant data were marked by ‘N’ and other data were significant at P<0.01. P1: Red Chili, P2: Chili Padi, P3: PLP-2s, P4: Chili Japan, P5: Morich-8, P6: BU Capsicum 1.
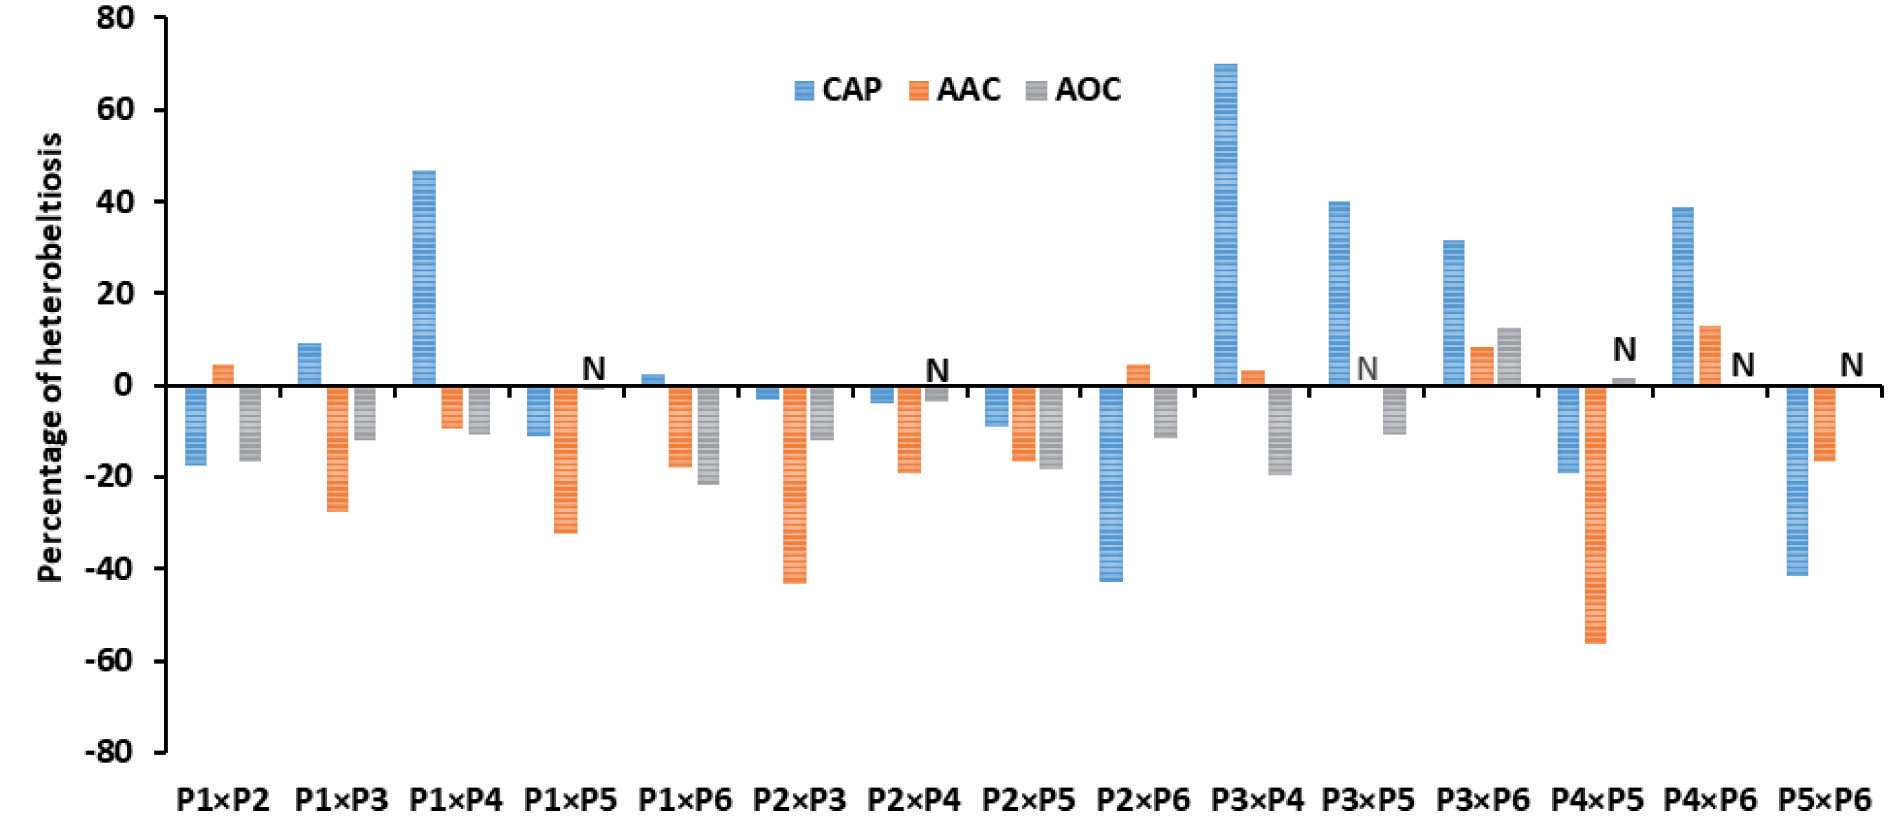
Fig. 2.
Percentage of heterobeltiosis for BCC: β-carotene content (mg/100g); Chl a: Chlorophyll a content (mg/g); Chl b: Chlorophyll b content (mg/g). All the data were significant at P<0.01. P1: Red Chili, P2: Chili Padi, P3: PLP-2s, P4: Chili Japan, P5: Morich-8, P6: BU Capsicum 1.
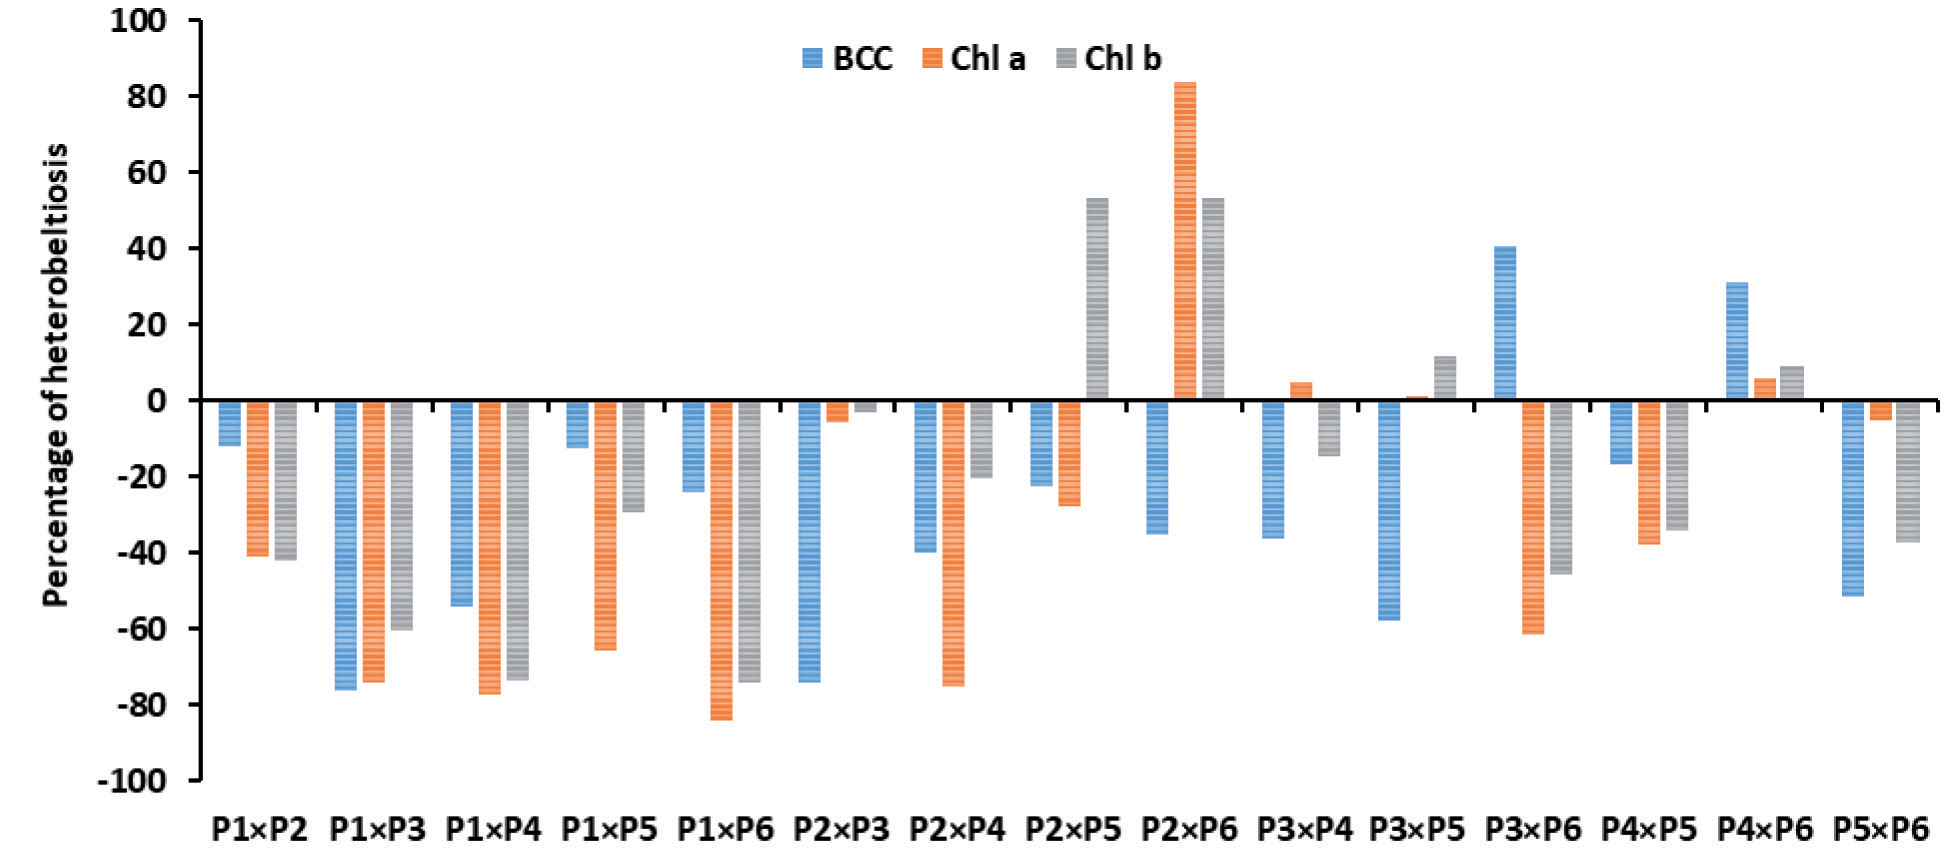
Fig. 3.
Percentage of heterobeltiosis for TCC: Total carotenoid content (mg/g); TPC: Total phenolic content (µg/g FW); K: Potassium content (%); Na: Sodium content (%). Non-significant data were marked by ‘N’ and other data were significant at P<0.01. P1: Red Chili, P2: Chili Padi, P3: PLP-2s, P4: Chili Japan, P5: Morich-8, P6: BU Capsicum 1.
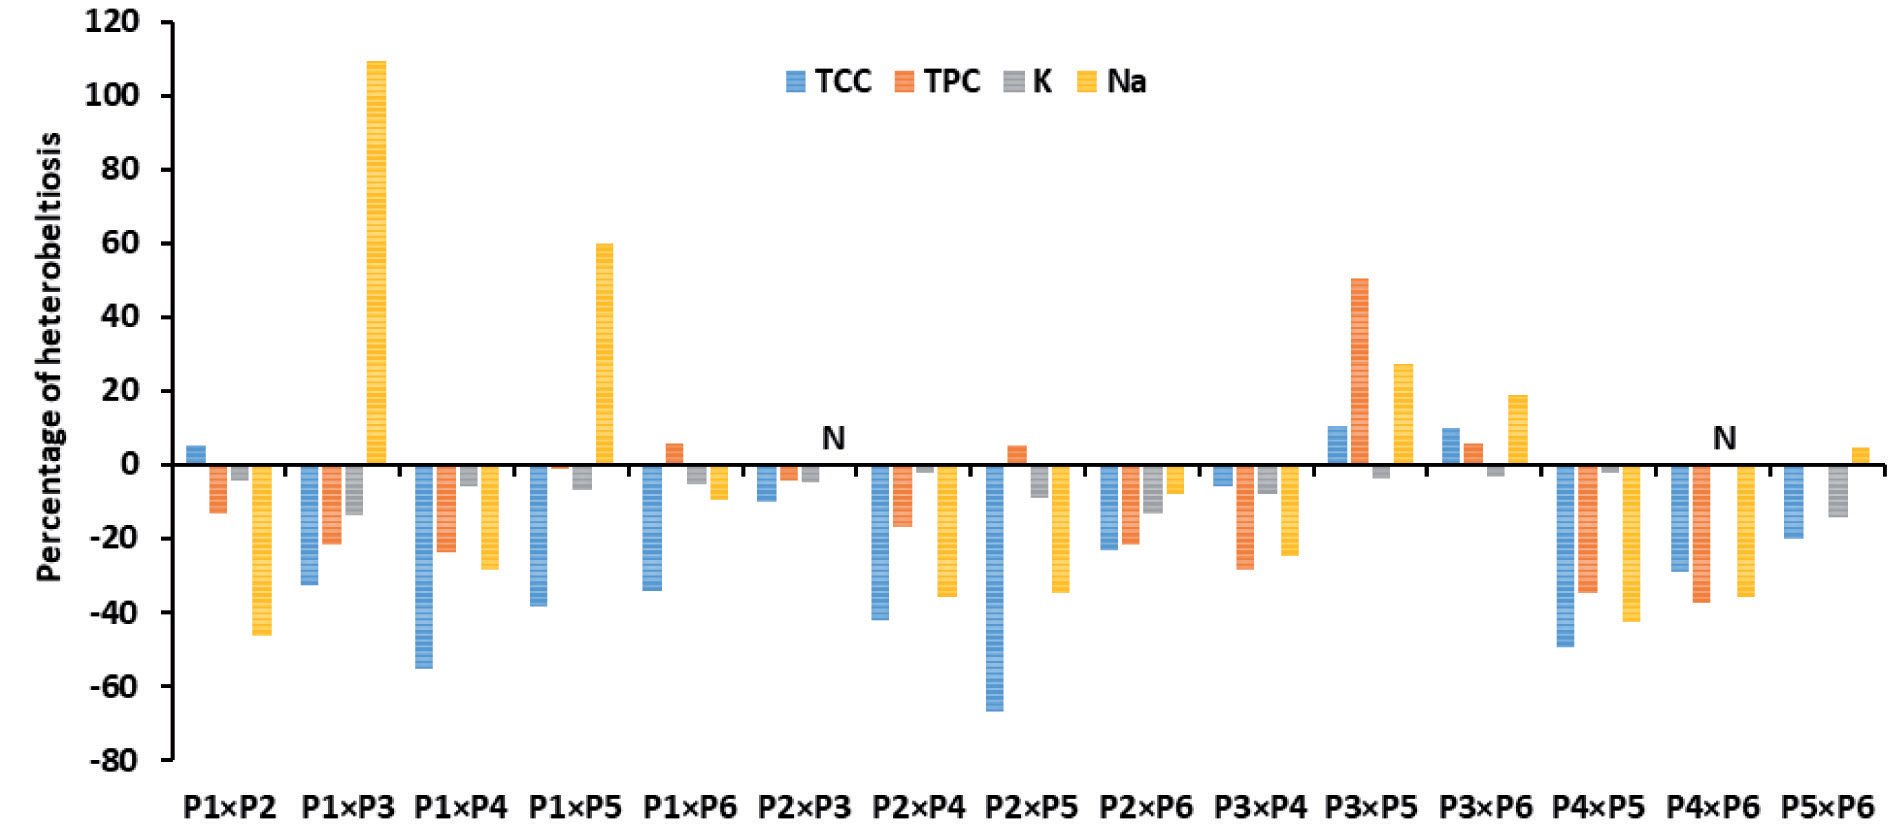
The analysis of better parent heterosis or heterobeltiosis (%) exhibited that the hybrids P3×P4, P1×P4, P3×P5, P4×P6, and P3×P6 had higher significant positive heterobeltiosis for CAP. Significant and positive heterobeltiosis for AAC was observed in the hybrids P4×P6, P3×P6, P1×P2, P2×P6, and P3×P4, and only hybrids P3×P6 showed significant positive heterobeltiosis for AOC (Figure 1). For BCC, the hybrids P3×P6 and P4×P6 showed significant positive heterobeltiosis. The hybrids P2×P6, P4×P6, and P3×P5 exhibited significant positive heterobeltiosis for Chl a and Chl b (Figure 2). For TCC, the hybrids P3×P5, P3×P6, and P1×P2 had significant positive heterobeltiosis; and for TPC, it was shown in the hybrids P3×P5, P1×P6, P3×P6, and P2×P5. For Na, the hybrids P1×P3, P1×P5, P3×P5, P3×P6, and P5×P6 expressed significant positive heterobeltiosis (Figure 3).
Discussion
Genetic variance, gene action, and heritability information are used to select parents and hybrids. Simple ANOVA revealed the presence of a wide range of genetic variability among the parents and offspring, which can be used for developing hybrids for nutritional traits based on their combining ability and heterosis [26]. The ANOVA for combining ability manifested that the non-additive gene action caused the variability found for all the studied nutritional traits. The lower value of σ2g/ σ2s ratio indicated that the non-additive gene action has prevailed for all the nutritional characteristics. As non-additive gene action is more important than additive gene action, there is a possibility of improving nutritional traits by heterosis breeding in the later generation of segregating population [27]. Our study’s non-additive gene action for CAP supported the results of previous studies by Aiswarya et al. [28] and Mahmood et al. [29]. In the case of AAC, we got the opposite effect that was reported by Aiswarya et al. [28], Do Nascimento et al. [30], and Tyagi et al. [25]. However, our findings of positive non-additive gene action for AAC and other phytochemicals may well contribute to the capture of genotypic potential to produce a useful amount of SCA potential in their progenies. The (H1/D)0.5 ratio measures the average degrees of dominance over all loci. (H1/D)0.5 was found to be greater than zero but less than one for AAC, AOC, BCC, Chl a, Chl b, TCC, K, and Na, indicating that these traits were controlled by partial dominance gene action, while the traits CAP and TPC were controlled by overdominance gene action. The h2n was high for AAC, AOC, BCC, Chl a, Chl b, TCC, K, and Na, indicating a significant part of additive gene action in phenotypic variability in nature, and selection would be effective for improvement of these traits in chili.
Table 5.
Mean performance of nutritional traits of six parents and fifteen F1’s in 6×6 half diallel population of chili.
[i] CV: Coefficient of variation; SE: Standard error; HSD: Tukey’s honest significant difference. †CAP: Capsaicin content (%); AAC: Ascorbic acid content (mg/100g); AOC: Antioxidant capacity (µg/g FW); BCC: β - carotene content (mg/100g); Chl a: Chlorophyll a content (mg/g); Chl b: Chlorophyll b content (mg/g); TCC: Total carotenoid content (mg/g); TPC: Total phenolic contents (µg/g FW); K: Potassium content (%); Na: Sodium content (%). P1: Red Chili, P2: Chili Padi, P3: PLP-2s, P4: Chili Japan, P5: Morich-8, P6: BU Capsicum 1.
Table 6.
Mid parent heterosis for nutritional traits of fifteen F1’s in 6×6 half diallel population of chili.
[i] * and ** significance at 5% and 1% levels, respectively. †CAP: Capsaicin content (%); AAC: Ascorbic acid content (mg/100g); AOC: Antioxidant capacity (µg/g FW); BCC: β - carotene content (mg/100g); Chl a: Chlorophyll a content (mg/g); Chl b: Chlorophyll b content (mg/g); TCC: Total carotenoid content (mg/g); TPC: Total phenolic contents (µg/g FW); K: Potassium content (%); Na: Sodium content (%). P1: Red Chili, P2: Chili Padi, P3: PLP-2s, P4: Chili Japan, P5: Morich-8, P6: BU Capsicum 1.
The estimation of GCA is essential for identifying suitable parents for developing hybrids with desired quality traits. It provides insight into whether a parent combines well in hybridization and indicates the specific performance of a hybrid against the parents’ GCA expectations. Hybridization of parents with higher estimates of GCA should be potentially superior for the selection of lines in the advanced generations [31]. So far, in the present study, no parent was selected as an excellent general combiner for all the nutritional traits studied. Among the parents, the best GCA effect for all the traits except K and Na has been found in PLP-2s. Based on GCA effects, it is revealed that the parent Red Chili is the best parent for AOC, Chl a, Chl b, and K. Parent Red Chili could be selected for improving Chl a, Chl b, TCC, and Na in the hybrids. For developing hybrids with CAP, TPC, K, and Na, the parent Chili Japan; for CAP, AAC, Chl b, and TPC, the parent Morich-8 could be selected. The parent’s BU Capsicum 1 could be a good general combiner for CAP, AAC, BCC, TPC, K, and Na. However, the parents PLP-2s, Morich-8, and BU Capsicum 1 could be considered for breeding hybrids for pungency and ascorbic acid content. The parents, Red Chili and Chili Padi, could be selected for developing sweet pepper with other phytochemicals as these parents showed negatively significant values for CAP.
Determination of SCA is important for identifying the best F1 hybrids for specific traits. Both dominant and epistatic gene actions and heterosis can be indicated by SCA [32]. In the present study, the F1 PLP-2s × BU Capsicum 1 is considered the best hybrid for improving major nutritional components such as capsaicin and ascorbic acid. The cross combination PLP-2s × Chili Japan and PLP-2s × Morich-8 could be selected for more CAP with higher AAC, Chl a, Chl b, and TCC. The combination PLP-2s × Chili Japan could also be considered for higher BCC and Na, and the hybrid PLP- 2s × Morich-8 for higher TPC and K. The hybrid Chili Japan × BU Capsicum 1 could also be selected for CAP, AAC, BCC, Chl a, Chl b, and K. The hybrids mentioned above have combined most of the nutritional traits, and these hybrids can be used for commercial exploitation. However, the other hybrids also performed well such as the hybrids Red Chili × Chili Padi could be selected for CAP, AAC, BCC, TCC, and K; and for CAP, AAC, TPC, and Na, the hybrid Red Chili × Chili Japan could be considered. The hybrid Red Chili × Morich-8 and Chili Padi × PLP-2s could improve CAP, K, and Na, and the hybrid Red chili × Morich-8 could also be considered for enhancing AOC, BCC, and Chl b. The hybrids Chili Padi × Chili Japan and Chili Japan × Morich-8 could be selected for lower CAP (can be cultivated as sweet pepper) with higher AOC and K. Additionally, the hybrid Chili Padi × Chili Japan was also well performed for TPC. For sweet peppers with higher AOC, BCC, and Chl b, the hybrids Chili Padi × Morich-8 and Chili Padi × BU Capsicum 1 could be selected. Simultaneously, the hybrid Chili Padi × Morich-8 could also be picked for higher TPC, and the hybrid Chili Padi × BU Capsicum 1 for Chl a, TCC, and Na.
The exploitation of heterosis is vital for developing hybrids with novel quality traits. Pungency (capsaicin) is considered the most important trait for the consumer in Bangladesh and some other countries in South Asia, and ascorbic acid is the second most important phytochemical in chili. However, we provide equal importance to combining capsaicin and other nutritional traits in the hybrids so that consumers can enjoy the spicy taste and additional nutrition. The nature and magnitude of heterobeltiosis help select superior hybrids and their exploitation to get better transgressive segregants [33]. The heterotic response of nutritional phytochemicals substantiated significant heterotic effects for all the nutritional characters studied [34]. The relative heterosis and heterobeltiosis indicate the potential for further improvement of the nutritional traits through heterosis breeding. Among the hybrids, 38% and 20% showed superiority over their mid-parent and better parent in the desired direction, considering the studied traits that reveal an outstanding potential for exploitable heterosis. All the nutritional traits for relative heterosis and all the characters except K for heterobeltiosis showed significant positive responses, which can be exploited in further breeding. Considering the overall SCA effects and both mid-parent heterosis and heterobeltiosis, the hybrid PLP-2s × BU Capsicum 1 could be selected as the best hybrid for CAP, AAC, AOC, BCC, TCC, TPC, and Na, followed by the hybrid Chili Japan × BU Capsicum 1 for CAP, AAC, BCC, Chl a, and Chl b; and the hybrid PLP-2s × Chili Japan for CAP, AAC, and Chl a. Other F1 hybrids Red Chili × Chili Padi, Red Chili × Chili Japan, Red Chili × Morich-8, Chili Padi × BU Capsicum 1, and PLP-2s × Morich-8 could also be selected for different nutritional phytochemicals. Among them, the hybrid PLP-2s × BU Capsicum 1 has been chosen as the most suitable combination for breeding and selection in the next generations for commercial exploitation.
Conclusions
The result of the present study led to the identification of important parents based on GCA and positive SCA for developing F1 hybrids with higher heterosis for chili nutritional phytochemicals. Parent PLP-2s was the best parent, followed by BU Capsicum 1, Chili Japan, and Morich-8, and the hybrids PLP-2s × BU Capsicum 1 was the best hybrid for all the nutritional phytochemicals except Chl a, Chl b, and K followed by Chili Japan × BU Capsicum 1 and PLP-2s ×P4. Other F1 hybrids, Red Chili × Chili Padi, Red Chili ×P4, Red Chili × Morich-8, Chili Padi × BU Capsicum 1, and PLP-2s × Morich-8, showed heterosis for other nutritional quality. Overall, this study provides valuable information for genetic improvement of nutritional quality in chili through hybridization. Above hybrids also recommended for multilocation testing to assess their suitability for commercial cultivation.

