

Introduction
In exploring the correlation between agricultural production and energy supply, the availability of groundwater has emerged as a pivotal constraint, markedly influencing food and energy security in the broader context of sustainable development. The rapid advancement of industrialization and urbanization has exacerbated the challenge of water scarcity, leading to increased competition for water supplies across various sectors [1]. Notably, this competition is most evident between agricultural irrigation and the cooling systems of thermal power plants [2]. Increasing evidence suggests that long-term over-extraction of groundwater can lead to a range of ecological issues, including land subsidence, saltwater intrusion, and degradation of agricultural land, which in turn affect crop switching and cropped areas [3, 4]. Furthermore, widespread issues such as rampant groundwater extraction and suboptimal water use efficiency worsen the threats to food security [4, 5]. Collectively, these issues pose a significant risk to the sustainable advancement of agriculture, underscoring the urgency of comprehensively deciphering the dynamics governing water distribution across these essential sectors.
The competition for water resources between thermal power generation and agricultural production is intricate and has not been extensively studied via field-based observations. Currently, water scarcity is evident not only in reduced supply but also in increased demand. Excessive groundwater extraction and competition for water resources from non-agricultural sectors are expected to limit the availability of water for agricultural irrigation. It is also observed that the widespread use of groundwater for irrigation agriculture has led to a significant depletion in groundwater reserves. Approximately 85% of water use worldwide is allocated to irrigated agriculture [6]. The rate of groundwater extraction also far exceeds the natural replenishment rate of aquifers [7]. Given the diminishing groundwater supplies and government intentions to sustain or enhance food production, it is crucial to prioritize the improvement of water resource efficiency [2].
Moreover, industry ranks as the second-largest consumer of water resources, mostly for the purpose of cooling systems in electricity generation and manufacturing [8]. Over half of thermal power plants are located in water-stressed regions1. Existing research suggests that the thermal power industry exacerbates water scarcity in river basins [6, 9, 10], especially in major agricultural production areas dominated by irrigation agriculture. Thermal power plants typically source cooling water from surface water, groundwater, and reclaimed water. Actually, the utilization of groundwater is the favored choice for cooling systems in these facilities [11].
Given the restricted and uneven allocation of water resources, the intensification of energy supply worsens water scarcity, thereby indirectly compromising the sustainability of food production [3, 6]. However, the existing literature scarcely addresses quantitative assessments of farmers’ adaptive behaviors to the development of the energy sector. First, prior investigations examining the nexus of food, energy, and water have predominantly concentrated on elucidating the interaction mechanisms between these elements [12]. Second, the existing economics literature exhibits a notable dearth of research on cross-sector factor competition, particularly regarding resource allocation between traditional agricultural production and modern industrial sectors. Third, the quantitative analysis concerning the impact of the energy sector on agricultural production has predominantly concentrated on external factors, such as air pollution, while overlooking the crucial role that water resources play as an integral component of agricultural productivity [13, 14]. Although the significance of groundwater and the negative effects of its excessive use are increasing, there is a notable absence of thorough research on the effects of groundwater depletion on cropped areas and cropping patterns.
This study makes three major contributions to the existing body of literature. First, it tackles the pressing need to provide a conceptual structure for examining the interconnections between food, energy, and water, particularly in the context of limited resources, environmental constraints, and substantial energy production. Second, it extends prior studies on the externalities from the industrial sector on agricultural production, specifically emphasizing the impact on cropped areas and farmers’ adaptive behaviors as opposed to crop yields [13, 15]. Third, this study underscores the critical role of groundwater as a pivotal limiting factor for agricultural and industrial production. It delves into the significant uncertainties groundwater resources introduce to the equilibrium of China’s food and energy security, examining the issue through the lens of competition among cross-sectoral factors. Additionally, this study endeavors to provide an empirical foundation for economic literature on the food-energy-water nexus.
This study uses a county-level panel to measure the effects of thermal power plants on the wheat sown area across 612 counties in North China, including Henan, Shandong, Hebei, Shanxi, Inner Mongolia, Beijing, and Tianjin, over the period from 2005 to 2016. We investigated whether the competition for water between the energy sector and wheat production leads to changes in cropping patterns. The results indicate a 2.8% decrease in the wheat sown area for each additional thermal power plant. Furthermore, regions with a high concentration of large-scale thermal power plants, scarce surface water, or higher irrigation rates experienced a more significant reduction. The extensive use of groundwater by thermal power plants during the wheat growing season is a critical factor driving these changes in the sown area.
The subsequent sections of the paper are organized as follows: Section 2 reviews existing literature. Section 3 provides background information about the thermal power plants, wheat production, and groundwater resources in North China. Section 4 presents the dataset and empirical strategy, respectively. The estimation results and discussion are presented in Section 5, and Section 6 concludes the work.
Literature Review
The Food-Energy-Water nexus (FEW nexus) represents a complexly intertwined system with profound implications for sustainable development. It has been extensively investigated in existing literature. In order to thoroughly investigate this vital system, these studies have predominantly focused on topics related to the FEW nexus [3, 16-19]. These topics have been categorized into three overarching classifications: climate change adaptation, agricultural productivity enhancement, and resource security assurance. Specifically, food-related issues pertain to matters such as food security, crop quality, and smart farming practices [4, 20], whereas energy-related topics involve water usage in energy production and the production of environmentally friendly energy [7, 8]. Water-related issues encompass the topics of water scarcity, groundwater management, and water quality [5, 10, 21, 22]. The existing research literature on the FEW nexus has predominantly focused on analyzing the input-output efficiency of water, energy, and food over a long period of time [17, 23]. It has also evaluated the implications of their consumption on societal, economic, and environmental aspects [16]. This methodology is consistent with the current trend of autonomously managing these resources across multiple sectors. Although this approach might bolster management efficacy within specific industries, it poses obstacles to the attainment of regional sustainable development. This study aims to provide an initial foundation for comprehending the complex equilibriums that exist within the FEW nexus and to investigate the possibility of sustainability in these interrelated systems.
The existing literature concerning the FEW nexus predominantly centers on the interaction between two crucial components. In particular, in studies exploring the link between water and food, most literature concentrates on water consumption and efficiency in food production [12]. This typically employs field experiments at the plot scale as the primary research method. Water consumption in food production is substantial, accounting for 70% of global freshwater withdrawals and 90% of freshwater consumption [18]. Irrigated agriculture is the predominant form of agriculture in North China, where the limited availability of irrigation water resources directly endangers food security. Put simply, the safeguarding of water resources in North China is critical to ensuring food supply in China’s food security strategy. Hence, there exists a significant gap in empirical research concerning the correlation mechanisms within the FEW nexus, particularly studies based on observational data.
Previous empirical studies have suggested that an increase in irrigation water could potentially enhance crop yields [24, 25]. Jia et al. (2011) [26] inferred that augmenting irrigation water-use efficiency can offset the yield reduction resulting from the decrease in crop water usage. On a similar note, Zhang et al. (2016) [9] scrutinized county-level data in North China and concluded that the implementation of water-saving irrigation practices could alleviate the pressure on groundwater resources. Therefore, it is crucial to improve the efficiency of water usage in agriculture in order to effectively manage and preserve groundwater resources. Additionally, recent studies suggest that switching crops or optimizing crop combinations has a greater impact on reducing groundwater depletion and conserving energy compared to improvements in irrigation efficiency [4, 27]. Existing literature lacks a comprehensive examination of the energy sector’s impact on agricultural water use during the crop growing season, as well as its effects on cropped areas, sowing ratios, and farmers’ adaptive responses.
Following agriculture, the energy sector ranks as the second-largest water consumer [6]. Water consumption in the energy sector is divided into two primary categories: water used in primary energy production and water utilized for electricity generation [28]. The primary consumer of water is the cooling system, which plays a critical role in dissipating residual heat from steam turbines throughout the thermal power production process [6, 10, 29]. Rivalries for water resources intensify in areas characterized by high energy production intensity and limited availability, as is the case in North China and Central-Southern Texas, United States. Zhang and Vesselinov (2016) [30] examined the water scarcity induced by the thermal power industry and its spatial distribution at the watershed level. Their findings revealed that the proliferation of thermal power plants in North China has worsened the scarcity of groundwater resources. Significant quantities of groundwater are required for the operation of thermal power plants. Consequently, groundwater levels decline and there is a scarcity of water supply during crop growing seasons, which has a profound adverse effect on agricultural production [6, 8].
This study investigates the impact of thermal power plants on the wheat sown area and groundwater percentiles during the growing season within the framework of the FEW Nexus. The objective is to furnish evidence supporting the equilibrium between energy production and grain supply. There is an expectation that a transition towards less water-intensive crop switching will occur in pursuit of water sustainability when competition for water resources escalates between the agricultural and energy sectors and the supply of irrigation water declines. Modifying cropping patterns has emerged as a critical strategy for enhancing agricultural water conservation, mitigating water scarcity, and resolving the water supply-demand conflict, particularly in water-scarce irrigated regions [31].
Diverging from previous research, this study underscores the vital importance of farmers’ rational and adaptive decision-making within agricultural production. It critiques traditional ecological experiments for overlooking the economic behaviors of farmers and explores how the energy industry’s development affects their adaptive strategies. Overall, the study offers fresh insights into the intricate relationship between economic development and agricultural practices, emphasizing the necessity of incorporating economic rationality into the analysis of agricultural sustainability.
Background
Thermal Power Plants
China holds the distinction of being the world’s foremost coal producer and consumer, accounting for 50.4% of the global coal supply and 54.3% of its
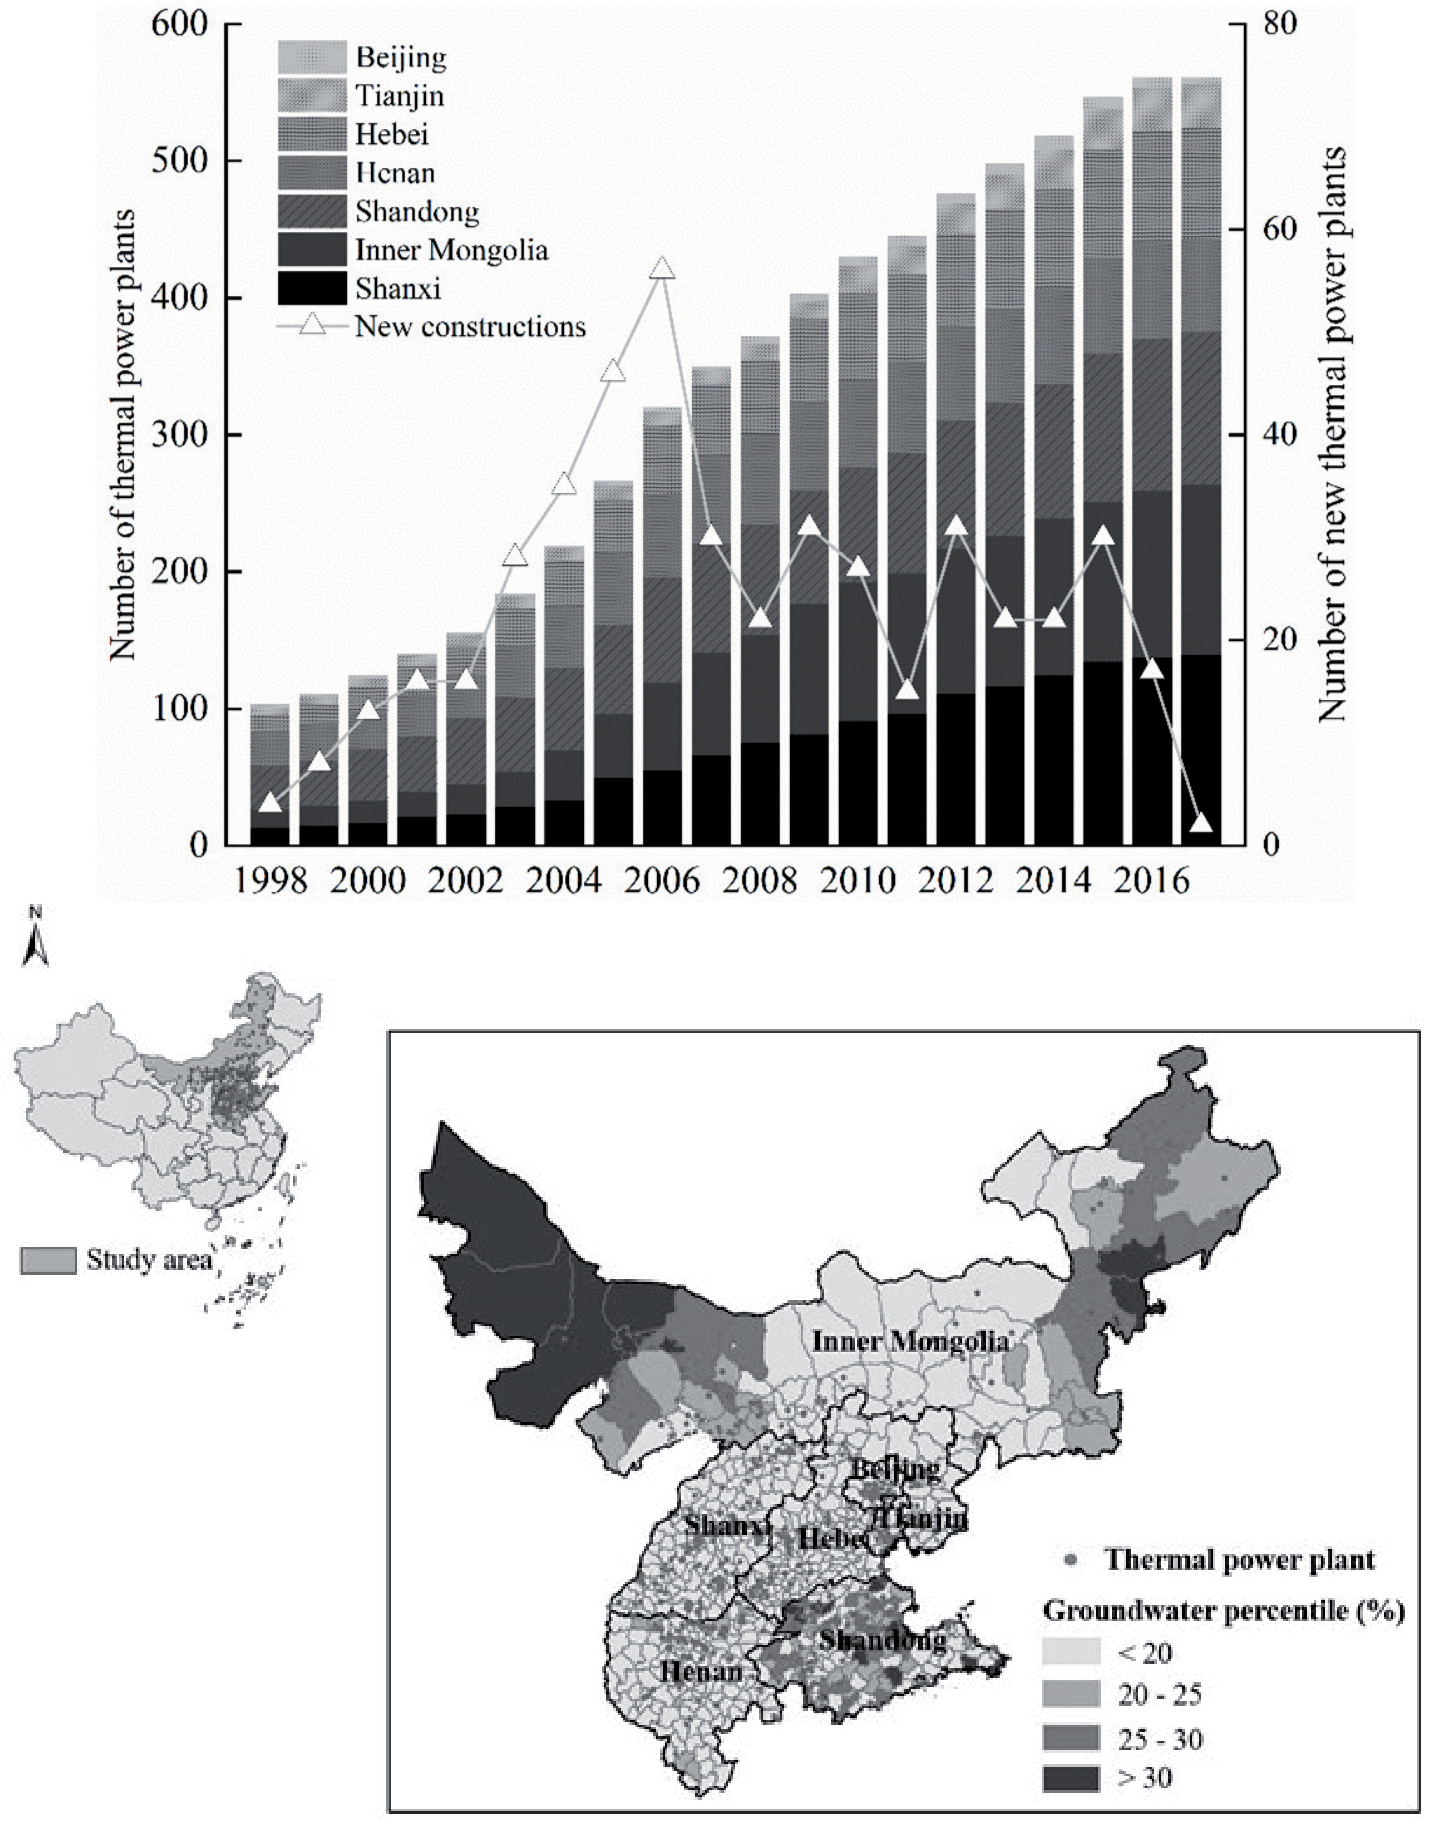
A. consumption in 2020. Approximately half of China’s coal consumption supports its thermal power industry, which in turn generates 73% of the country’s electricity. Over recent decades, there has been a significant surge in China’s per capita electricity usage, rising from 549 kWh in 1990 to 5,309 kWh in 2019. In response to escalating electricity demands, the installed capacity of thermal power plants has expanded dramatically, increasing from 0.1 billion kW in 1990 to 1.1 billion kW in 2019, with a total of 2,039 thermal power plants operational in 2019. Panel A of Fig. 1 illustrates a decelerating growth trend in the number of thermal power plants across North China. After 2011, Shanxi Province emerged as the leading province, overtaking Inner Mongolia in terms of the quantity of thermal power plants in North China.
Fig. 1.
Thermal power plants in North China. Notes: Data are available from the Global Coal Plant Tracker, the Department of Ecology and Environment of China and the National Aeronautics and Space Administration. Panel A illustrates the variations in the number of thermal power plants. Panel B plots the location of the thermal power plant and the groundwater percentiles for each county during wheat growing season.
B.
Fig. 2.
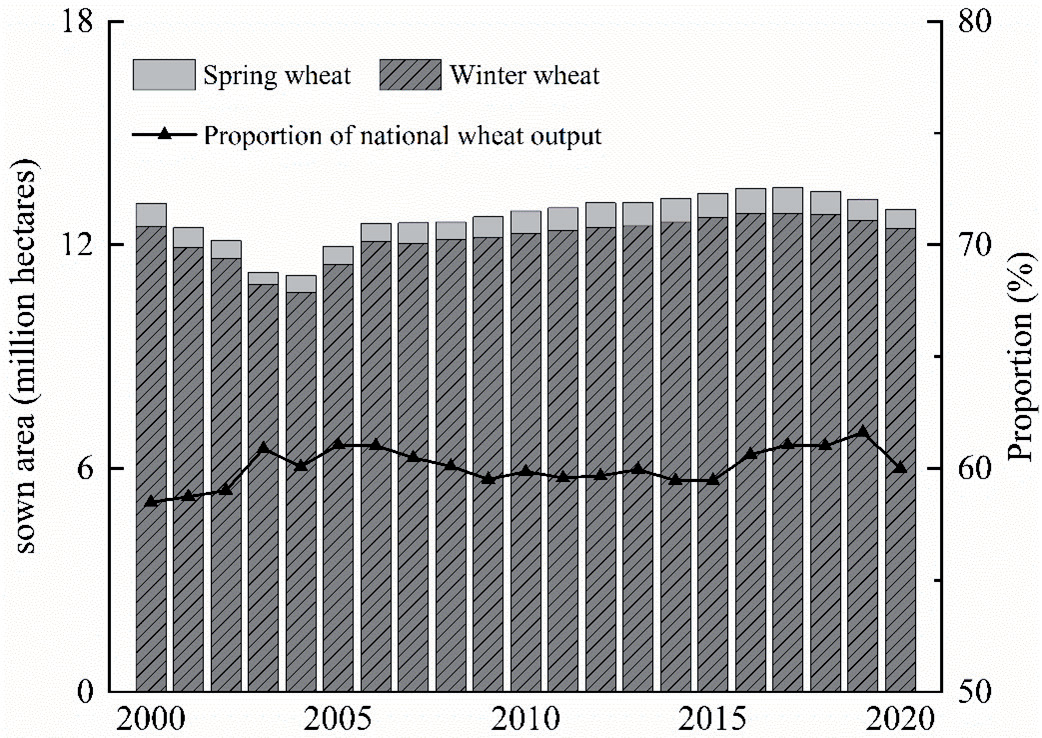
Wheat production in North China. Notes: Data are available from the National Bureau of Statistics of China.
The energy pattern in North China is more dependent on coal than in other regions. In 2019, coal production in North China reached 2,130 million tons, accounting for about 50% of China’s total raw coal output. Over the past few decades, this region has experienced a significant increase in thermal power generation, growing from 332 billion kWh in 1998 to 2,038 billion kWh in 2022. This represents an average annual growth rate of 7.9%. During this period, thermal power consistently contributed between 81.4% and 98.9% of total electricity generation. Demand for heating coal has been high in North China due to harsh winter conditions. Additionally, electricity consumption in North China surged from 326 billion kWh in 1998 to 2,410 billion kWh in 2021, with an average annual growth rate of 9.1%, representing 16% of the national total electricity demand.
Electricity generation is crucial for meeting societal energy needs, but it also poses significant resource and ecosystem challenges. First, the establishment of thermal power plants requires the use of valuable land resources, reducing the land available for agriculture. Therefore, developing a thermal power plant results in the loss of agricultural land. Second, electricity generation through thermal power plants is water-intensive, potentially leading to a shortage of water resources for agriculture in North China. Technically, the operation of power plants contributes the most to total water use, and cooling to dissipate the residual heat from steam turbines in thermoelectric power production uses the most water. Given China’s limited total water resources and a per capita water availability below the global average, the reliance on thermal power plants for electricity generation poses a considerable threat to the sustainability of agricultural water usage.
Wheat Production
China’s strategy for food security focuses on maintaining a stable domestic grain supply to achieve a high level of self-sufficiency. Wheat serves as the primary food for about 60% of the Chinese population, predominantly in North China. North China accounts for more than 60% of the national wheat sown area. Therefore, stabilized wheat production has substantial implications for China’s food security objectives.
In North China, the net profit from wheat production declined, leading to a decrease in the area sown with wheat from 14 million hectares in 1990 to 13 million hectares in 20202. This reduction coincided with a significant increase in corn sown area, driven by rising domestic demand for food, feed, and fuel. Despite these challenges, technological advancements in agricultural practices have significantly boosted wheat production in China. Notably, wheat output in North China increased from 58 million tons in 2000 to 83 million tons in 2020. As shown in Fig. 2., wheat in North China contributes to roughly 60% of the national wheat output. In 2020, the output of winter wheat reached 73 million tons, which constituted 90% of the total wheat supply. Moreover, winter wheat accounts for 95% of the total wheat sown area in North China, making it the predominant variety.
Wheat cultivation is a water-intensive process. The amount of water usage and its efficiency during the growing season are crucial for determining wheat yield and quality. The cultivation of wheat requires significant irrigation, leading to the overexploitation of groundwater in some regions. To address this issue, pilot projects have been initiated in Hebei Province since 2005 to combat groundwater overexploitation [5, 32]. These projects recommend reducing wheat cultivation in areas with severe groundwater depletion and no access to alternative surface water sources. Instead, they propose a shift from double cropping to single cropping with less water-intensive crops, such as corn, cotton, or peanuts [33]. Additionally, the agricultural department suggests cultivating more water-efficient wheat varieties to further reduce groundwater usage [12].
Groundwater Resources
The distribution of water resources across China exhibits a striking imbalance, characterized by an abundance in the southeastern regions in stark contrast to the scarcity in the northern and western regions [5]. China’s per capita water resources amount to merely one-fourth of the global average [32]. In North China, this figure dwindles to less than one-sixth of the national average. Confronted with a diminishing supply of surface water, farmers in North China have increasingly turned to groundwater resources. Groundwater has emerged as the predominant source of irrigation in this region [34]. Despite possessing only 19% of the country’s water resources, North China remarkably sustains over 65% of its cultivated land and contributes 50% to the national grain production3. The shortage of groundwater resources has become an important factor restricting the development of agriculture in North China.
In North China, the characteristics of groundwater resources include limited total availability, low per capita possession, and underutilization. Since the 1970s, groundwater extraction in North China has escalated significantly, rising from approximately 20 km3 annually to 37 km3 in 20174, with an average annual growth rate of 1.3%. Excessive extraction in this region has led to severe depletion, with an estimated shortfall of 180 km3 in original groundwater reserves and an overexploited area of 180,000 km2. This represents approximately 56% and 70% of the country’s total overexploited volume and area, respectively5. The excessive use of groundwater has turned the region into one of the world’s largest “groundwater funnel areas.” Consequently, the decline in groundwater levels has surpassed an alarming rate of 2 meters per year [5, 34]. Over the past decade, this alarming trend of groundwater depletion has become increasingly evident across different parts of North China.
In recent years, an increase in extreme climatic events, such as more frequent and severe droughts and heat waves, has led to a significant decrease in rainfall and runoff [6]. From 1978 to 2017, the proportion of water used for agriculture decreased from 88% to 62%, primarily due to a significant rise in industrial and domestic water demands, thereby exacerbating the intensity of groundwater extraction [32]. In response to these challenges, the government has initiated several measures in North China. These include promoting water-efficient irrigation techniques, establishing the South-North Water Transfer Project, and strengthening groundwater management and protection strategies [18, 32, 35]. While these initiatives have slowed the decline of groundwater levels, reversing the trend of over-extraction and ensuring sustainable groundwater usage remains a daunting task.
In North China, the increasing thermal power generation coincides with the wheat growing season. Interestingly, regions with a high concentration of thermal power plants exhibit reduced groundwater percentiles during the wheat growing season (see Panel B of Fig. 1). This phenomenon is primarily due to the burning of large quantities of coal for heating. The formal residential “heating season” in North China extends from October of the previous year to March or April of the following year. Therefore, we aim to investigate whether the overlap between the peak water demand for thermal power plants and the wheat growing season affects the water consumption during the wheat growing season and potentially leads to a reduction in its sown area.
Data and Methodology
Data Source
Explained Variables
We obtained county-specific wheat sown area data for the period of 2005–2016 from the Institute of Agricultural Information at the Chinese Academy of Agricultural Sciences (CAAS). This data covers wheat production in seven provinces and municipalities in North China: Henan, Shandong, Hebei, Shanxi, Inner Mongolia, Beijing, and Tianjin. This region encompasses 612 counties, accounting for 60% of China’s domestic wheat production and sown area. In analyzing the proportion of wheat sown area, we also considered other major crops such as rice, maize, soybean, potato, cotton, rapeseed, sugar crops, vegetables, and fruits, which constitute approximately most of the sown area.
To locate the growing season for wheat in North China in this study, we obtained the planting and harvest dates of winter wheat across regions from the Major World Crop Areas and Climate Profiles by the US Department of Agriculture. Overall, the winter wheat growing season lasts from September to June of the following year, and the spring wheat growing season lasts from March to June.
Explanatory Variables
We compiled the number and installed capacity of thermal power plants from the Global Power Plant Database, the Global Coal Plant Tracker, and the Department of Ecology and Environment of China. These sources record the name and location of each thermal power plant, as well as its latitude and longitude, primary fuel type (coal, gas, or oil), and installed capacity.
Control Variables
The meteorological data were sourced from the China Meteorological Data Sharing Service System. This dataset includes daily records of precipitation, minimum, maximum, and average temperatures from 596 weather monitoring stations. Such detailed daily weather information is crucial for identifying the heat, precipitation, and various other meteorological conditions affecting wheat during the growing season. The distribution of weather stations is uneven; some counties have more than one station, whereas others have none. Following the common practice in the literature [36], we used the inverse distance weighted method to interpolate climate data from the weather stations over a grid with a spacing of 500 meters. Last, the average value of all grid points within a county was calculated to represent the county’s mean climatic conditions. To accurately assess the impact of long-term climate change on farmers’ adaptive behaviors, The first two meteorological variables were the average temperature and aggregate precipitation during the wheat growing season over the past 5 years. To capture the volatility in climate factors, we also use the standard variation of mean temperature and aggregate precipitation during the wheat growing season over the past 20 years [37, 38].
Socioeconomic variables include total arable land area6, population density7, the ratio of the lagged wheat price index as a proxy variable for farmers’ expected prices, and the producer price index for input prices for wheat production. A summary of statistics for socioeconomic variables can be found in Table 1.
Mechanism Variables
The groundwater data consists of groundwater percentiles. This data was obtained from the global groundwater map provided by the National Aeronautics and Space Administration (NASA). This platform offers weekly updates on soil moisture and groundwater percentile data on a global scale. To gather valid groundwater data for the target area, satellite imagery of the boundary layer is utilized. We then integrated this data onto a grid measuring 0.125° by 0.125° using simple Kriging techniques. The average value from all grid points within a county is calculated and assigned to that county. This represents the dynamic changes in groundwater levels during the wheat growing season. We also utilize groundwater level data from the China Geological Environment Monitoring Groundwater Level Yearbook to represent groundwater usage levels across the county.
Table 1.
Summary statistics.
Table 1. presents the descriptive statistics for the key variables. The average wheat sown area at the county level during our study period was 1.29 (10,000 ha), which is close to the national average of 1.33 (10,000 ha) in the same period. As of 2016, approximately five thermal power plants were located within 50 km of the geographic center of each county. Panel B of Fig. 1. provides a detailed visualization of the spatial distribution of thermal power plants as of 2016. These installations are primarily clustered in the major wheat producing areas, with a notable presence in almost every county, particularly within Hebei and Shanxi Provinces.
Empirical Strategy
We implement the following econometric model to identify the influence of thermal power plants on wheat sown area:
where Yit denotes wheat sown area in county i in year t. We use Powerplantsit to represent the number of thermal power plants within 50 km of the geographic center of county i in year t. Wit represents a set of meteorological variables relevant to the wheat growing season. It includes the average temperature and aggregate precipitation during the wheat growing season in county i over the past 5 years, as well as the standard variation of mean temperature and aggregate precipitation during the wheat growing season in county i over the past 20 years. The binary variable Vi captures the heterogeneous responses of different wheat varieties (winter/spring wheat) to climatic variations. Xit denotes socioeconomic variables, including total arable land area, population density, and the ratio of lagged wheat and producer price index. λt is year fixed effects. τt is county fixed effects to control for time-invariant unobserved factors, such as local natural endowments and agricultural production practices, soil quality, terrain, and rotation mode. εit are error terms. Following Yi et al. (2020) [36], we estimate the model with standard errors that are clustered at county and city-year levels. This two-way clustering strategy allows serial correlation over the years within a county and spatial correlation across counties within a city–year combination.
Results and Discussion
This section provides a detailed empirical analysis of the effects of thermal power plants on the wheat sown area. First, the Hausman test indicates that the random effects model is not statistically valid at the 1% significance level. Therefore, subsequent estimations are grounded in the fixed effects model. Second, to verify the robustness of our findings, we use alternative methodologies for quantifying the number of thermal power plants. Further, we undertake extensive analyses to investigate various aspects of heterogeneity, focusing on geographic and socioeconomic indicators. Last, we incorporate groundwater data to elucidate the underlying mechanisms and assess the impact of thermal power plants on groundwater during the wheat growing season.
Baseline Results
Table 2. presents our baseline results on the impact of thermal power plants on the wheat sown area, as derived from Equation (1). Column (1) only accounts for county and time fixed effects, while Column (2) incorporates an additional set of weather variables. The results from these estimations strongly suggest that thermal power plants exert a significantly negative effect on wheat sown areas. Furthermore, comparing the weather variables in columns (2) and (3), there is no evidence that different responses of wheat varieties to weather conditions alter our main conclusions.
Furthermore, the baseline results are designed to encapsulate the overall marginal effects of thermal power plants on wheat sown area, excluding adjustments for socioeconomic variables. If these variables exhibit a systematic correlation with the presence of local thermal power plants, the estimated results may be biased due to omitted variables. To address this concern, we have assessed the robustness of our findings by incorporating additional variables: the ratio of lagged wheat and current producer price indices, total sown area, and population density. Column (4) in Table 2. confirms that the impact of thermal power plants on wheat sown area is consistent with the baseline results. Specifically, the presence of an additional thermal power plant is associated with a 2.8% reduction in wheat sown area, statistically significant at the 1% level. Additionally, we investigated the impacts of thermal power plants on cropping patterns. The findings indicate that the presence of thermal power plants significantly decreases the proportion of the wheat sown area (see Appendix Table A1.).
Robustness Checks
Alternative Radii
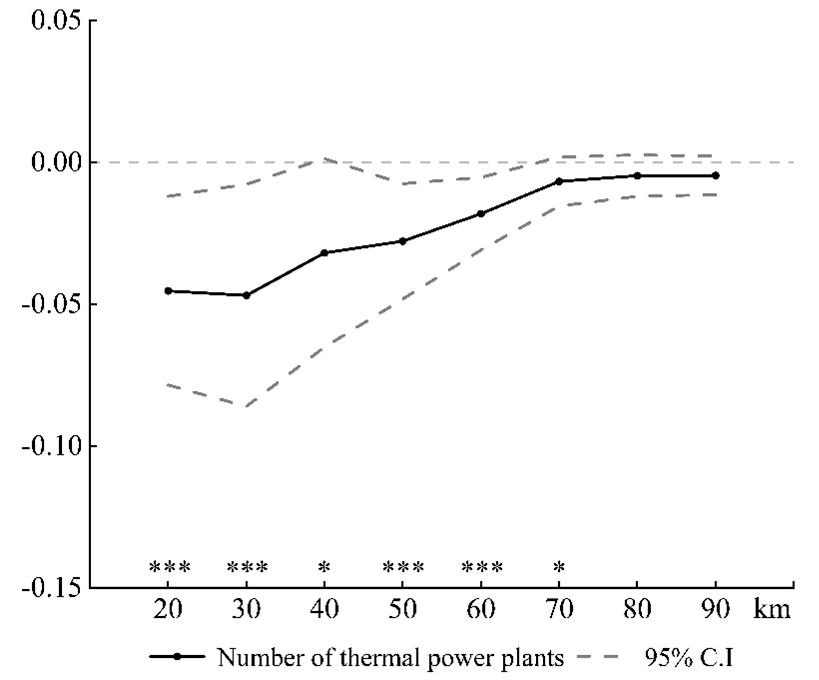
In this section, we evaluate the robustness of our previous findings, focusing on how spatial proximity influences the extent of economic impact due to resource competition. Generally, being closer to a thermal power plant correlates with a significant decrease in groundwater levels, which in turn leads to increased competition for water resources among agriculture and industries [7, 39]. Therefore, we investigate the consistency of the negative effects on wheat sown area relative to varying the distance thresholds from thermal power plants to county centers. Specifically, we examine the impact of thermal power plants on wheat sown areas within a range of 30 km to 90 km from the county center, as shown in Fig. 3. The results reveal that the impact on the wheat sown area progressively decreases as the radius increases, in comparison to our baseline results, where the radius is set at 50 km. Notably, the effects become statistically insignificant when distances range from 80 km to 90 km. This finding suggests that closer proximity to thermal power plants intensifies competition for groundwater resources, consequently exacerbating the adverse effect on the wheat sown area. We subsequently detect the impact of thermal power plants at varying distances on cropping patterns. The results confirm that thermal power plants have a significantly negative impact on the proportion of wheat sown area (see Appendix Table A2.).
Measurement Errors
We also employ alternative explanatory variables to mitigate the influence of measurement errors on the estimation results [10, 35]. The analysis has been refined by taking into account the unique characteristics of each thermal power plant, aiming to accurately reflect the impact of these plants on the wheat sown area. First, we expand our focus beyond the quantity of thermal power plants, considering their scale in terms of installed capacity. As demonstrated in Column (1) of Table 3, this adjustment reaffirms that the presence of thermal power plants exerts a significantly negative impact on the wheat sown area. Second, for a more detailed analysis, we use an inverse distance weighted method to recalculate the number of thermal power plants, assigning lower weights to plants located further away. This method effectively captures the competing effects on groundwater based on the proximity of these plants to the wheat cultivation region, based on the result in Column (2) of Table 3. The application of these refined methodologies markedly improves the understanding of the adverse effects of thermal power plants on wheat sown areas.
Table 2.
Results for thermal power plants on wheat sown area.
Past Climate Experience
Economic agents’ prior experiences with climate can influence their perceptions of future climatic conditions and their propensity to engage in adaptive behaviors [40]. To examine this effect, we incorporate measures of historical temperature and precipitation prior to the wheat growing season. These measures are used to evaluate the impact of previous climate experiences on wheat sown areas. Following Cui and Xie (2022) [41], we use the moving average of temperature and aggregate precipitation from the 3 months preceding the wheat growing season over the past 5 years as indicators of past climate experience. These results are presented in Column (3) of Table 3. The coefficients associated with historical weather variables are not statistically significant. Consequently, it appears that farmers who have experienced more variable weather conditions do not tend to adopt strategies aimed at mitigating the risks linked to the area planted with wheat. This indicates that the inclusion of data on past climate experiences does not influence the core findings of the study.
Table 3.
Robustness checks.
[i] Notes: Standard errors are clustered at the county and city-year levels. * p<0.1, ** p<0.05, *** p <0.01. “Temperature” and “Precipitation” in Column (3) represent the moving average of temperature and aggregate precipitation from the 3 months preceding wheat growing season over the past 5 years. The number of observations for Columns (4) and (5) is reduced because the economic variables in the CAAS and China Statistical Yearbook (Township) do not include all counties in the sample.
Fig. 3.
Effect of thermal power plants at different radii on wheat sown area. Notes: Standard errors are clustered at the county and city-year levels. The figure indicates the estimation results (solid line) and 95% confidence intervals (dashed lines). The circles in the middle of the dashed lines represent estimated coefficients. Asterisks at the bottom indicate results statistically significant at *10%, ** 5%, and *** 1% levels.
Adjustment of Economic Variables
As agriculture undergoes large-scale transformations, adjustments in cropping patterns are inevitable. There has been a trend towards a “non-grain-oriented” planting structure due to the moderate-scale management of farmland [42]. However, this trend may reverse towards a “grain-oriented” planting structure, owing to the shift of farmers’ labor to non-agricultural sectors and the evolving development of the economy [43]. To characterize the scale of agricultural operations and the level of regional economic development, we further consider the per capita arable land area of farmers and GDP intensity in specifications8. Columns (4) and (5) of Table 3. show that the per capita arable land area of farmers has a significant negative impact on wheat sown area. This indicates that the expansion of the scale of agricultural operations reduces farmers’ willingness to cultivate food crops, as the cultivation of cash crops emerges as a more favorable option in pursuit of profit maximization. Moreover, the coefficients for thermal power plants are similar to the baseline results and remain significantly negative, suggesting that the assumptions pertaining to economic indicators and the scale of agriculture are unlikely to influence our baseline findings.
Spatial Correlation
Due to the regional similarities in agricultural production policies implemented by provincial governments, farmers in neighboring counties tend to make similar production decisions [36]. To confirm our findings, we use multiple clustering methods to mitigate potential serial and spatial correlations. We apply a two-way clustering strategy that allows spatial correlation across counties within a province–year combination. Furthermore, we utilize Conley standard errors [44] to account for arbitrary correlations among spatially adjacent observations. Overall, these specifications demonstrate the robustness of alternative standard error clustering strategies and are consistent with the baseline findings (see Appendix Table A3.).
Heterogeneity
A further series of analyses are conducted according to the geographical and socioeconomic indicators. We explore the effects of thermal power plants on wheat sown areas according to wheat variety, the scale of thermal power plants within a designated radius from the county center, the proportion of effective irrigated areas to arable areas, and the accessibility of water systems.
First, we compare the effects of thermal power plants on wheat sown areas of spring and winter wheat, as presented in Columns (1) and (2) of Table 4. The estimated results indicate an adverse impact of thermal power plants on the winter wheat sown area. This finding is consistent with previous agronomy studies, which posited that different wheat varieties respond variably to water stress [45]. Specifically, winter wheat exhibits a higher sensitivity to water stress due to less precipitation during the growing season. Consequently, farmers often adopt strategies such as reducing the sown area to adapt to the impacts of water scarcity.
Second, we categorize counties based on the presence or absence of local water systems (lakes, rivers, and reservoirs). Resource endowments play a crucial role in understanding the impact of thermal power plants on wheat sown areas [1, 35]. As shown in Columns (3) and (4) of Table 4., the negative impact on wheat sown area is significantly more pronounced in regions lacking water systems. This finding highlights the increased vulnerability of agricultural regions with limited surface water resources to the competition for groundwater resources posed by thermal power plants [7, 32].
Table 4.
Heterogeneity analysis.
[i] Notes: †Empirical p-values of Fisher’s permutation tests are obtained using the bootstrap method with 1,000 repetitions, which are estimated on the basis of the null hypothesis that the coefficients of thermal power plants are equal for the two samples under consideration. We include wheat variety-specific weather variables as Table 2. Standard errors are clustered at the county and city-year levels. * p<0.1, ** p<0.05, *** p<0.01.
Third, we examine the impact of thermal power plants on wheat sown areas across different irrigation rates. Following the methodology by Pfeiffer and Lin (2014) [46], we categorize counties based on the ratio of effective irrigated areas to arable land. This distinction is designed to illuminate how farmers adapt to environmental challenges and the advancement of water conservation initiatives on agricultural land. The p-value of Fisher’s permutation test suggests significant variation in the effects across irrigation rates. The results presented in Columns (5) and (6) of Table 4 reveal that regions with a higher proportion of effective irrigation are particularly vulnerable to water scarcity in wheat sown areas. This issue is exacerbated when groundwater resources are allocated preferentially to energy production.
Last, we investigate whether the impact of thermal power plants on wheat sown areas fluctuates with the scale of these facilities. We categorize the counties based on the plants’ scale, determined by the total installed capacity of all thermal power plants within a specified radius of each county center. As shown in Columns (7) and (8) of Table 4., counties with a higher intensity of power plants suffer more severe negative impacts on the wheat sown area. This finding suggests that larger-scale thermal power plants lead to increased groundwater consumption, thereby intensifying the impact of groundwater shortages on wheat sown areas. These observations are in line with Howells et al. (2013) [8] and Qin et al. (2019) [6]. Energy-intensive regions inflict more harm on agricultural production.
Mechanism Detected
In light of the implications that thermal power plants have significantly negative impacts on wheat sown areas, we explore the mechanisms driving this impact. As previously mentioned, thermal power generation requires a substantial amount of water resources, which in turn affects the availability of water for wheat growth. To investigate this channel, it is crucial to quantify changes in local water consumption to discern whether increasing thermal power generation intensifies water resource scarcity.
However, there are data limitations in accessing records of groundwater consumption by thermal power plants. Therefore, we use data from satellite imagery, which provides weekly data on the groundwater percentile for each county from 2005 to 2016. The county-level panel data reflects the average groundwater percentile during the wheat growing season. We use an empirical model similar to Equation (1), but with the dependent variable being the groundwater percentile during the wheat growing season9.
Table 5.
Effects of thermal power plants on groundwater during wheat growing season.
[i] Notes: Standard errors are clustered at the county and city-year levels. Weather variables include average precipitation, temperature during wheat growing season.* p<0.1, ** p<0.05, *** p<0.01. The number of observations in Column (6) is reduced due to missing values in the groundwater level data.
As shown in Columns (1)-(5) of Table 5., the groundwater percentile function results are consistent with our previous assumptions, and thermal power plants significantly decrease the groundwater percentile during the winter wheat season. Given the high correlation between water usage in cooling systems and the scale of thermal power plants, we replace the number of thermal power plants with their installed capacity in our model. The results are consistent with our main findings (see Columns (1)-(5) of Appendix Table A4).
We enhance our analysis by incorporating data on groundwater levels to evaluate the impact of thermal power plants on the utilization of groundwater resources10. As illustrated in Columns (5) and (6) of Table 5, there is a discernible negative relationship between thermal power plants and groundwater levels during the wheat growing season, with statistical significance at the 5% level. We further utilize the installed capacity of thermal power plants as a principal explanatory variable, reinforcing the consistency and significance of our findings (Column (6) of Appendix Table A4). Although the dataset has its limitations, the results convincingly demonstrate the adverse effect of thermal power plants on groundwater resources.
Overall, the significant reduction in groundwater percentiles during the wheat growing season, primarily due to the increased demand for cooling water by thermal power plants, coupled with a decreasing trend in the availability of irrigation water, underscores the potential need to reduce the crop sown area or adjust cropping patterns. These adjustments are essential for managing regional water resources and enhancing the efficiency of agricultural water use.
Discussion
From a methodological perspective, prior research has predominantly focused on factors influencing grain production, including manageable aspects like agricultural management practices, crop variety selection, and inputs, as well as uncontrollable variables such as climate change. Nevertheless, there is a notable lack of quantitative studies on the impact of energy sector expansion on grain supply. This gap highlights the need to integrate socio-economic, climatic, resource, and environmental factors, considering market dynamics, technological progress, and the significant influence of energy sector evolution on crop production. Although ecological experiments can replicate environmental challenges such as droughts and water scarcity attributed to the energy industry, the intensity of these simulated conditions often exceeds that of real-world scenarios [47]. Moreover, these experiments often overlook the economic rationality of farmers in grain production. Farmers adopt adaptive strategies in response to cropping patterns to mitigate the adverse effects of resource and environmental limitations on crop production.
This study integrates considerations of energy industry development, natural, and socioeconomic factors, along with farmers’ adaptive behaviors, within the FEW nexus framework. It aims to investigate the intricate interplay among food production, the energy sector, and water resource management. This approach underscores the value of interdisciplinary research in addressing complex socioeconomic challenges. Current research in this interdisciplinary domain focuses primarily on how air pollution and climate change affect crop yields. However, it largely overlooks cross-sectoral competition for resources between the agriculture and energy sectors. Focusing on grain supplies, this study aims to elucidate how energy sector expansion affects wheat sown areas and the adaptive strategies of farmers facing resource and environmental limitations. It aims to offer theoretical underpinnings for the development of agricultural and environmental policies.
Conclusions and Policy Implications
The availability of groundwater has undeniably positioned itself at the nexus of agricultural production and energy supply, given its indispensable role in driving food and energy security. As the contemporary era witnesses a surge in industrialization and urbanization, the persistent dilemma of water scarcity is increasingly evident. This leads to intense competition for water resources across different sectors, particularly between agricultural irrigation and the cooling systems of thermal power plants. Utilizing county-level panel data on wheat production and groundwater percentile from North China, we underscore the intricate interplay between thermal power plants and wheat sown area.
This study examines whether the proliferation of thermal power plants has been accompanied by a discernible reduction in wheat sown area, with groundwater scarcity standing out as the primary causal mechanism. The results reveal that an additional thermal power plant results in a 2.8% reduction in wheat sown area. In particular, the adverse effects are more pronounced in regions with scarce surface water, high irrigation rates, or a high density of large-scale thermal power plants.
The study explores how cross-sectoral competition for groundwater and varying cropping patterns influence the food-energy-water nexus. To ensure sustainable development in both the energy and agricultural sectors, policymakers and stakeholders must focus on implementing specific strategies and frameworks. Understanding the logic and dilemmas in farmers’ adjustments to production inputs and cropping patterns is essential to balance the supply and demand structure of crops and to promote the production of economic crops. Investing in high-quality grain seed research and development is essential for enhancing grain production efficiency. By focusing on cultivating grain varieties suitable for saline-alkali soils and drylands, this approach not only facilitates agricultural structural adjustment but also secures food security without necessarily expanding the sown area.

