

Introduction
As the world progresses towards carbon neutrality, there is more demand than ever for innovative, efficient, and sustainable energy solutions [1-4]. Green hydrogen represents a viable substitute that has captured international attention [5]. Green hydrogen, which is created by electrolyzing water to separate its hydrogen and oxygen, is in high demand in the technologically advanced and electrified world. The “green” designation denotes using renewable energy sources, such as solar or wind power, to execute this method [6]. This sets it apart from the “blue” and “gray” hydrogen versions, which are generated by natural gas or fossil fuels and produce a large amount of carbon dioxide (CO2) emissions. A simple flow chart of the green hydrogen production process is presented in Fig. 1.
The impact of green hydrogen production on the environment is minimal compared to other energy sources and elements [7]. Another advantage of adopting green hydrogen is its availability. Hydrogen is considered the universe’s simplest and most abundant element [8]. The only obstacle is that it usually exists in a solid form; therefore, conversion to a gas form is required. At present, although the cost of producing green hydrogen is high, with the advancement in technology and cheaper resources for production, the cost is declining. It is expected to decline further with advancements in technology related to hydrogen production [9].
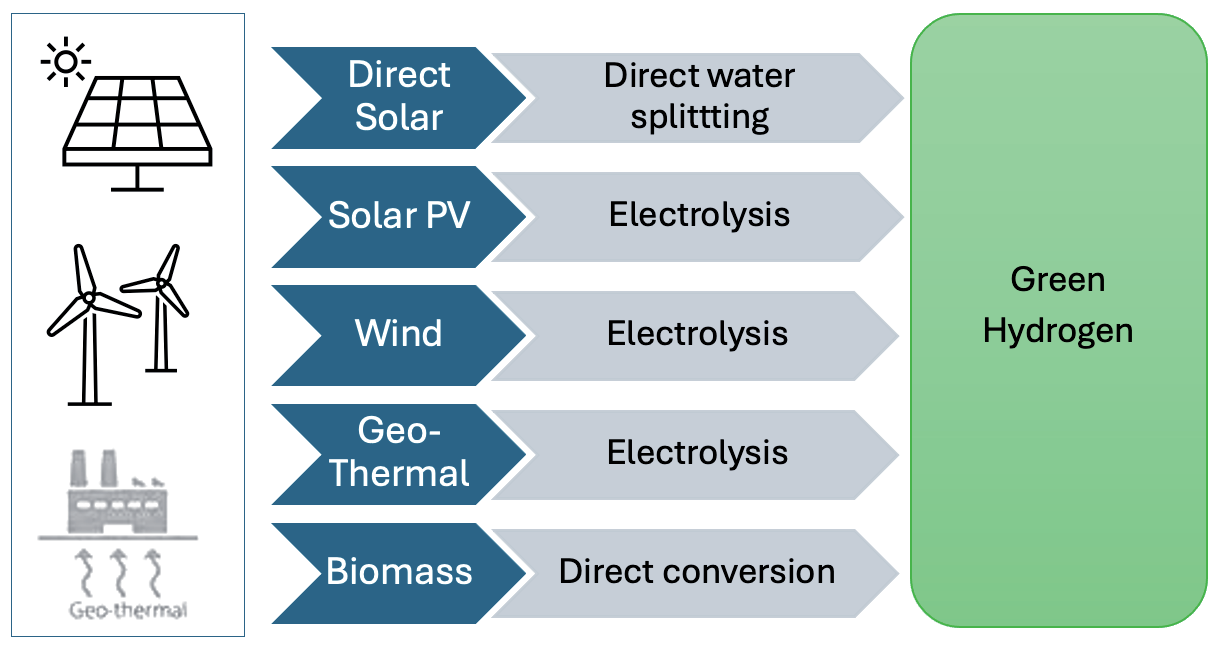
Fig. 2.
Green Hydrogen Infrastructure Projects (Operational, Under Construction, Feasibility Study) (Source: Authors using IEA data with built-in function on Microsoft Office).
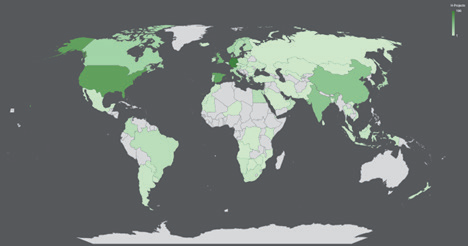
Recent trends show that more and more countries are engaged in implementing and promoting green hydrogen infrastructure projects (Fig. 2). According to reports, the contribution of green hydrogen in addressing decarbonization will reach 20% by 2050 [10]. A total of 1979 green hydrogen projects are operational or under construction, or feasibility studies have been conducted in different parts of the world [11]. A total of 281 projects were fully operational as of 2022. Green hydrogen also presents significant opportunities for developing nations to achieve decarbonization and carbon neutrality [12]. Fig. 2 shows the number of operational and under-construction or feasibility study projects in different countries worldwide. It can be seen from the Fig. 2 that North America, Western Europe, and Asian nations, including China and India, are focusing on green hydrogen infrastructure projects. Given the populations of China and India and their contributions to addressing climate change, Fig. 2 presents an optimistic approach by these countries against emissions for the future and sustainability of the planet.
Globalization and economic regionalization are embedded in the concept and implementation of Chinese investments and projects [13]. Infrastructure projects like green hydrogen infrastructures can contribute to enhancing socio-economic and eco-innovation trade between nations. Infrastructure development in the main sectors, including socio-economic and geo-political aspects, is very crucial in terms of attaining future sustainable development goals of world regions [14, 15].
China is at the forefront of combating climate change and moving toward a low-carbon economy. With projects based on a vast network of commerce routes, infrastructure projects, and diplomatic contacts, China is uniquely positioned to spearhead the shift to green hydrogen as a sustainable and clean energy source. Investigating China’s eco-friendly policies and investments in green and renewable technologies, including green hydrogen infrastructure projects, can pave the way for other nations to adopt green and eco-friendly policies. The outcomes of this research will provide the basis for the better implementation and execution of future projects that ensure environmental protection and sustainability. Based on the role of China in terms of green energy transition and the impacts on the environment through reductions in emissions, the research aims to:
Assess and investigate the impacts of deploying green hydrogen infrastructure on carbon, sulfur, and nitrogen emissions in different provinces of China.
Analyze regional heterogeneities in terms of the impacts of green hydrogen infrastructures on emissions.
Provide evidence on the relationship between green hydrogen infrastructures and consequences for the environment and advocate policies to advance green hydrogen infrastructure and technology to battle climate change and attain carbon neutrality.
Although several qualitative studies have focused on the relationship between green hydrogen and CO2, literature studies have failed to provide empirical studies, which can be largely attributed to the novelty of the technology and the lack of empirical data. This study attempts to fill the gap and provide empirical evidence on the impact of green hydrogen infrastructure on different climate change emissions, which we believe is the first study to do so. Thus, the research aims to provide practical recommendations to policymakers, industry stakeholders, and international groups that seek to promote renewable energy resources for sustainable development and regional collaboration by addressing the relationship between green hydrogen technology and climate change.
The rest of the paper is divided into different sections following the introduction. The following Section is the literature review and provides studies and work of previous and contemporary research related to green hydrogen development and processes. “Material and Methods” Section illustrates the methodology for estimating the results, including data collection, model specification, and framework. “Results and Discussion” Section presents the research results and explains the estimations along with detailed discussions. “Conclusions” Section summarizes the main conclusions, limitations of the study, and future research directions.
Literature Review
Several paradigms, theories, and instruments exist in terms of socio-economic and environmental indicators to help promote sustainable development and sustainability [16-19]. Major projects and infrastructures have significant environmental and human health impacts [20]. In this sense, green hydrogen energy can play a key role in environmental protection and addressing climate change by reducing carbon emissions. Studies have also highlighted the importance of green hydrogen in transitioning to a carbon-neutral economy [21, 22]. Green hydrogen technology can also act as a catalyst for green innovation and reduce the cost of production to make the technology more affordable and easily accessible on a broader scale. Green hydrogen not only mitigates the effects of climate change but also strengthens energy resilience and supports local industries in several nations, presenting favorable prospects for a low-carbon economy [23, 24].
At a global level, the transition to green hydrogen aligns with sustainable development goals and the achievement of carbon neutrality by shifting away from fossil fuels [24, 25]. In terms of net-zero carbon emissions, green hydrogen derived solely from renewable sources is the only type of fuel that can be classified as zero-emission fuel [26]. Green hydrogen complements technologies such as solar, wind, and electrification. Other energy sources may have higher costs, efficiency, scalability, and suitability for different industries in terms of transportation and heavy manufacturing than green hydrogen in the future, allowing green hydrogen to be more effectively positioned in the broader context of decarbonization. This also reinforces the need to integrate national plans with China’s decarbonization objectives, as it provides a viable solution and sustainable practice toward the green economy goal and carbon neutrality by 2030.
Some pieces of literature have argued that to achieve decarbonization at industrial levels, integrating green investments and finances into different industries can substantially transform the industries towards sustainable production and practices [27]. Das (2023) and Butturi and Gamberini (2022) reported similar outcomes of reduced emissions in the transport sector and decarbonizing industries [28, 29]. Scholars have also highlighted the importance of innovation in green technologies and transitioning to green technologies, including carbon storage and hydrogen-based technologies, in addressing carbon emissions and achieving sustainability [30-32]. Green hydrogen may replace fossil fuels as a feedstock or energy source, significantly reducing emissions where other renewable energy sources might not be feasible.
The role of government policies and infrastructure development cannot be ignored. The current shift and urgency towards decarbonizing energy systems and technologies has prompted world leaders to accelerate investments in green technologies and deploying hydrogen-related infrastructures [33]. As evident from previous research, developing green infrastructure, urbanization policies, and strict environmental regulations and taxation may reduce carbon emissions [34]. Similar policies and strategies, including the promotion of a green financial system and green credit availability targeted at innovation in green technology, have also significantly reduced carbon emissions [35]. In addition, trade policies and regulations related to carbon emissions and technological advancements in trading nations are also recognized as effective mechanisms to control and check global carbon emissions [36]. Investments and incentives for developing green hydrogen production technologies are crucial to support the shift towards a low-carbon economy and decrease the environmental impact of industrial operations [37].
On a broader level, previous studies have also emphasized the correlation between green infrastructure and social services, such as human health and environmental services, offering a more comprehensive view of the advantages of sustainable infrastructure [38]. Although previous scholarly works, such as the study conducted by Anderson and Gough (2021), highlight the significance of green infrastructure in mitigating the effects of climate change, there is a necessity for more focused investigations into the precise role that green hydrogen infrastructures play in broader decarbonization initiatives [39]. This more comprehensive perspective may be included in research that specifically examines green hydrogen infrastructure. Although a significant amount of literature is available on green infrastructure and the adoption of green hydrogen, there is a lack of thorough and empirical research that specifically examines the impact of green hydrogen infrastructures on carbon emissions reduction.
There are several gaps in the literature despite the rising interest in both green hydrogen infrastructures and their impacts on CO2 emissions. Empirical studies that explicitly investigate the impact of green hydrogen infrastructures on emissions are scarce. Most current research is focused on conventional energy infrastructure projects; however, there is a lack of focus on the potential of green hydrogen to improve sustainability and encourage the transition to clean energy [40]. Similarly, investments and green infrastructure projects, including green hydrogen infrastructures, which China has initiated as part of its decarbonization strategy, need thorough research, as studies in this regard are scarce. This study will contribute research using the DID approach to fill these gaps and determine the impact of green hydrogen infrastructure on CO2, SO2, and NOx emissions in different provinces of China.
There is a general need to address the urgent energy and environmental issues that China and other nations face in the twenty-first century, as well as to ignite fundamental shifts, encourage sustainable and equitable growth, and increase integration and collaboration between different regions in China and other countries. In this regard, adopting green hydrogen infrastructures, along with green technology innovation and investment policies, is crucial in global efforts to reduce carbon emissions and transition to a sustainable, low-carbon economy.
Materials and Methods
The main goal of the research is to investigate whether green hydrogen infrastructures contribute to reducing CO2 emissions and SO2 and NOx emissions in different provinces of China after implementing a carbon action plan in 2015. Using 2015 as a baseline, the analysis captures the early effects of these policy changes and provides a useful time frame for evaluating the benefits of a green hydrogen infrastructure on emissions reductions. This is particularly noteworthy since it symbolizes the first wave of green energy projects and provincial decarbonization promises. The study uses operational green hydrogen infrastructure as a driving factor in the process. For estimation and model specification, based on the relevant data, this study adapts a quasi-natural experiment based on the DID approach for Chinese provinces.
Data Collection
The model uses secondary data for the analysis of the model. Data are used from a panel consisting of 31 provinces in China from 2004-2022. We target official websites and open-access online resources for data collection. The data related to hydrogen infrastructure projects is accessed through the databank on the International Energy Agency (IEA) website [11]. Fig. 3 shows the specific provinces in China with operational green hydrogen infrastructure projects. It can be observed that the projects are concentrated in the northern regions but spread across east to west of China. The provinces with operational green hydrogen infrastructure projects include Hebei, Henan, Gansu, Inner Mongolia, Shanghai, Shanxi, and Xinjiang.
Data related to socio-economic indicators at the provincial level for all 31 provinces of China is collected from the official website of the National Bureau of Statistics of China [41]. For national-level data, both NBS China and the World Bank Development Indicators (WDI) database are accessed [42]. As controls for regional heterogeneity, dummy variables are also created. All variables are chosen based on their relevance and literature studies. The details of the variables, including the dependent and independent variables, are provided in Table 1.
Model Specification
The study adopts a difference-in-difference (DID) approach to estimate the model [43]. One of the most often used techniques in the social sciences for determining causal effects in non-experimental contexts is differences-in-differences (DID). In a regression model, DID is typically used as an interaction factor between the time and treatment group dummy variables. For estimations, we utilize China’s carbon action plan and provinces having operational green hydrogen infrastructure as the treatment group, while the rest are the control group. Since the commencement of the 12th Five-Year Plan period (2011-2015), China has included binding objectives for lowering carbon intensity in the framework of plans for national economic and social growth [44, 45]. According to the State Council Information Office of China, in 2015, the government of China set its nationally determined action objectives of reducing carbon emissions by 2030 [46]. Since then, the government of China has implemented and adopted policies that have focused on achieving carbon neutrality through reduced emissions and addressing climate change. Different provincial governments adopted policies based on local requirements to implement and achieve the set objectives under the government action plan. Among the projects, green hydrogen infrastructure and units were introduced and implemented in different areas. Therefore, it is arguable that although different provinces implemented the policy, the tools and measures used by the provinces were different. Therefore, it is assumed that in this regard, provinces having operational green hydrogen infrastructure projects showed higher commitment (technological advantage) compared with the provinces that did not adopt green hydrogen infrastructures or technologies. By 2015, some provinces had already initiated and completed operational green hydrogen infrastructure projects. Therefore, for the estimates, 2015 is the base year, given some provinces’ operational green hydrogen infrastructure projects. Based on the provinces of China, we divide the provinces into two distinct groups: one exposed to the treatment (Operational Hydrogen Infrastructure Project in 2015) is the treated group, and the second without the treatment (No operational Hydrogen Infrastructure project in 2015) is the control group. For the DID estimations, we estimate the following model:
Fig. 3.
Green Hydrogen Infrastructure Projects in China-2015 (Source: Authors using IEA data with built-in function on Microsoft Office).
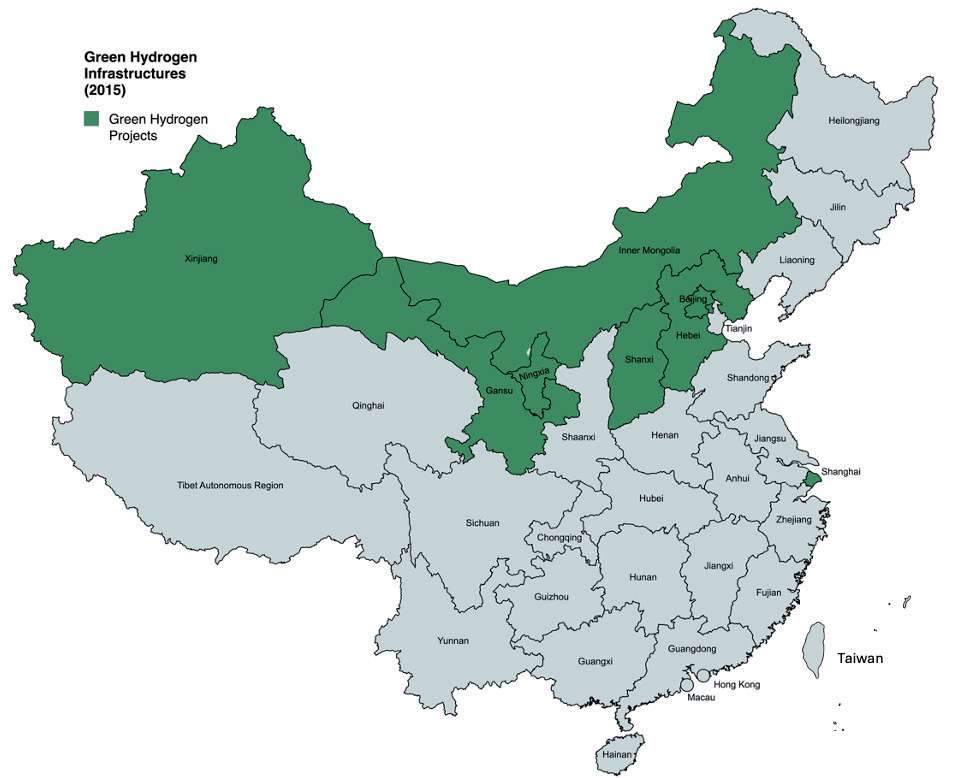
Table 1.
Explanation of variables and sources.
Where co2 is the dependent variable and stands for carbon emissions by province, which is the proxy for climate change, we generate two dummies—time and treated. The time dummy is 0 for all years before 2015 and 1 otherwise. Also, the dummy is 0 for the control group and 1 for the treated group (provinces with operational hydrogen infrastructure in 2015). Xk,i is a vector of our control variables, which included heterogeneity and robustness controls in the estimations. εi denotes the error term in the model.
For estimations, the study assumes that provinces with operational green hydrogen infrastructure projects emit fewer emissions, including CO2, SO2, and NOx. For this purpose, the study uses panel data from 31 provinces of China from 2004-2022. Based on the DID approach, a treatment group and a control group are selected [47]. As a treatment group for the green infrastructure, the study takes 2015 as the year of treatment, where the green hydrogen infrastructure in the treatment groups was operational. At the same time, the rest of the provinces were utilized as the control group, which did not have operational green hydrogen infrastructures by 2015.
Table 2.
Descriptive Statistics.
Results and Discussion
Table 2 provides descriptive statistics and a summary of the main variables used to estimate the model. The mean values of carbon, sulfur, and nitrogen emissions were 53.043, 51.104, and 272.3, respectively. The mean value of nitrogen emissions is higher compared to carbon and nitrogen emissions. The mean values, standard deviations, minimum values, and maximum values of the control variables and demographic variables, including trade, per capita GDP, population, investments, and government expenditures, are also presented. The average value of the local government spending in terms of agriculture, forestry, and water conservancy is higher as compared with the average value of government spending in terms of science and technology and the environment for our sample, which can be attributed to the proportion and scale of the projects in the relevant sectors where agriculture, forestry, and water conservancy require a larger scale of intervention and are more directly related to the communities in the regions. The standard deviations for population and per capita GDP suggest regional disparities and heterogeneity between the income levels and populations in the sample. The value for green hydrogen infrastructure is 1 for provinces with operational green hydrogen units and 0 otherwise. Location has values between 1 and 3, where 1 represents provinces located in the eastern region, 2 for the central region, and 3 for the western region of China. The total number of observations for each variable is presented, with 589 being the highest and 372 being the lowest.
Difference-in-Difference Regression
We run the DID regression based on three emissions: CO2, SO2, and NOx. The regression’s outputs are reported in Table 3. Columns (1), (3), and (5) show the estimates without control variables, while Columns (2), (4), and (6) represent the results with the control variables added.
The estimates for all three emissions suggest that the impact of green hydrogen infrastructure is negative and significant after 2015. The negative sign shows that provinces with operational green hydrogen infrastructures after 2015 had negative and significant impacts on CO2, SO2, and NOx emissions. The negative impact is highest for CO2 emissions (-0.56), followed by SO2 emissions (-0.405), and then NOx emissions (-0.19). These results suggest that China’s policies after 2015, especially in the provinces with operational green hydrogen infrastructure projects, are estimated to significantly reduce CO2, SO2, and NOx emissions compared to other provinces. In addition to other renewable energy sources, the transition to green hydrogen infrastructure projects may provide an alternative path to achieving carbon neutrality and sustainable development goals.
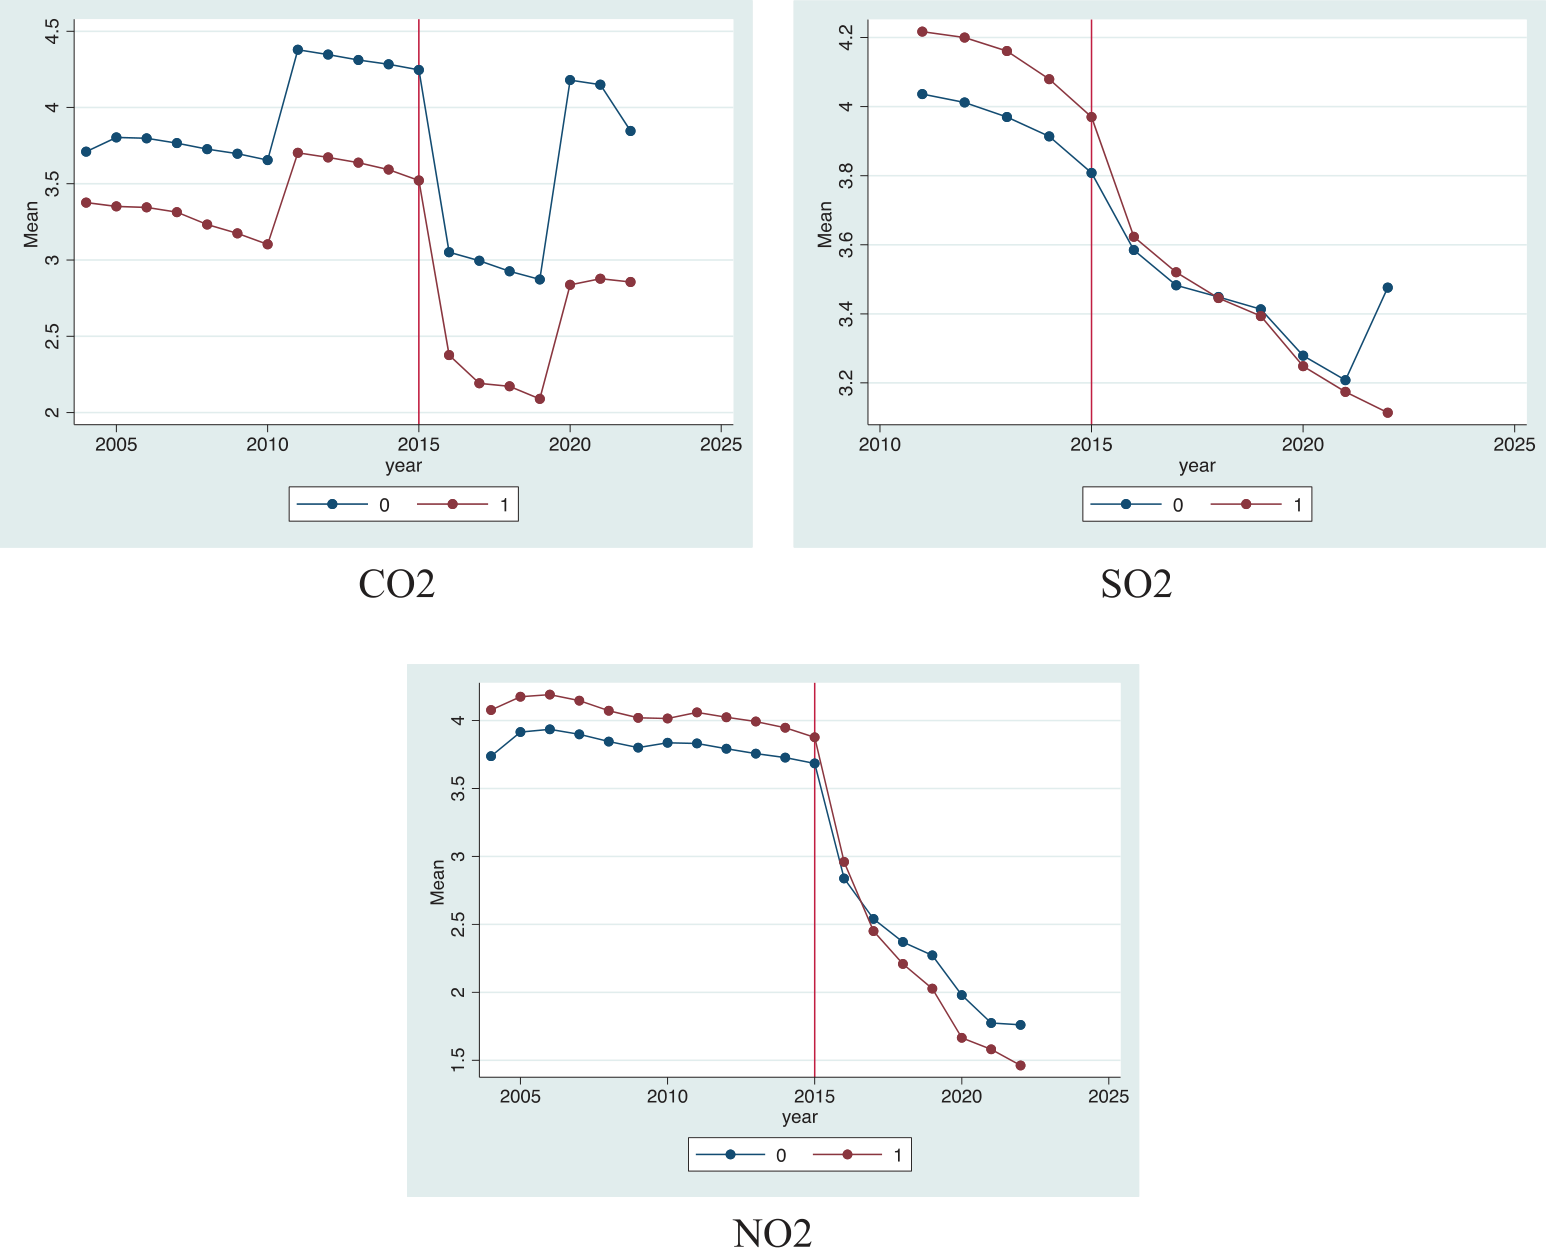
Post-estimation for the DID estimations is run using parallel trend plots. Parallel trend plots provide a graphical representation of the trend in the treated and untreated groups before and after the intervention. We plot the DID regression estimates for the overall model based on CO2, SO2, and NOx emissions. Fig. 4 shows the trends in CO2 emissions for all provinces of China from 2004-2022. It can be observed that the outcomes followed a parallel trend before 2015 for the groups. After introducing reforms and operations of green hydrogen projects, we see a change in the trends between the two groups. With 2015 being the year for environmental policy shifts and operational green hydrogen infrastructure projects, it can be observed that there is an overall steep decline in CO2 emissions after 2015. In particular, in the case of provinces with green hydrogen infrastructure projects, the reduction in CO2 emissions continued significantly more than the rest after 2015, and by 2017, the emissions were lower than the rest of the provinces. The gap between the two groups widened after 2020, suggesting the impacts of COVID-19 lockdowns on the overall emissions. Xu et al. (2024) also highlighted a similar increase in overall CO2 emissions after 2020 in China, pointing out a rapid expansion of exports, driven by epidemic prevention materials and “stay-at-home economy” products being the key drivers of the CO2 emissions [48]. By 2022, there was a slight increase in emissions for provinces without green hydrogen infrastructure, but the trend continued to decrease for provinces with green hydrogen infrastructure projects. Similar parallel trends before 2015 can be observed in the case of SO2 and NOx emissions, which started to deviate from the parallel trend afterward, suggesting significant impacts of the green hydrogen infrastructures and policy reforms in 2015 and onwards. It can also be observed that the gap between the treated and untreated provinces in the case of SO2 and NOx emissions increases further after 2020.
Table 3.
DID Regression-CO2, SO2, and NOx
Table 4.
Region-wise DID Regression Estimation for CO2.
Here, it is important to note that the diverse impacts of COVID-19 were felt across the globe because of lockdown measures, which led to the shutdown of factories and disrupted the supply chains. Similarly, China was under lockdown for the first quarter of 2020 and opened afterward. The increase in CO2, SO2, and NOx emissions after the lockdowns can be attributed to various factors; one may be due to a sudden increase in demand in other countries that remained locked down while China opened its factories and production units as it was producing and supplying not only general tradable goods but also medical supplies to cope with COVID-19. Another may be due to supply chain disruptions, and recovery trends may have contributed to the sudden emissions.
We also used a parallel trend test to assess this assumption further. The result with a Prob > F = 0.725 indicates insufficient data to refute the parallel-trends’ null hypothesis, and thus the parallel-trends assumption is accepted. Furthermore, the Granger causality test is used to determine if the control or treatment groups alter their behavior in expectation of treatment. We lack sufficient evidence to reject the null hypothesis that there was no behavior change prior to treatment based on the test results (Prob > F = 0.6453). These results, along with our earlier diagnoses, imply that we may have faith in the accuracy of our DID estimations.
Robustness and Heterogeneity
To further validate the study’s outcomes, we checked the robustness and heterogeneity of the estimates based on three criteria: 1) We estimate separate models for CO2, SO2, and NOx based on provinces in three distinct regions of China, including eastern, central, and western regions. 2) We replace the population with GDP per capita (cgdp) to test the impact and robustness of the estimates. 3) We use robust standard errors for the estimations of each model.
Table 4 presents the estimates for the DID regression for CO2 based on Eastern, Central, and Western regions of China in Columns (1), (2), and (3), respectively. Estimates suggest a slight disparity in the three regions. All three regions experienced a decline in CO2 emissions because of the green hydrogen infrastructure and policies after 2015, as shown by the significant and negative signs for all three regions. As a result of the intervention, the decline in CO2 emissions in the eastern regions was higher, followed by the central and western regions. These outcomes may be attributed to the government’s key focus on the eastern regions, which included the main metropolitan areas with ports and higher population density, where the emissions were higher. Based on these estimates, it can be predicted that favorable policies coupled with green infrastructure projects like green hydrogen infrastructures can play a significant role in achieving decarbonization.
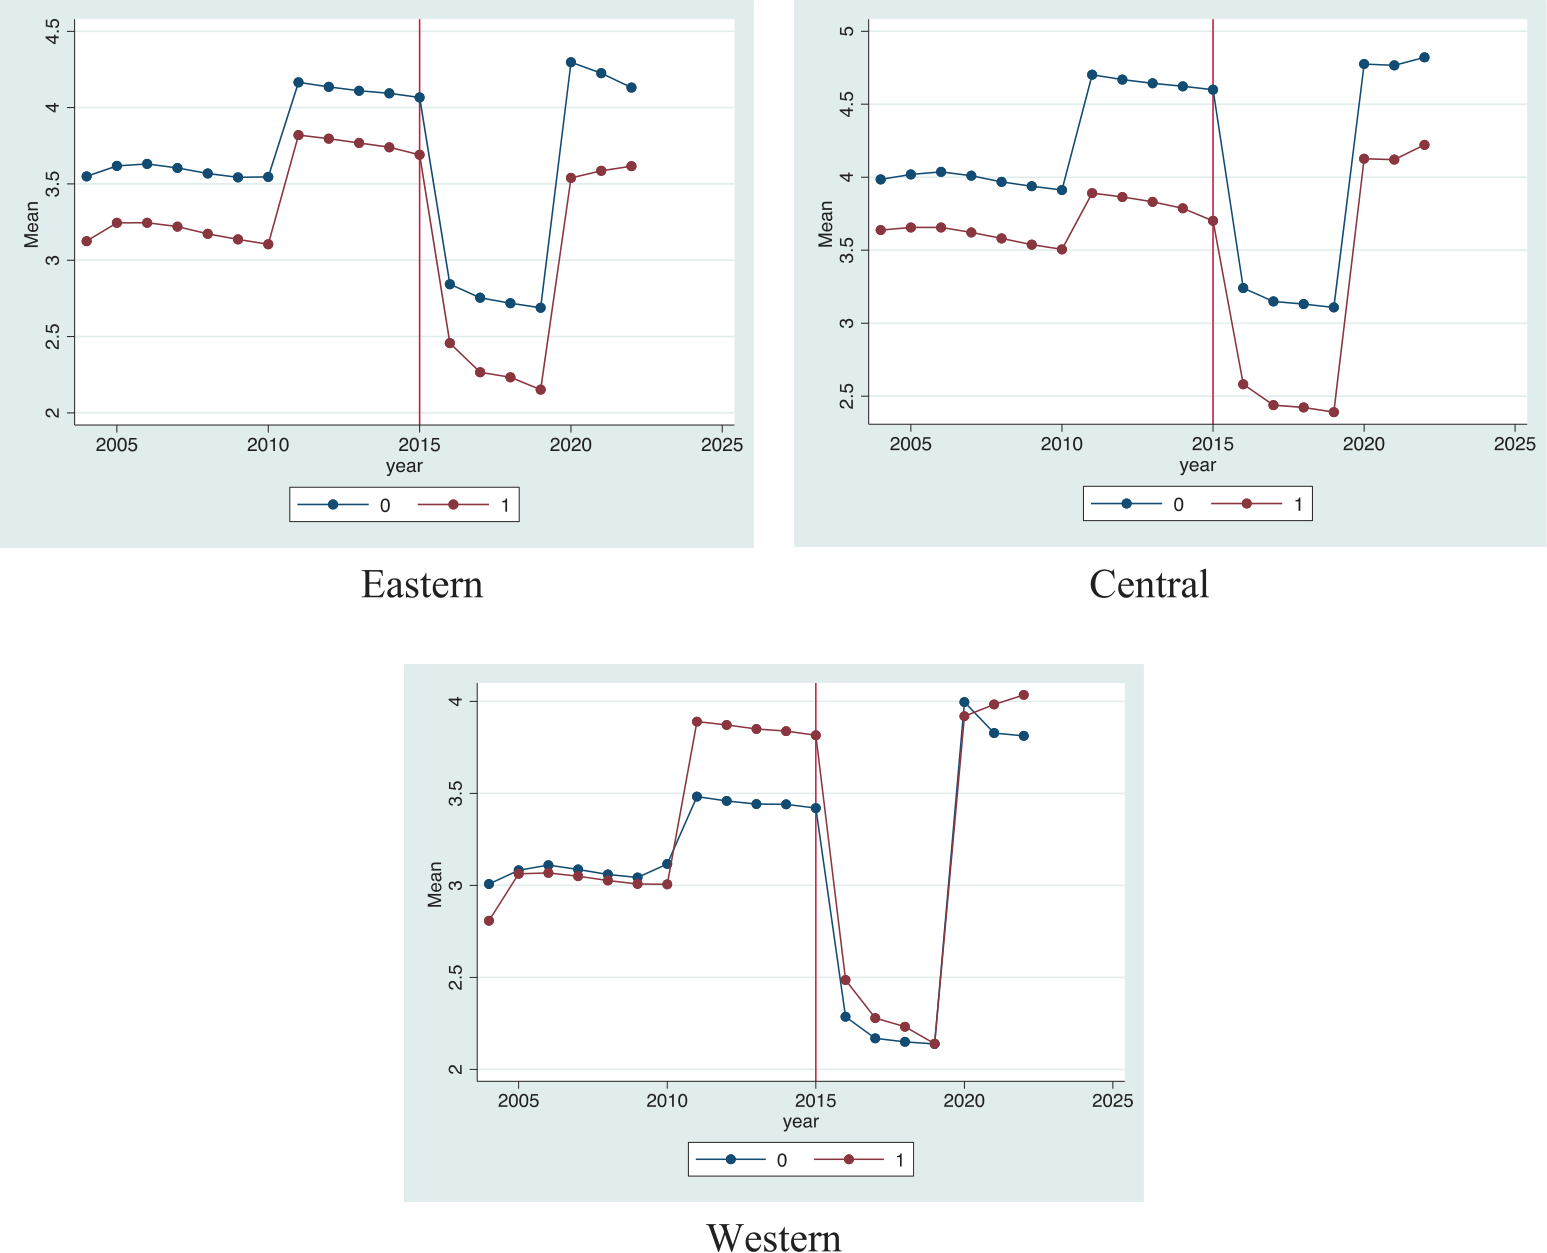
Fig. 5 highlights the trends of the regional DID estimates and provides further validation of the parallel trends before 2015 and deviation afterward due to the introduction of policy reforms and operational green hydrogen infrastructure projects. It is highlighted that post-2015, there is a decline in CO2 emissions for all three regions, which is predicted to result from green hydrogen infrastructure and policy intervention. However, CO2 emissions show a rise after 2020 but are still lower, especially in the eastern and central provinces with operational green hydrogen infrastructure, than in the provinces without green hydrogen infrastructure. Previous studies also predicted similar trends [49].
Table 5 shows the DID estimations for the Eastern, Central, and Western regions of China in terms of SO2 emissions. The estimates suggest the presence of regional heterogeneity in terms of SO2 emissions. The impact on SO2 emissions in the provincial operational green hydrogen infrastructure under the action plan of 2015 is highlighted as significant in the eastern region at a 1% level, significant at a 10% level in the case of central regions, while it is insignificant for the western regions of China. This heterogeneity suggests the differences in the geographical areas of China. The eastern region, which is more industrialized and economically developed, indicates a more substantial drop in SO2 emissions due to improved infrastructure and more complex implementation of environmental regulations [50]. In contrast, the western region’s insignificance may be attributed to its less established infrastructure and weaker concentration of green hydrogen projects compared to the eastern and central areas. Furthermore, discrepancies in regional economic trends and local government initiatives likely contribute to the observed disparities in SO2 emission reductions [51]. Other factors may include distinctions in socio-economic development, technical level, and energy systems in different regions, as presented in past studies [49, 52].
Table 5.
Region-wise DID Regression Estimation for SO2.
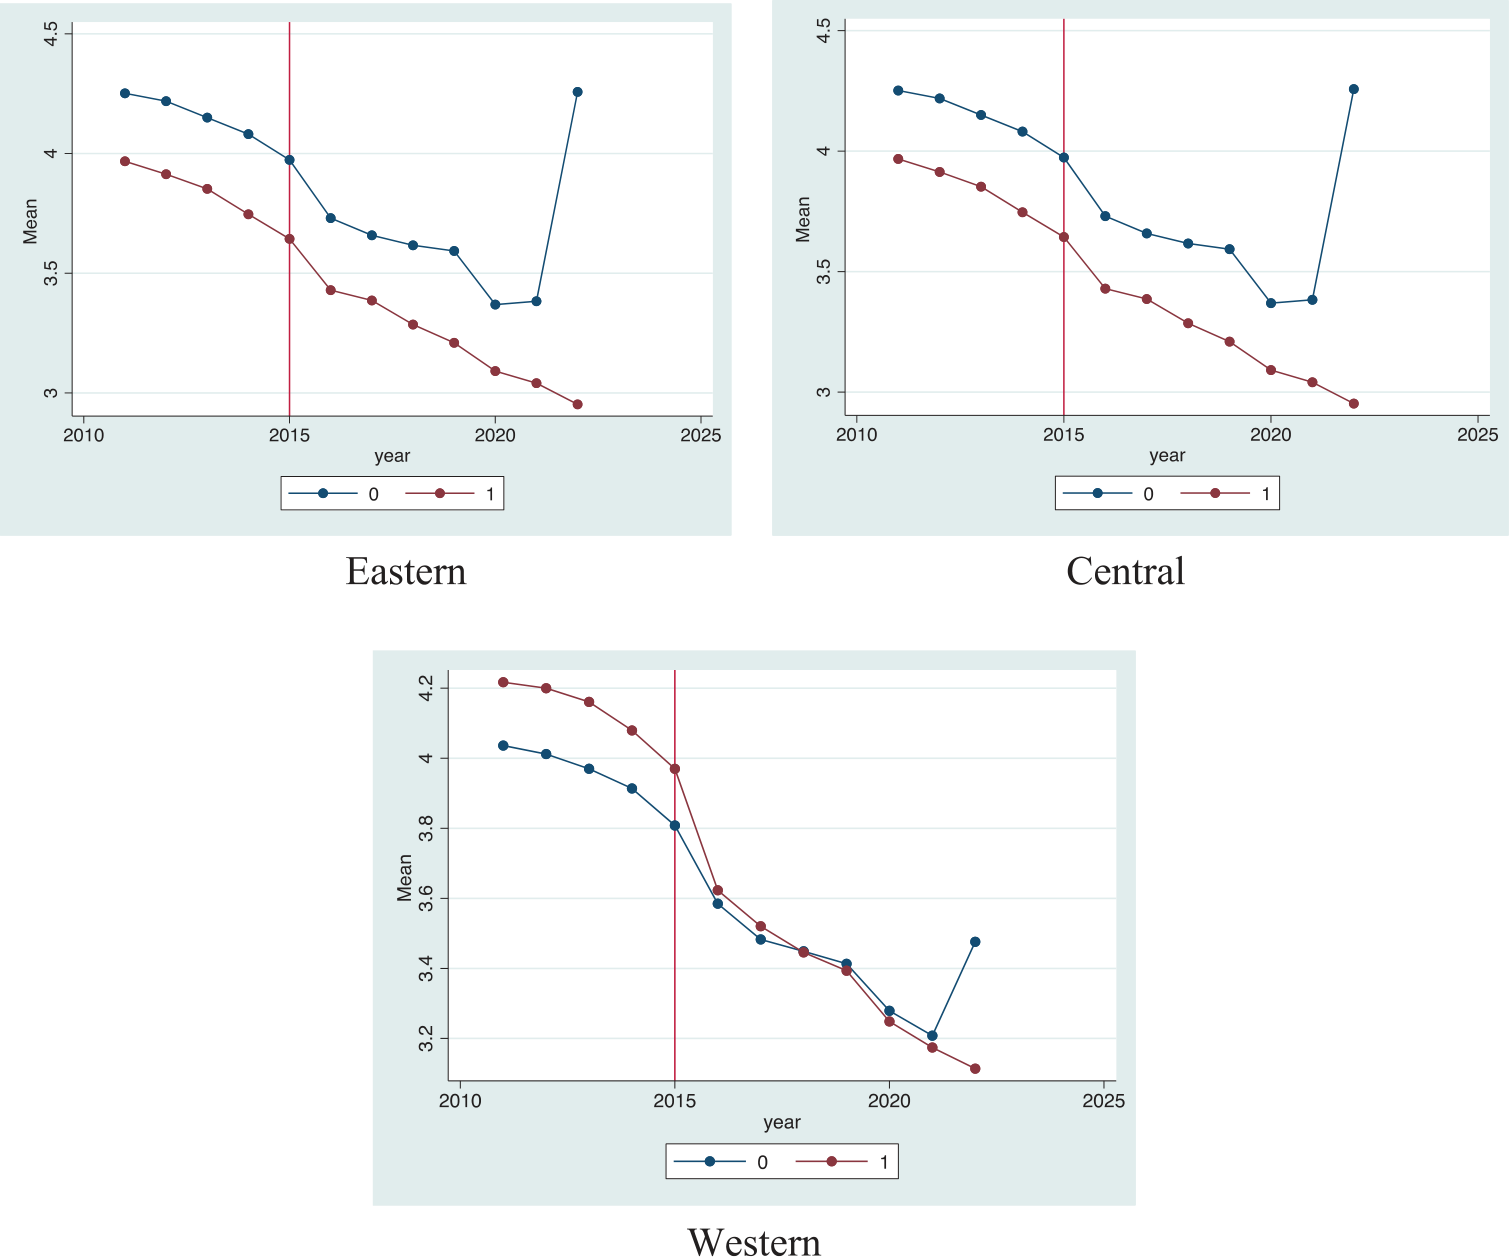
Following the trends of CO2 emissions, the parallel trend assumptions for SO2 emissions are also valid for the eastern and western regions before 2015, as highlighted in Fig. 6. Regional heterogeneity can also be observed in SO2 emissions between provinces possessing operational green hydrogen projects and those without green hydrogen projects. SO2 emissions in the treated group of provinces tend to decline at an increased level compared to the untreated group of provinces, evidenced by the increasing gap after 2015. Like CO2 emissions, the difference is noted to be greater after 2020, with the treated group showing signs of decline, while there is an increase in provinces without green hydrogen infrastructures and an even sharper rise after 2022 for all three regions. It could be argued that the sharp increase may be the result of countries opening after COVID-19 lockdowns, thus increasing demand and production.
The regional outcomes based on DID estimates in terms of NOx emissions are presented in Table 6. The regional heterogeneity is evident from the estimates. The results of the DID show that the western regions had a greater and significant decline in the case of NOx emissions, while the central provinces had lesser reductions with significance at a 10% level. For the eastern region, the decline was insignificant, suggesting that policy change and green hydrogen infrastructures did not contribute significantly to NOx emissions in the eastern regions. These findings indicate that western areas may have adopted more specific strategies to decrease NOx emissions, possibly due to increased expenditures on pollution control technologies [53]. However, the insignificant outcome in the eastern region might be due to the saturation of pollution control measures or the challenges in lowering NOx emissions in heavily industrialized and densely inhabited areas [54, 55]. The efficacy of environmental interventions can be greatly influenced by regional policy variances and local government activities, as seen by the disparities in effects observed between different areas.
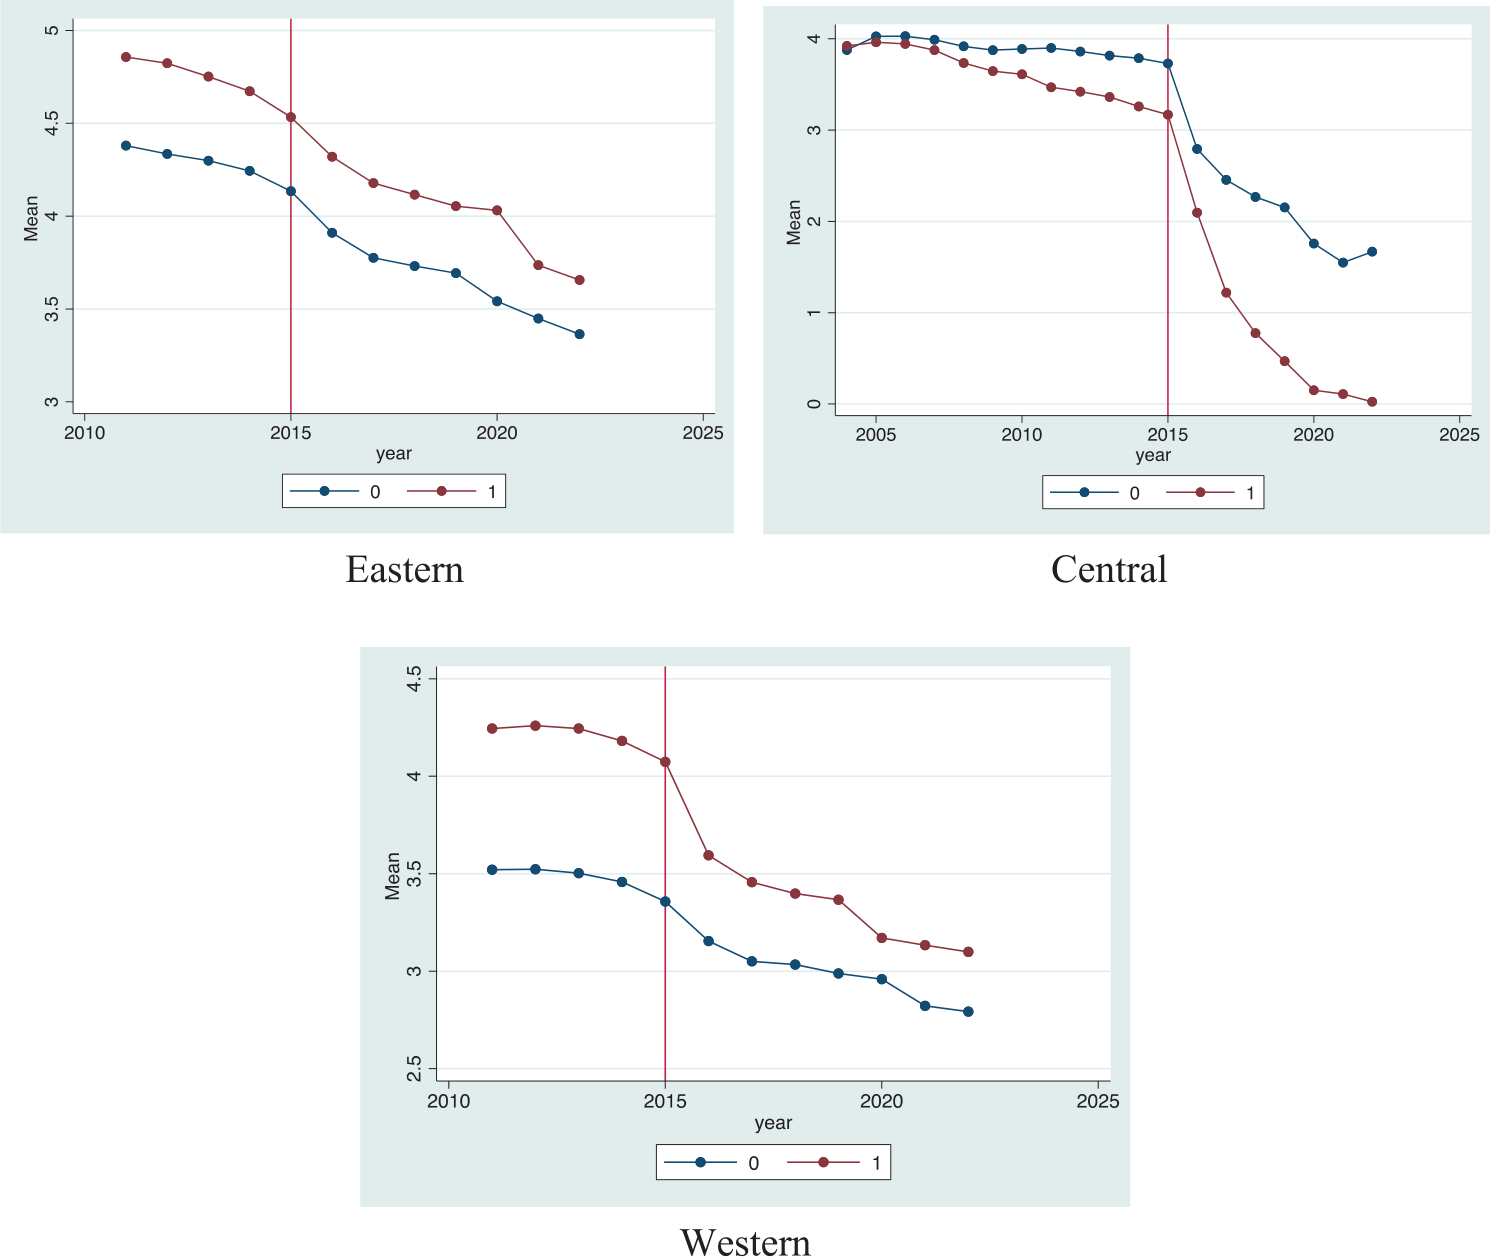
The regional heterogeneity is also evident in Fig. 7. Parallel trend assumptions are also followed for the three regions. In the case of the Eastern provinces, the blue line representing the untreated group is below the red line representing the treated group, indicating higher emissions in the untreated group. In the case of provinces located in the central and western regions, the treated lines are above the untreated groups, indicating a higher level of emissions, highlighting lower emissions in the untreated group of provinces. It can be observed that after treatment through the action plan of 2015, the NOx emissions in the treated group have declined drastically post-2015, as shown by the widening of the gap in the eastern province while the gap narrows for central and western regions. These outcomes further validate the outcomes of the DID model and provide evidence for the effectiveness of policy intervention and operational green hydrogen infrastructures in reducing emissions and decarbonization.
The outcomes of this study suggest that green hydrogen infrastructure can significantly impact emission reductions in China’s provinces. Devising policies targeted at decarbonization and projects based on renewable energy sources, including green hydrogen infrastructures, may have practical outcomes. China’s government can further enhance investments and cooperation in terms of green technology innovations and cleaner production alternatives using renewable energy sources.
The study has theoretical and empirical implications. This study highlights the importance of green hydrogen infrastructure in the broader context of sustainable development and environmental economics. It validates the concept that innovative approaches to energy may result in significant advantages for the environment, thereby verifying ideas that highlight the interdependent nature of technological innovation and the preservation of the environment. In terms of practical implications for policymakers, the study indicates that specific and targeted investments in green hydrogen projects might result in a notable reduction in adverse emissions, contributing to global efforts to reduce carbon dioxide levels and other emissions. China’s green hydrogen development might serve as a model for other countries experiencing comparable issues in attaining decarbonization and establishing sustainable energy infrastructure. China’s approach to finance, regional cooperation, and policy incentives may apply to other situations, particularly developing states. Moreover, the observed geographical differences suggest that adaptable and unique approaches, including local economic and policy conditions, are crucial for optimizing the impact of green hydrogen projects. By carefully directing investments to locations where they may have a significant impact, these insights can help drive future policy and advance the global objectives for combating climate change and transitioning to cleaner and sustainable energy sources.
Table 6.
Region-wise DID Regression Estimation for NOx.
Conclusions
Green hydrogen infrastructure and projects may be a viable alternative for decarbonization and efforts to tackle climate change. This study assessed the role of green hydrogen infrastructure in reducing emissions across China’s provinces using a Difference-in-Differences (DID) approach. The findings revealed that carbon reduction policies in China and implementing a green hydrogen infrastructure led to a significant decrease in CO2, SO2, and NOx emissions post-2015. The disparities are predicted to result from the differences in regional economic trends and policy interventions by local governments. Based on the outcomes of the study, policies regarding investments in green hydrogen infrastructures are encouraged to achieve carbon neutrality and address climate change.
Implementing policies related to decarbonization and environmental protection, coupled with projects and infrastructures that enable the use of renewable energy sources, including green hydrogen plants and projects, can support achieving sustainability and carbon neutrality. There is a need for countries, especially high-income nations, to provide support to low-income and emerging economies in transition to low-carbon economies through utilizing cleaner technologies and production mechanisms. In this regard, it is recommended that countries not only cooperate and invest in green technologies but also enable technology sharing and transfer to other transitioning economies. In addition, countries urgently need to invest in, develop, and enhance technologies, including green hydrogen technology, to reduce the cost of production and provide cheaper and more affordable renewable energy sources.
For research purposes, we used data from China, while for future research, panel data consisting of different countries and regions of the world will provide more dynamic and diverse research findings that can be generalized with broader implications. Researchers can also explore topics like the cost-effectiveness of hydrogen relative to other renewable energies or the social impacts of hydrogen adoption in local communities. Using alternative research methods like autoregressive distributive lag (ARDL) models may also provide further contributions to the short- and long-term impacts of green hydrogen infrastructure projects. Future studies may also focus on examining the long-term impacts and economic feasibility in terms of specific infrastructure needs, challenges, and opportunities associated with integrating green hydrogen technologies into existing green infrastructure frameworks.

