

Introduction
Water is a unique substance because it has the capacity to organically replenish and clean itself by allowing impurities to disintegrate or settle out (by the process of sedimentation) or by diluting them to a level where they are not at potentially harmful concentrations. This natural process, though, takes time, and it gets difficult when the water is tainted with an excessive amount of harmful substances. Additionally, humans are using more and more pollutants that pollute the drinking water sources. These are brought on by an excess of phosphorus in the water. There are several ways to define pollution. The quality of the water for other users is decreased when energy and other substances are discharged into it. Water pollutants are all waste materials that water cannot naturally break down. The two main causes of contaminated water are point sources and non-point sources. Point sources include factories, wastewater treatment facilities, septic systems, and other sources that are openly discharging toxins into water sources. Non-point sources are harder to find since they can't be tied to a single place. Silt, fertilizer, insecticides, and animal waste can all be found in runoff from farms, fields, construction sites, and mines. The majority of empirical research has looked at emissions that are caused by energy use. There aren't many studies or descriptions of industrial water contamination.
Water resources, water environment, and water ecology as components of a watershed must be properly managed in order to address the escalating problems of water pollution. In order to fully realize the comprehensive ecological service functions of rivers and lakes, comprehensive watershed water pollution control should take into account the basin as a whole, respect the natural laws of the river and lake system, and concentrate on the preservation and restoration of its natural ecological environment. In order to investigate the changes in the water environment and water ecology in the basin under various water pollution control schemes, this study established methods for the prediction and evaluation of watershed water pollution control schemes, based on the concepts of environmental capacity (EC) and environmental flow (EF). Since water is the most valuable natural resource, humankind is very concerned about its quality. However, in fast-developing nations like India, the unchecked expansion of rural and urban regions is compromising the quality of the water. This article critically assesses studies on river water contamination in India and overseas, revealing high levels of physical, chemical, and bacteriological pollutants from industries and other sources.
One of the most well-liked theories for illustrating the quality of a water resource is the Water Quality Index, which was initially proposed by [1]. Since it gives a precise and comprehensive picture of the degree of pollution in a water body, policymakers and other stakeholders frequently concur with this notion. In this study [2], the effects of agricultural practices and household pollution on the water quality in the Turnasuyu Basin were evaluated. In order to demonstrate how the surface water quality of the Hooghly River (physicochemical parameters, biological parameters, and dissolved heavy metals) had improved, [3] compared the data from eight monitoring sites taken before and after the shutdown.
[4] The most common WQI models, as well as their varied model topologies, components, and applications, are contrasted in this paper. Particular focus is placed on the parameterization of the models, techniques for generating the subindices, parameter weighting values, index aggregation functions, and sources of uncertainty. The models' accuracy issues are also explored. [5] Human activities have a detrimental effect on water resources, especially rivers, because the majority of industrial and agricultural districts are located near rivers. This is due to surrounding industrial and agricultural sectors contaminating river water.
Seagrasses have been termed "coastal canaries" because of their ability to integrate and respond swiftly and plainly to a variety of anthropogenic pressures [6]. Stress indicators include a decline in the number of species and a reduction in the size of the region. [7] The proposed model improves predicting accuracy. Data including monthly samples of several water quality characteristics were acquired at various locations around the Delhi region over 6 years (2013-2019). [8] This research examines water quality parameters in a case study of diverse Indian rivers during a five-year period from 2012 to 2016. [9] Industrial wastewater significantly deteriorates inland surface water quality, highlighting the effectiveness of AHP-based models and GIS techniques in assessing this impact. The study emphasizes the need for better management practices to protect water resources
The main objective of the current research is to use a novel Water Quality Index method based on the Analytic Hierarchy Process (AHP) approach to provide a clear understanding of receiving inland surface water quality in Kashipur city of Uttarakhand state, India, as a result of industrial discharges. [10] This study aimed to evaluate the performance of the water quality index (WQI) model in order to precisely describe coastal water quality using a novel categorization scheme. Ireland's Environmental Protection Agency (EPA) acquired information on Cork Harbour's water quality, which was then utilized in this research.
[11] examined the procedure(s) involved in WQI modifications for monitoring the water quality in Africa, looked at pertinent limitations, and provided ideas for improvements. An analysis of 42 research papers from five databases during the last ten years (2012–2022) was conducted. The Canadian Council of Ministers of Environment (CCMEWQI) and Weighted Arithmetic (WAWQI), according to the findings, were the WQIs that were most effectively modified. [12] This article evaluated the water quality and determined the percentages of potentially dangerous compounds that would need to be removed in order to make the water resources in Ojoto and its surrounds (Nigeria) safe for drinking. [13] The fuzzy inference system reveals critical insights into surface water quality for drinking purposes, indicating areas where contamination may pose risks to public health. This evaluation underscores the importance of systematic monitoring to ensure safe drinking water standards.
This project aims to develop a surface water quality indicator based on a fuzzy inference system. Three stations and ten parameters from Basin were utilized to create the approach. The [14, 15] review not only draws attention to the issue of water security, but also provides a broad overview of the methods for integrating geolocated qualitative and quantitative information into a WQI.
This study offers an index-based system for categorizing irrigation water quality. These indices are mathematical algorithms that translate information about the quality of the water into a numerical value that describes the quality of the water used for irrigation. [16] analyses a number of big data and machine learning-based prediction models for the evaluation and forecast of water. A variety of challenges and issues are looked at, and prospective solutions for a number of research issues are offered.
[17] In order to make computations easy and uncomplicated, this study tried to establish a particular index technique that would be applied for all water quality features independent of locations and water consumption.
Methods
Any water body's water quality management can be assessed by using the methods listed below.
1. Physical evaluation
2. Chemical evaluation
3. Biological evaluation
Physical Parameters
Different kinds of floating, dissolving, suspended, microbiological, and bacteriological pollutants are present in water. Physical tests should be conducted to evaluate the substance's color, temperature, pH, odor, TDS, turbidity, and other physical characteristics, while chemical tests should be conducted to evaluate the substance's COD, BOD, alkalinity, hardness, dissolved oxygen, and other characteristics. Only in industrialized nations are all these criteria carefully regulated. Due to the extremely low levels of organic and heavy metal pesticide contaminants found in water, highly specialized analytical equipment and skilled labor are required. The following physical and chemical criteria are routinely examined to check on the quality of the water.
EC (Electrical Conductivity)
Ten variables, including pH, total hardness, temperature, total solids, alkalinity, chemical oxygen demand, calcium, total dissolved solids, iron, and chloride content in water, all significantly correlate with conductivity. This revealed that managing water conductivity might be used to regulate water quality at other research sites. It also suggested that the subsurface drinking water quality of the study area could be efficiently checked. The resistance provided by the water between two platinized electrodes is measured using an EC meter. The instrument has known conductance values that are measured using a reference KCl solution.
Chemical Parameters
Carbon Dioxide
Since carbon dioxide is a byproduct of the breakdown of organic matter in almost all aquatic habitats, its fluctuation is widely employed to measure the net ecosystem metabolism. The properties that characterize the carbon dioxide system should therefore be measured in aquatic biogeochemical studies. CO2 is the principal greenhouse gas in our atmosphere. Total alkalinity (TA), total dissolved inorganic carbon (DIC), and pH (pCO2) are only a few of the parameters that may be easily evaluated in the aquatic carbon dioxide system. The pCO2 in surface water can be determined using the DIC CO2 and photometric methods utilizing a coulometer or an infrared CO2 analyzer. By titrating HCl against a water sample until it reaches the CO2 equivalency threshold, total alkalinity CO2 is calculated.
pH
The most crucial factor in determining how corrosive water is is pH. The pH value decreases as water becomes increasingly corrosive. Electrical conductivity, total alkalinity, and pH all had a favorable connection. Due to decreased photosynthetic activity, the incorporation of carbon dioxide and bicarbonates, and the subsequent rise in pH, low oxygen levels coincided with high temperatures during the summer. Numerous factors can cause a change in the pH of water. The higher pH values show that the carbonate-bicarbonate and carbon dioxide balance are more affected by the shift in physicochemical circumstances.
Dissolved Oxygen
DO is one of the most important variables. Both direct and indirect information, such as the accessibility of nutrients, bacterial activity, stratification, and photosynthesis, are provided by its proximity to a water body. Dissolved oxygen levels decreased throughout the summer as a result of higher temperatures and enhanced microbial activity. A rise in temperature and the duration of intense sunlight, which influences the percentage of soluble gases (O2 & CO2), cause the high DO in the summer. The long days and intense sunlight of summer seem to speed up the process of photosynthesis, in which phytoplankton convert CO2 into oxygen. The greater O2 quality readings taken in the summer may be due to this.
Alkalinity
The main components of alkalinity, which stabilizes pH, are carbonate (CO32-) and bicarbonate (HCO3-). pH levels, hardness, and alkalinity all affect the toxicity of certain chemicals in water. It is measured using a simple dil HCl titration with methyl orange and phenolphthalein as indicators. Oxygen and carbonate ions are the principal contributors to the alkalinity of boiler water. To stop corrosion in the boiler, boiler water must have hydroxyl alkalinity (causticity). Too much causticity can cause foaming and other operational difficulties. When the causticity values are too high, the boiler may experience an "embrittlement" caustic attack.
Bicarbonate
Additionally, methyl orange is used as an indicator during titration with standardized hydrochloric acid to measure it. Below pH 4.0, methyl orange turns yellow. The carbonic acid breaks down at this pH to produce carbon dioxide and water.
Carbonate
There are carbonates present whenever the pH reaches 8.3. By titrating with standardized hydrochloric acid and using phenolphthalein as an indicator, it is measured. Carbonates are transformed into an equivalent amount of bicarbonates at pH levels below 8.3. Additionally, the titration can be performed using a pH meter or a potentiometer.
Chemical Oxygen Demand (COD)
COD, which is determined in mg/L, is another sign of organic material contamination in water. The amount required to chemically oxidize the organic matter contained in water is known as the COD, or concentration of dissolved oxygen. COD and BOD are important measures of a surface water supply's environmental health. They are widely used to treat wastewater, but not usually to treat regular water.
Biochemical Oxygen Demand (BOD)
BOD, which is determined in mg/L, measures water pollution. BOD is the amount of dissolved oxygen required for the metabolic breakdown of organic materials and the oxidation of some inorganic compounds. Normally, the BOD test is conducted over a period of five days.
Ammonia (Nitrogen)
It can be found spectroscopically by using Nessler's reagent to produce a color complex at 425 nm light. Due to the hardness of the water, alkaline reaction conditions greatly inhibit the process.
Sulphate
It is measured using the nephelometric technique, which compares the turbidity concentration to a known concentration of artificially produced sulfate solution. Barium sulfate causes turbidity, which is produced by barium chloride. Turbidity is prevented from settling by a mixture of organic material (glycerol or gum acetia) and sodium chloride.
Biochemical Oxygen Demand (BOD)
BOD is a crucial metric used to research water contamination, just like DO. Any water body with a higher BOD value has more organic contaminants in the water. The following classifications of water quality have been made based on a five-day BOD test [66]. 1. If BOD level is less than 1 mg/L, very clean If the BOD level is 1.1 to 1.9 mg/L, clean. 3. Moderate pollution if the BOD level is between 2 and 2.9 mg/L. 4. Pollution if BOD is 3-3.9 mg/L. 5. Extremely polluted if BOD levels are 4–10 mg/L 6. Severe pollution if BOD Level is greater than 10mg/L If the BOD measurement is greater than 3 mg/L, water is often classified as contaminated. Any water body's BOD value rises as a result of the water's interaction with mining, industrial, urban, domestic, and agricultural effluents. The DO and BOD of any surface water body are generally inversely connected, meaning that the greater the value of DO for any water body, the lower the BOD, and vice versa. However, there have also been some observed variations, as listed below. While examining the water quality of the Salandi River over various seasons, it was found that both DO and BOD increase simultaneously during the wet and post-rainy seasons.
Physical-Chemical Study of a Sample of Indian Polluted Water
The study of physicochemical parameters is crucial to obtaining a precise understanding of the quality of water, and it allows us to compare the results of various physicochemical parameter values with benchmark values. Various physicochemical characteristics and an investigation of untreated fertilizer effluent were explored. His findings showed that the levels of parameters like TDS, EC, BOD, COD, ammonia, and TSS are higher than the CPCB's allowable limits, and a fungus study confirmed the presence of 15 species that were isolated on Malt Extract Agar (MEA) medium, showing the effluent's pollution load. It has been demonstrated that dilution during the wet season drastically lowers the amount of metal level. However, due to the enrichment of these metals through bioaccumulation and bio-magnification in edible elements produced in water, it is widely recognized to have a noteworthy impact on the water of the river Yamuna, which is of significant concern to the public. Perennial rivers, originating from mountain ranges, flow continuously throughout the year, sustaining water through glacier melting. Located in North India, these rivers are vital for agriculture, while non-perennial rivers are found in South India. The term 'perennis' translates to 'lasting throughout the year.
Table 1.
Various analytical water quality indicators, their analysis method, and the WHO and Indian standard's recommended values.
Highly contaminated water can have a variety of negative impacts on people, both domestically and industrially. It could have an impact on several body organs and physiological disorders. For domestic purposes, including washing, bathing, cooking, and other uses, hard water is not recommended. Additionally unfit for use in industry and agriculture is hard water. It ruins delicate machinery and impairs the end product's quality, stability, and luster. A three-tier laboratory system is being maintained by the Central Water Commission for the analysis of the parameters which is illustrated in table 1. Different Indian rivers where physical characteristics of river water, including color, temperature, specific conductivity, smell, pH, and total dissolved solids, are measured. Selected Division Offices are home to 24 Level-II Laboratories, which are used to examine 25 different physicochemical and bacteriological properties of river water.
Results
Evaluating the Quality of the Water using Environmental Factors
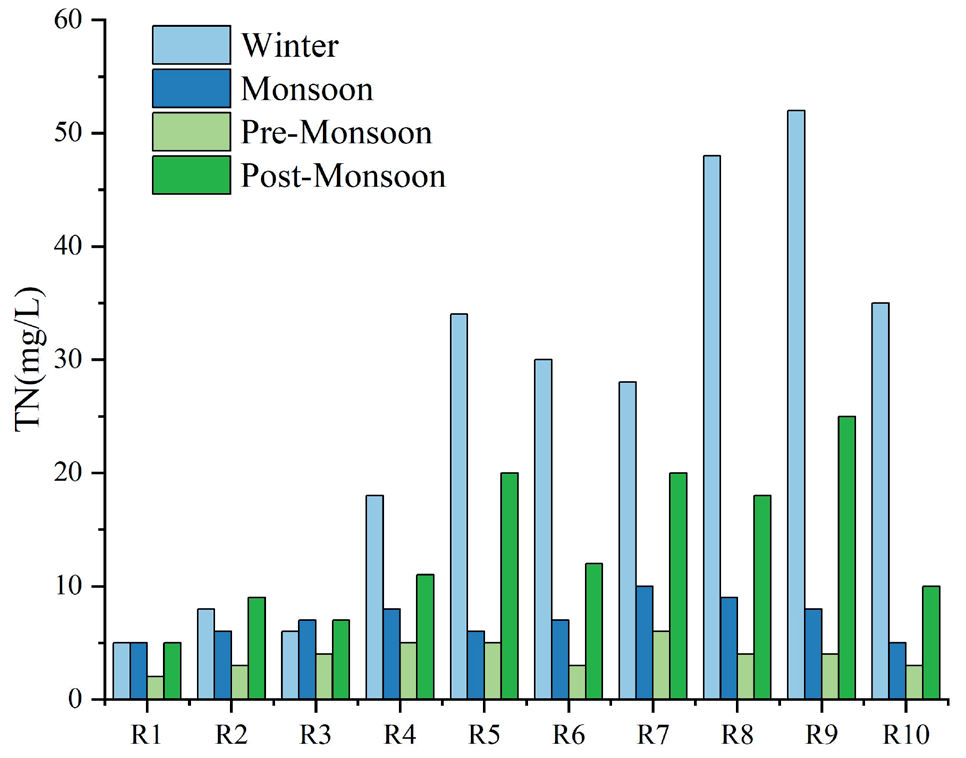
The increase in TiN content from station 1 to station 9 can be seen in Fig. 1, which illustrates how the nitrogen molecules' additive impact has caused a decline in the quality of the water. The degradation of water quality in different stations is very significant in this research. It is surprising that ammonia nitrogen made the largest contribution to TiN (Fig. 1). The fact that urban pollution was the primary cause of the increase in TiN was revealed by the lower pollution levels observed in rural areas. Lack of adequate treatment facilities causes the water quality in the valley to deteriorate as wastewater and untreated waste from homes, businesses, and hospitals are discharged into the rivers. Both non-point and point sources contribute to river pollution in rural areas, where there is substantial agricultural activity and a growing population. According to the seasonal variation in TiN (Fig. 1), poorer water quality is caused by higher concentrations during the post-monsoon and winter seasons. According to the environmental facts, the most important thing is to slow down the decline in biodiversity is to preserve and repair our rivers. According to WWF, rivers and the fluids and nutrients they carry support marshes, forests, and other terrestrial habitats. They are also home to a large number of the more than 100,000 freshwater species.
Fig. 1.
TiN seasonal variation at sampling points along the Yamuna River for the years 2019 through 2023.
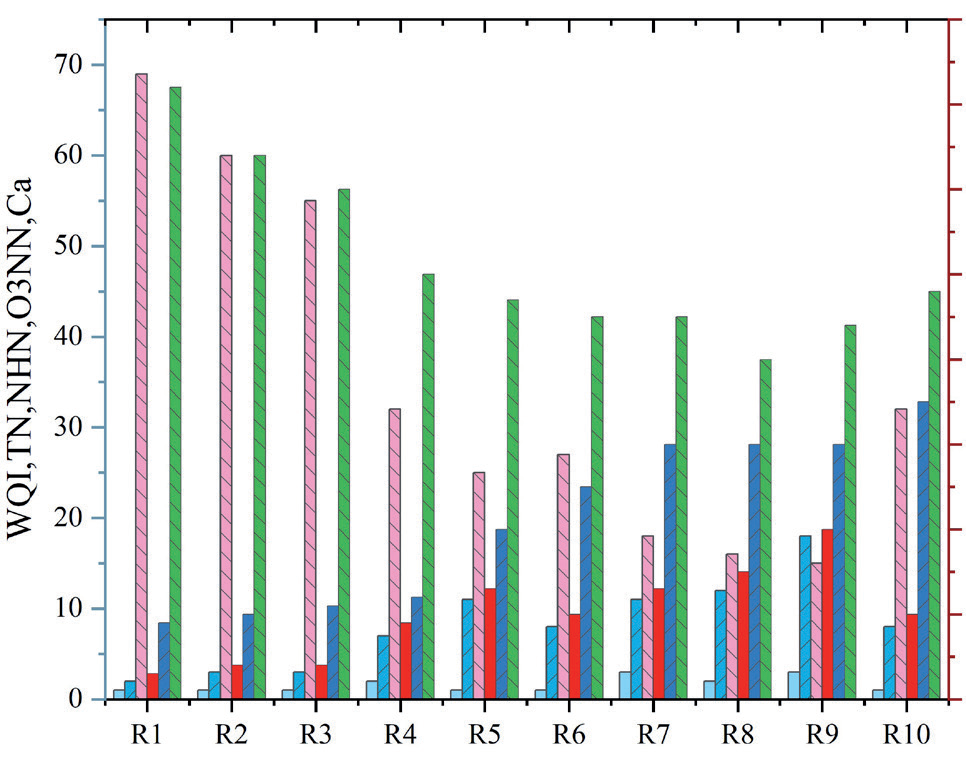
From stations R1 to R3, there were greater concentrations of dissolved oxygen (Fig. 2). This may be due to less nutrition, organic contamination, and water instability. These rural sites are less impacted by industrial and human-caused pollution since they are situated in an upstream region with a sparse population. Low water turbulences are caused by the presence of gentle slopes inside the city region (stations R4 to R9). However, the steep and rough river surface beyond station R9, where the city area terminates, causes the river's absorption capacity to increase, increasing dissolved oxygen and decreasing Sn. The other indicators, including calcium (Fig. 2), increased nearly continuously and did not exhibit a significant geographical variation. As a result, it is difficult to assess the total variation in water quality by looking at individual parameters, while some limited analysis is available. The appropriate indicator for assessing shifts in water quality brought on by the combined effect of numerous components is the WQI.
Water Quality Assessment using WQI
The plot in Fig. 4 was created using the WQI. There were several facts investigated. The quality of water value of 71 was observed at the station with the highest reading, R1. Water quality at station R3 was 10.6 units lower than at station R1 in comparison. The river's water quality keeps getting worse as it travels downstream. The quality reduction is statistically significant from station R1 to station R3, but not from station R2 to station R3. The river's water quality is significantly reduced by 10 units as it approaches the city from stations R3 to R4. This is connected to the effluents from wastewater treatment facilities and city sewage outflow. The river joins a number of sewage drains at station R5, where damage persists. The decrease in DO and increase in TiN are both in good accordance with this. For example, there is a 4-unit decline in water quality between stations R4 and R5 (p value = 0.459, negligible). Between stations R4 and R9 in the city, the river dropped 7.3 units of the water's purity index (p value = 0.054).
In certain locations, boats are used to transport agricultural products across rivers. When it rains, the rivers transport the fertile soil from their upper reaches downstream on flood plains. As a result, agricultural output on the flood planes beside the rivers rises. Seasonal variations in water quality were not clearly visible (Fig. 3). No discernible difference was seen at Station R1 throughout the post-monsoon, winter, and monsoon seasons, indicating that the water quality was essentially constant during these times. At station R5, a clear change in water quality was seen.
Fig. 3.
WQI variation for the sampling stations in the Yamuna River basin for the years 2019 to 2023.
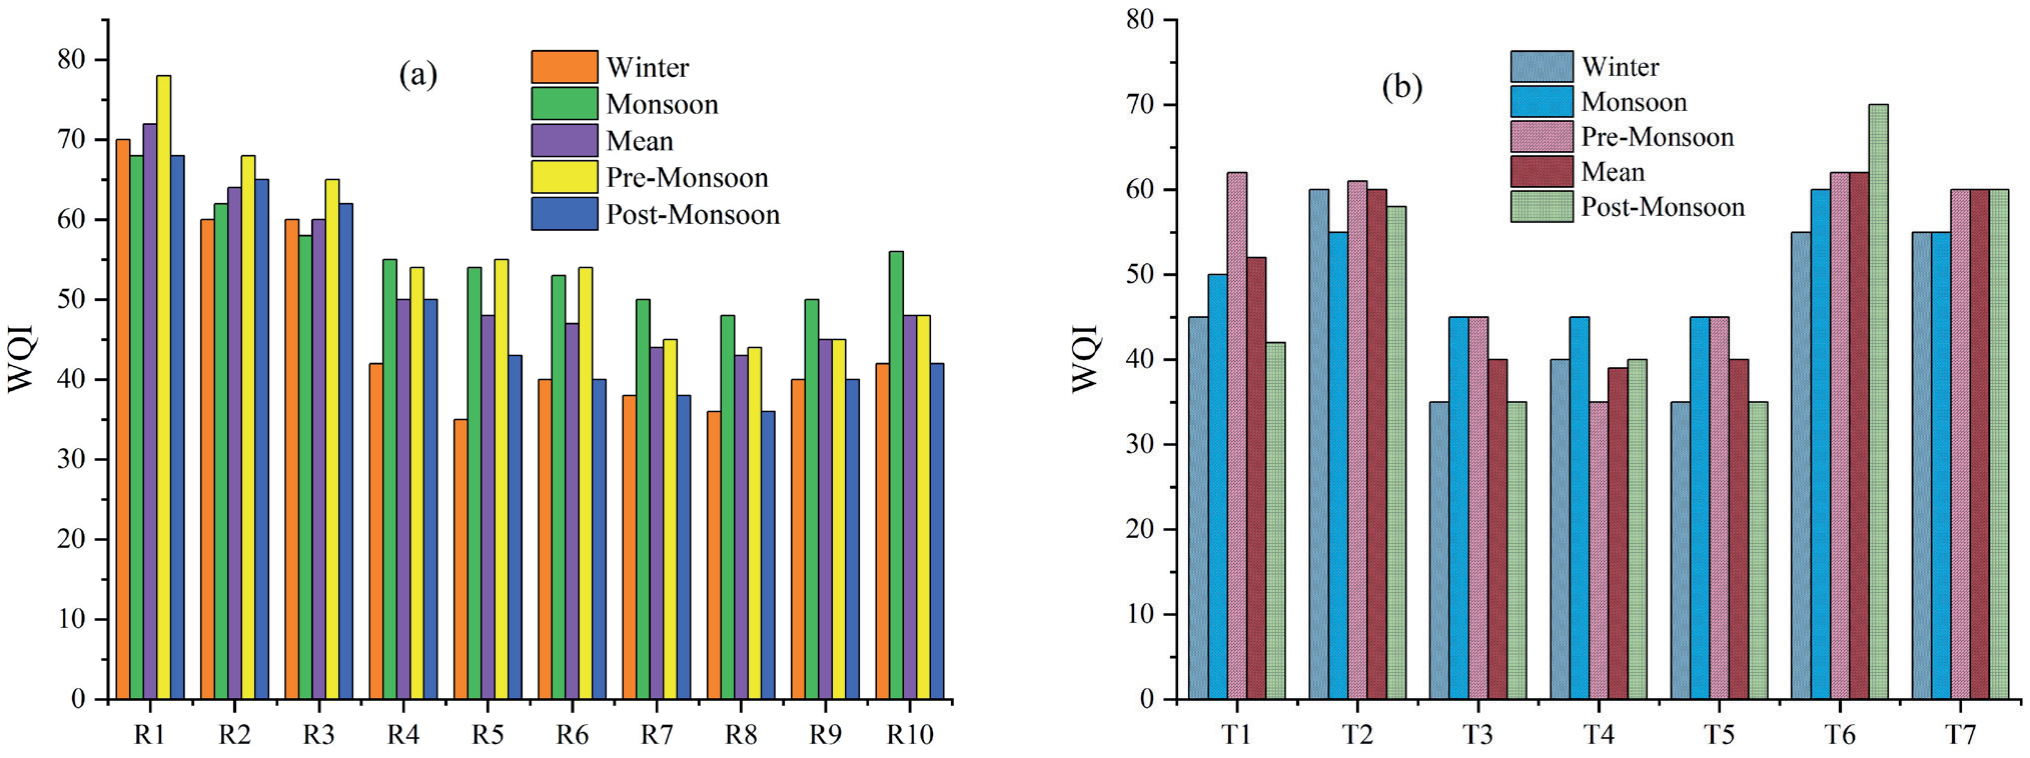
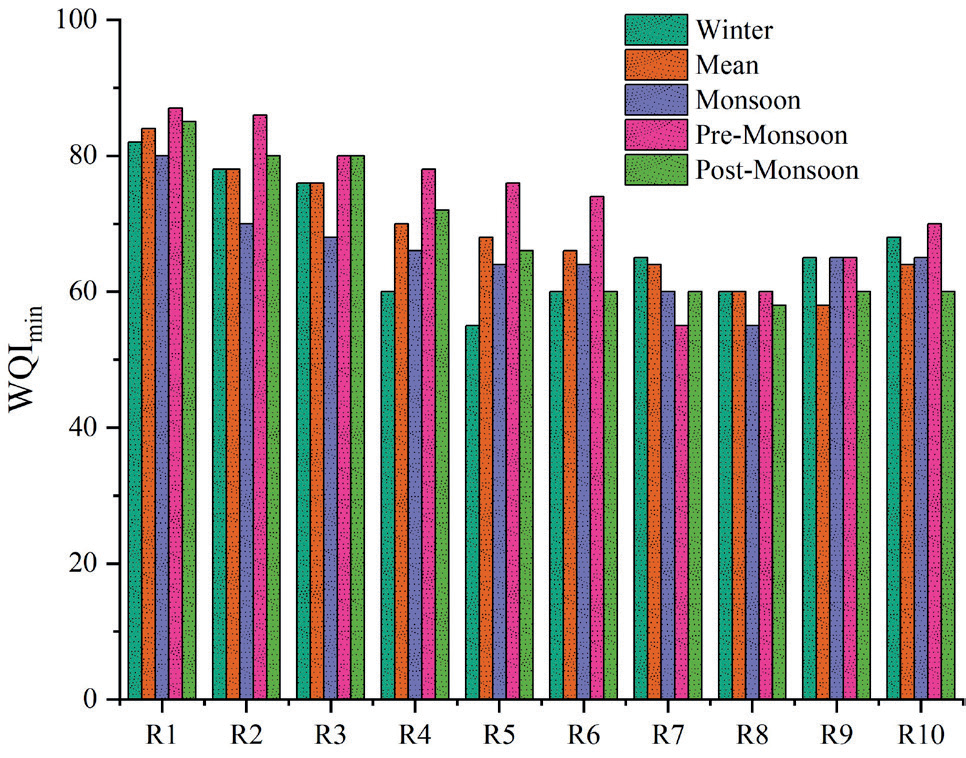
Fig. 5.
WQImin seasonal fluctuation for the years 2019 through 2023 at river stations along the Yamuna River.
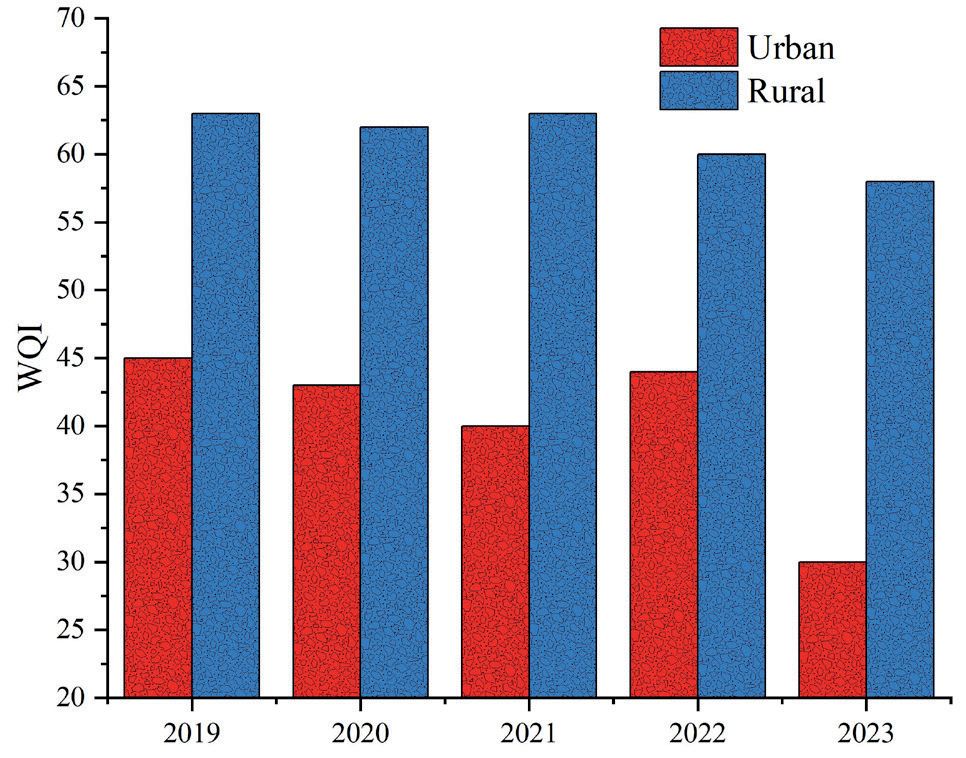
There was no appreciable difference in the water quality between the urban area's main river stations and its tributaries. The mean WQI values for urban stations (R4 to R9) and tributary stations were 52.3 and 57.9 units, respectively. Water quality in rural and urban areas was significantly different when compared (p=0.000) (Fig. 4). The rural water's mean WQI of 70.6 indicates medium quality, while the urban water's mean WQI of 54.8 indicates poor quality.
Indicators of water quality during the monsoon, pre-monsoon, winter, and post-monsoon seasons, respectively, were 61.1, 63.4, 58.7, and 61.9 units, suggesting medium water quality in the rural area. Urban areas have low water quality, with indices of 48.0, 49.9, 41.2, and 42.0 units, respectively, similar to rural areas. The variation in WQI indicated that the quality of the water in rural regions had significantly declined. Average water quality declines between 2019 and 2023 were 13.5% and 11.6%, respectively, in urban and rural areas. The urban station R9 and the rural station R1 both recorded the greatest drops in water quality of 27.7% and 19.5%, respectively. The trend in river water quality shown in Fig. 5 using WQImin is consistent with what WQI projected.
Fig. 4.
The Yamuna River basin's fluctuation in annual mean WQI ratings between urban and rural areas from 2019 to 2023.
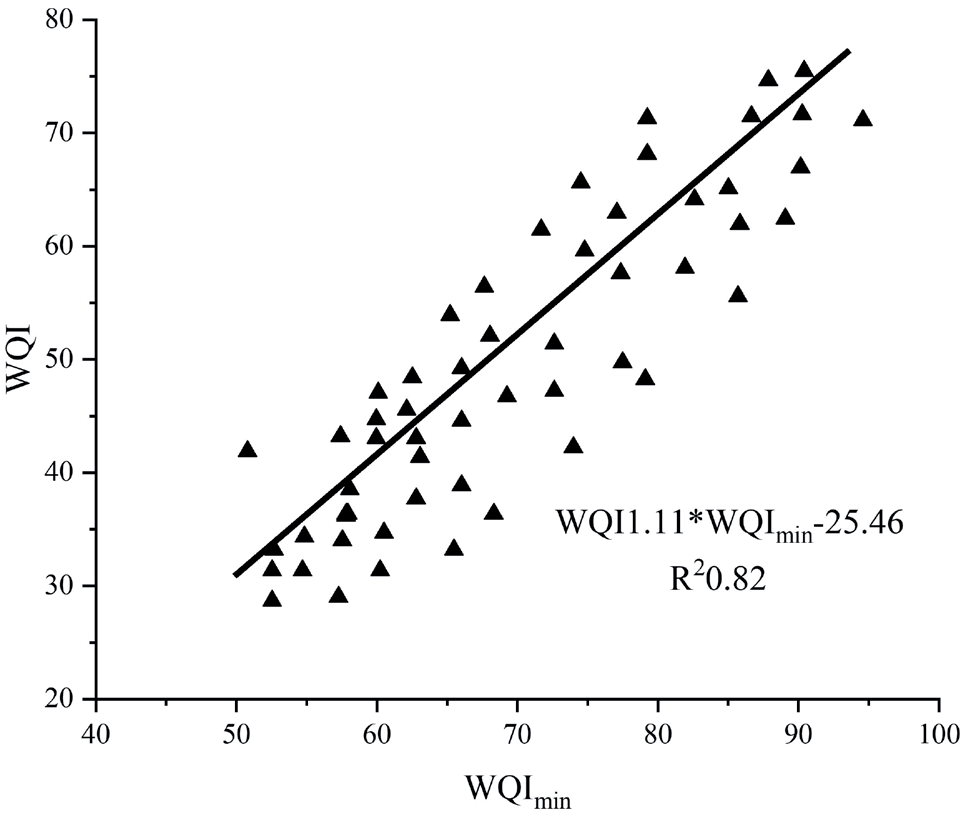
These findings and those from the WQI are fairly consistent. WQImin is beneficial for trend evaluation and tracking work prediction. Regression analysis was used to generate an equation of a straight line utilizing the mean seasonal data for the five-year study period at 17 sites, resulting in WQIm. This was done in recognition of the strong association between the objective and minimum water quality indices. One of the best examples of river drought is three periods of extremely severe weather that caused serious agricultural distress in Rajasthan, Gujarat, sections of Maharashtra, and Karnataka in 1965, 1987, and 2009, respectively. Droughts also occurred in the late 20th century in 1972, 1979, 1982, and 2002 as a result of weak or failed monsoons. (Fig. 6).
Conclusions
The current study concludes that river water quality has considerably declined in India and around the world as a result of pollution from a range of sources, including mining, industry, urban, agricultural, medical practices, and residential. Urban conservation techniques like low-flush toilets and drip irrigation in agriculture, as well as international initiatives like Singapore's NEWater project for water purification and reuse, are examples of sustainable water use. This analysis also establishes a link between a number of physico-chemical factors. The DO is influenced by photosynthesis, temperature, turbidity, and respiration. The pH is influenced by photosynthesis, temperature, chloride, and dissolved carbon dioxide. The study also found that the value of DO is lower in the summer and higher in the latter due to the low winter temperatures and high summer temperatures. The amount of dissolved free carbon dioxide and temperature are strongly associated; in the summer, when temperatures are high, the amount of free CO2 is also high; in the winter, when temperatures are low, the amount of free CO2 is also low. A link exists between pH, temperature, photosynthesis, dissolved CO2, and dissolved CH4 in addition to other variables. While the pH is high throughout the wet and post-wet seasons, it is low during the hot summer months. As pH rises when photosynthesis occurs, autotrophic photosynthesis in river water is an essential part of pH regulation. Along with photosynthesis, pH rises as dissolved chlorine and carbon dioxide levels fall, and vice versa. In order to investigate and control water pollution for the benefit of society as a whole, the review work provides a thorough overview of river water pollution in India and overseas as well as the connections between various physicochemical parameters.

