

Introduction
An earthquake is an act of releasing energy from the earth, which is mainly caused by the movement of plate tectonics [1, 2]. At present, researches on earthquakes mainly focus on seismic attributes, such as seismic waves [3, 4], structural reflections caused by earthquakes, such as landslides [5, 6] and profiles [7, 8], and losses caused by earthquakes [9, 10], such as life and property, while less attention is paid to the ecological effects caused by earthquakes [11- 13]. However, ecological effect [14, 15] is generally believed to be a change in an ecosystem caused by the destruction of nature, caused by human production [16], living, and development, which is mainly reflected in the imbalance of structure and function. Typically, research has focused on the impact of human activities, such as the emission of pollutants. Others focus on natural phenomena, such as the migration of valleys [17] and melting glaciers [18]. However, the ecological effects caused by sudden energy release, such as earthquakes, are less studied due to their complexity. An ecosystem is a state of balanced development between organisms and the environment in nature [19, 20]. An important criterion for evaluating ecosystem stability is ecosystem quality, which reflects a system’s health [21]. Seismic ecological effects are produced by earthquakes’ impact on ecosystems [22]. Therefore, how to analyze the ecological phenomenon reflected by the earthquake ecological effect from the perspective of ecosystem quality is a field worth exploring. China is a country prone to natural disasters [23]. Earthquakes are frequent, causing casualties as well as property damage. After the founding of the country, there were two major casualties of the earthquake. Therefore, how to scientifically select the method and effectively establish the perfect analysis means for the target is also a research topic of practical significance. Based on this, as a basis for selecting the study area, the Wenchuan earthquake was used, and ecosystem quality was analyzed with the earthquake’s ecological effects as a backdrop. It is expected to explore the theories and methods of ecosystem quality evolution while trying to discover the evolution mechanism of earthquake ecological effect.
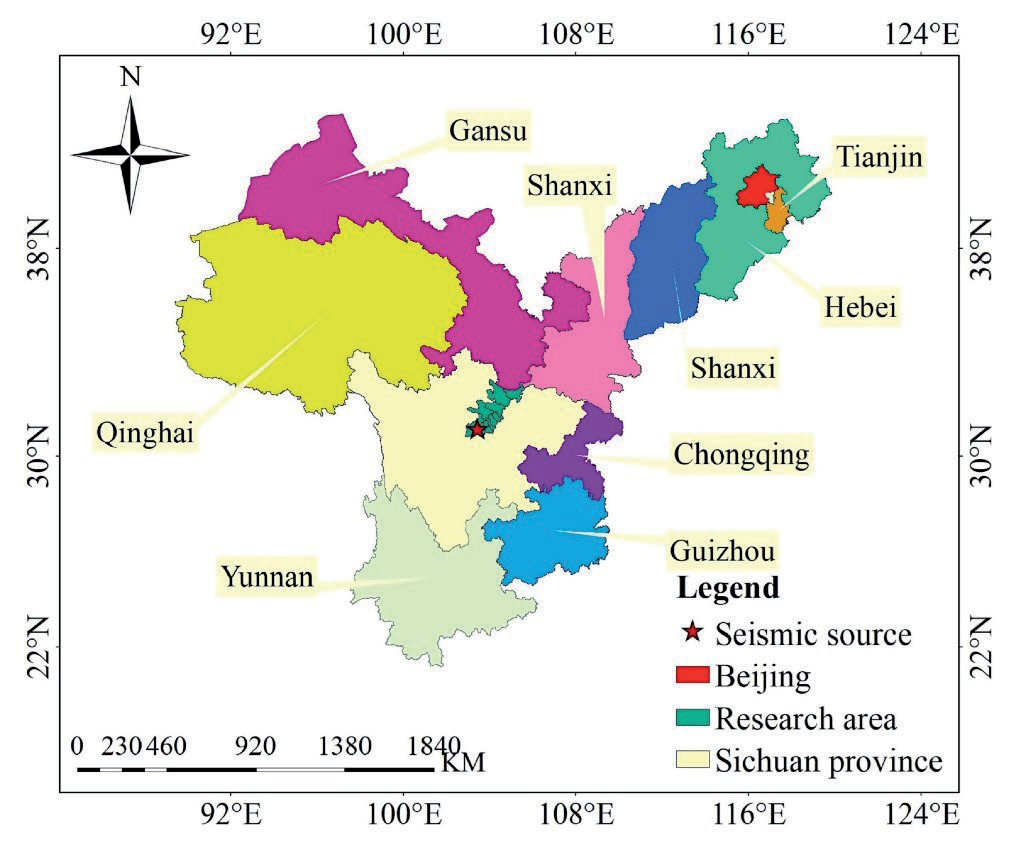
At present, the analysis of ecosystem quality mainly focuses on the long-term time series change analysis of the indicators [24], and seldom involves the causes of the change. Moreover, most analyses show the phenomenon of change [25], while the analysis of the essence [26] of change and the mechanism of the ecological evolution effect are relatively rare. Based on current analysis methods, results, and theories, this paper attempts to infer the essential reasons for the changes in the phenomena, and then discover the evolution mechanism. There are two main parts: The first part is the phenomenon change, mainly analyzing the temporal and spatial evolution of ecosystem quality [27]. The second part mainly discovers the essential reason for the change and the mechanism and process of the evolution of the ecological effect. A stepwise approach was used to evaluate the effectiveness and interpretability of the method in ten counties severely affected by the Wenchuan earthquake. Fig. 1 is a map showing the exact location of the research area.
Six parts make up the majority of the article. A brief overview of the research status, the theoretical foundations, the paper structure, and the expected results are presented in the introduction. Here is a brief introduction to the study area’s situation. The research methods introduce the main methodological theories. The result part mainly includes evolution characteristics and evolution effect analysis. The conclusion part summarizes the theory. The results and research theory are further explored in the discussion section.
Overview of the Study Area
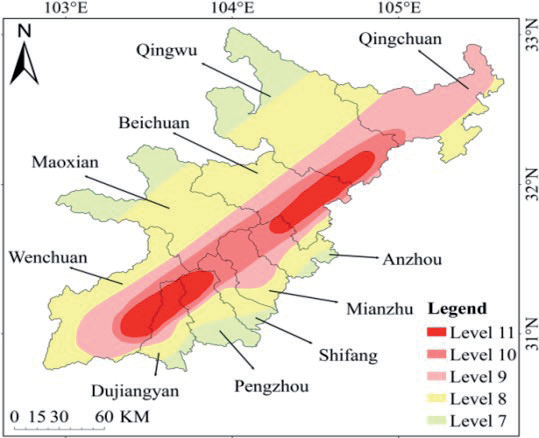
Following the Tangshan earthquake, the Sichuan Wenchuan earthquake caused the most deaths. In addition to China, several Asian countries were affected by the earthquake. There are ten counties included in the study area, which are distributed according to five levels of earthquake intensity. Fig. 2 is a diagram showing the specific division. The ecological system of the study area is classified into six categories: forest, grassland, farmland, wetland, urban, and others.
The Research Methods
Firstly, the indicator parameters of ecosystem quality were selected by qualitative analysis, and then the variation of ecosystem quality was quantified by quantitative analysis. Then combined with the mean value, standard deviation, and linear change coefficient of the parameters. A quantitative analysis of ecosystem recovery and evolution in earthquake-hit areas was based on three aspects: basic characteristics, stability characteristics, and recovery degree characteristics. Additionally, the main influencing factors of the evolution process were found to determine the mechanisms of temporal and spatial evolution effects on ecosystem quality.
The basic data of ecosystem quality assessment parameters came from the China Meteorological Data Network Shared Network and MODIS dataset. The time period is from 2000 to 2018, and the temporal resolution is month. Data from July to October of each year were selected as the growth period, including the Normalized Vegetation Index (NDVI) and Solar radiation (SOL). Data for analyzing the mechanism of evolution effect come primarily from remote sensing classified images collected by Resource and Environmental Science and Data Center in 2000, 2005, 2010, 2015, and 2018.
Calculation Method of Ecosystem Quality Parameters
There is a lot of vegetation in the study area, which is mostly mountainous. Moreover, vegetation has a significant influence on the morphological structure, power, and operating environment of ecosystems, making it a good indicator of ecosystem quality. Vegetation status is one of the important guarantees of terrestrial ecological function and ecological security. Among vegetation factors, Fractional Vegetation Coverage (FVC) and Net Primary Productivity (NPP) can well reflect vegetation growth and vegetation quality, so they are used as evaluation parameters of ecosystem quality change.
FVC Calculation Method
FVC was obtained by pixel binary calculation of NDVI using the remote sensing estimation method. The spatial resolution was 500m, and the monthly mean data of the FVC were obtained. Here is the formula:
In the formula, NDVIsoil represents the NDVI value of bare soil or areas without vegetation cover, while NDVIveg represents the NDVI value of areas covered entirely by vegetation, i.e., the NDVI value of pure vegetation pixels. NDVIveg and NDVIsoil are respectively the maximum and minimum NDVI values within the region. Due to the presence of noise, confidence levels of 95% and 5% are typically used.
Quantitative Inversion of NPP
NPP is directly related to intercepted photosynthetic actively radiating (IPAR) [28] and light utilization efficiency (ɛ), which differ with soil moisture and temperature. Therefore, the two factors can be used to build a model (CASA model) for calculation. The calculation process is shown in Equation (2) below:
A photosynthesis active radiation is specified as IPAR(x,t), which is what vegetation actually absorbs as a result of photosynthetic activity. ɛ(x,t) represents the efficiency of light utilization. Using the Chinese Typical Value and the vegetation type in the study area, ɛ(x,t) is obtained based on the maximum light utilization efficiency ratio. The value is 0.66. The inversion calculation of IPAR(x,t) is as in Equation (3) below:
SOL(x,t) represents total solar radiation. As a percentage of incoming photosynthetically active radiation, it can be expressed as FPAR(x,t). A ratio of 0.5 indicates how much incident solar radiation plantings can infiltrate at wavelength (0.4~0.7 μm). As a general rule, FPAR(x,t) is calculated by inverting NDVI. With the help of remote sensing for monitoring and evaluation of urban wetlands [29], FPAR(x,t) has been derived using inversion, equation 4 as shown below:
Analysis Method of Temporal and Spatial Evolution of Ecosystem Quality
Calculating the average value provided information about vegetation parameters, where a higher value indicates a better state of the vegetation. A standard deviation formula was used to determine the stability characteristic of vegetation, where a larger value indicates poorer stability, whereas a smaller value indicates better stability. The core of the linear trend method is the least square method. The variation trend of vegetation condition was obtained by calculation. In essence, a positive value indicates that the parameter is increasing; the higher the value, the faster it is increasing. Negative values indicate increases in the parameter; decreasing values indicate slowing down of the parameter trend; zero values indicate no noticeable changes in the parameter trend. Calculated the ratio value between the vegetation parameters before and after the earthquake, and the coefficient of recovery was calculated. A higher value indicates better recovery, a value greater than 1 indicates recovery, and a value between 0 and 1 indicates no recovery.
Evolution Mechanism Analysis of Earthquake Ecological Effect
Zhang et al. proposed a three-layer method for analyzing seismic ecological effects in the study area [30]. The first layer mainly analyzes the background changes in ecosystem quality. The second layer mainly analyzes ecosystem quality heterogeneity and background evolution.
The First Level of Three-Level Analysis
The core of the first layer of the three-layer analysis is the Markov model [31, 32], and the research object is the response of the landscape index [33] and ecosystem change. The integrity index includes patch area and mean patch size. The fragmentation index includes the number of patches and patch density. The disturbance index includes the percentage of the landscape. The Species diversity index includes the largest patch index.
The Second Layer of Three-Level Analysis
The second layer of the three-layer analysis includes three aspects. In the first method, the relation between landscape index and ecosystem type is calculated using grey correlations [34, 35]. When the correlation coefficient is between 0 and 0.25, the correlation type is very low; between 0.25 and 0.45, it is a low correlation; between 0.45 and 0.55, it is a medium-low correlation; between 0.55 and 0.65, it is a medium-high correlation; between 0.65 and 0.85, it is a high correlation; and between 0.85 and 1.00, it is a very high correlation. The second is their coupling change process, and the main method is the coupling coordination method [36, 37]. As shown in Table 1, the coupling coordination degree is partitioned based on partitioning criteria.
They primarily used the relative priority model to analyze their coupling changes [38, 39]. Here is the formula:
There are two comprehensive evaluation values within the formula, U1 representing ecosystem type, and U2 representing landscape pattern index.
Results Analysis
Spatiotemporal Evolution of Ecosystem Quality
Analysis of Basic Features
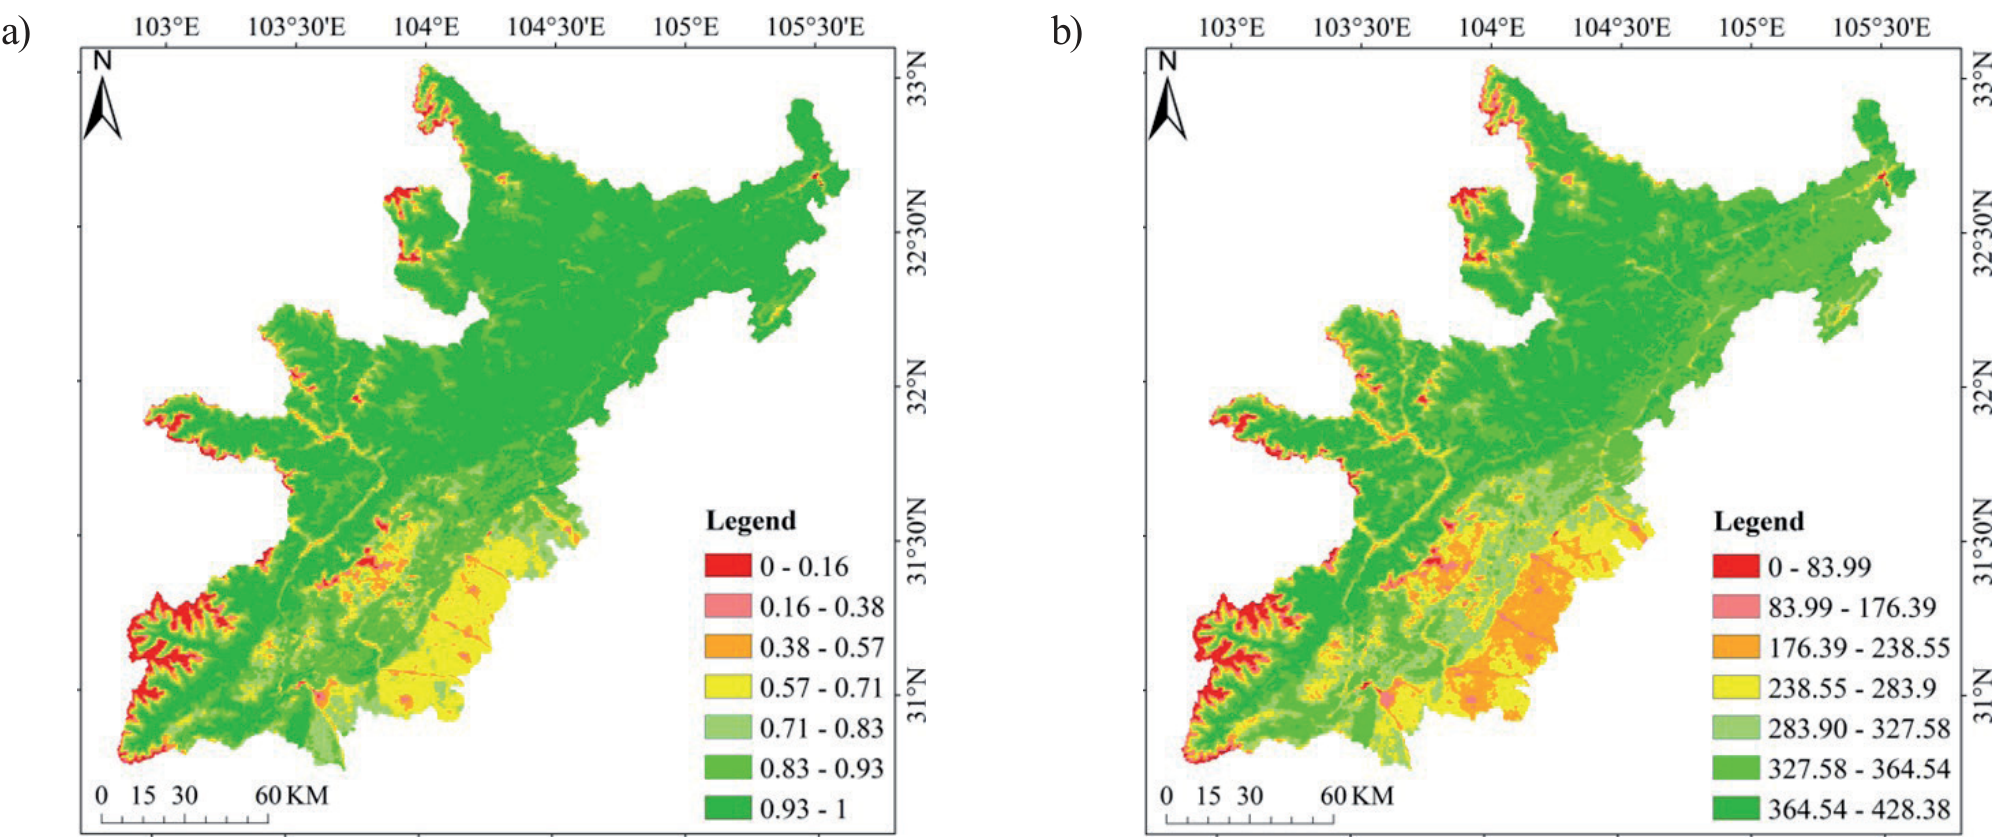
Compared to the south, west, and east, the north showed better vegetation growth overall. In terms of the changes, the northern region showed an increase in the higher region, while the southern region showed an increase in the middle and low region and a decrease in the middle region. In terms of overall NPP, the vegetation quality in the north is better than that in the south, the west, and the east. In terms of changes, the areas with the highest vegetation quality in the north were larger than those with higher vegetation quality, and the areas with the highest vegetation quality in the south were less, mainly concentrated in the west. The average values of FVC and NPP are shown in Fig. 3a) and b).
Stability Characteristic Analysis
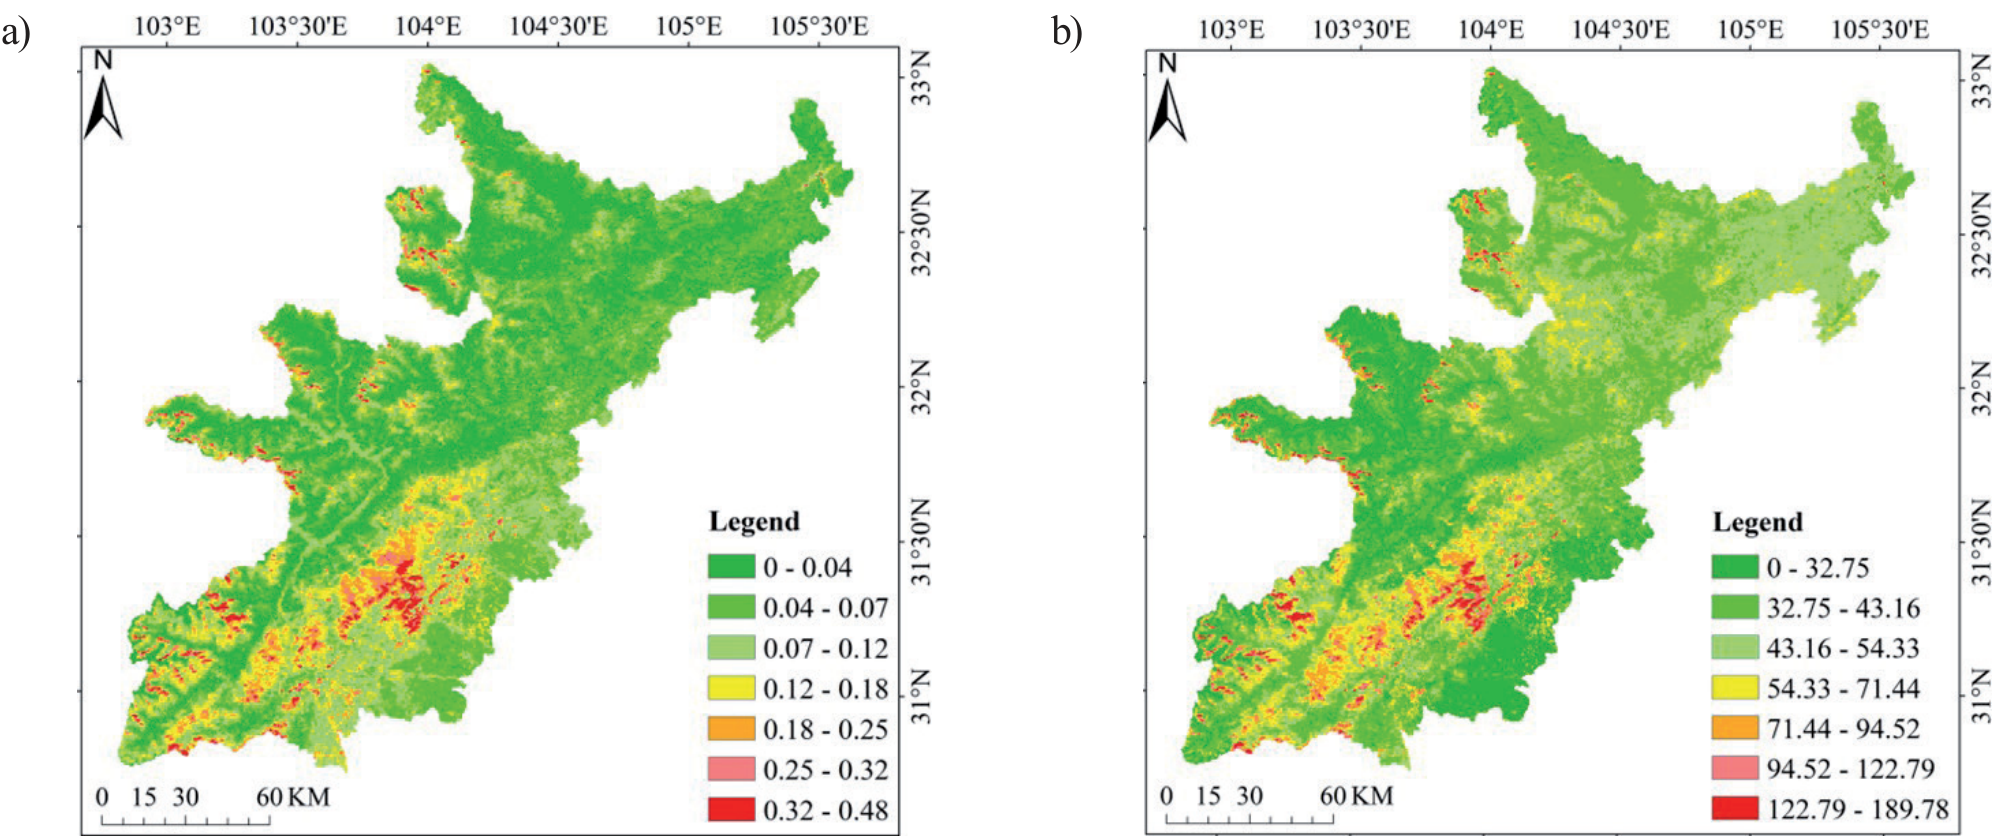
The spatial distribution characteristics of the FVC standard deviation are similar to those of the FVC mean. In terms of the FVC standard deviation distribution region, the stability of the northern region is good, and the stability of the southern central region is poor. The reason may be related to the earthquake effect. In terms of the distribution of NPP standard deviation, there is a great difference between the north and the south. Northern regions have relatively uniform spatial stability, while the regions in the south with good stability tend to be mountainous and urban. The standard deviations of FVC and NPP are shown in Fig. 4a) and b).
Table 1.
Standard for grading coupling coordination degree.
Restitution Characteristic Analysis
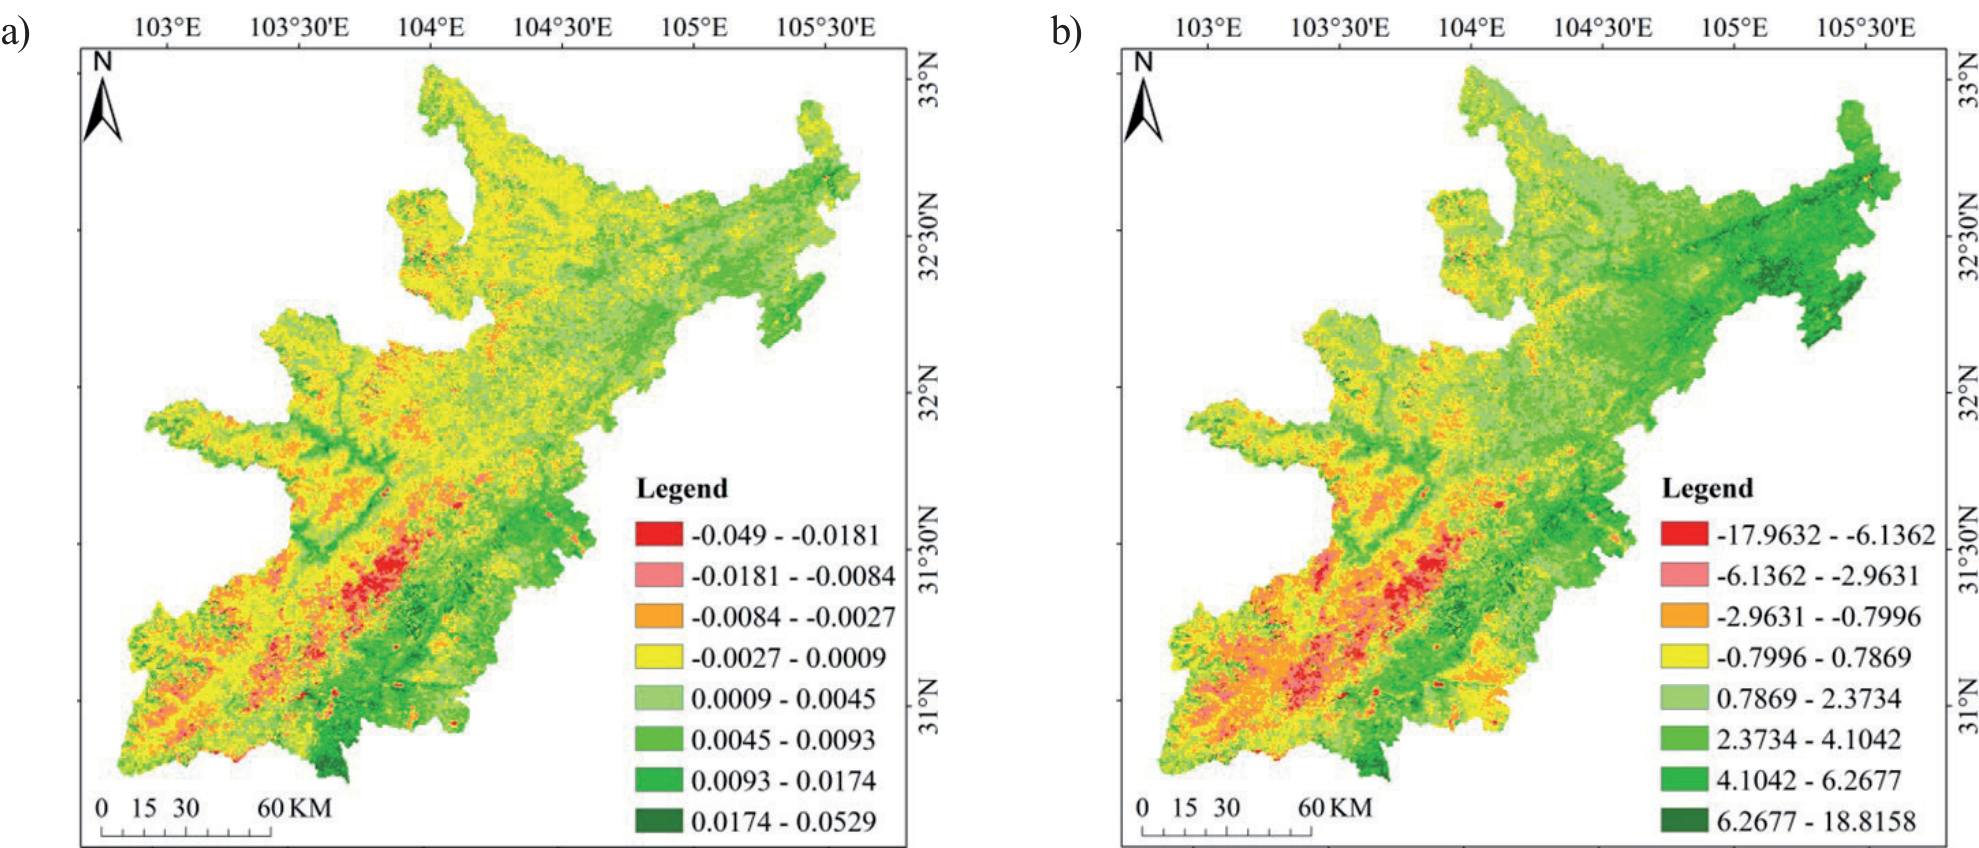
The linear change trend coefficient of FVC is 0.0014, indicating that the vegetation growth has a recovery trend of getting better. Spatial distribution analysis shows that the eastern region has a higher recovery rate than the western region. A high recovery rate is observed in the southern area, which is located in the urban agglomeration area. According to the FVC restoration coefficient, the vegetation growth has recovered after the earthquake and is better than that before the earthquake. The recovery coefficients of post-earthquake and pre-earthquake, post-earthquake and overall were 1.0058 and 1.0023, respectively. The average value of FVC after the earthquake was 0.0058 and 0.0023 higher than that before the earthquake and the whole.
The average linear variation trend coefficient of NPP was 1.4434, indicating that the overall vegetation quality had a good recovery trend. Eastern regions have a higher recovery rate than western regions based on spatial distribution. The northern region is concentrated in the east, and the recovery rate is obviously higher than in other regions. According to the NPP restoration coefficient, the quality of vegetation has been restored after the earthquake and is better than that before the earthquake and the overall level. The post-earthquake and pre-earthquake, post-earthquake and overall recovery coefficients are 1.0175 and 1.0075, respectively. The average value of NPP after the earthquake was 0.0175 and 0.0075 higher than that before the earthquake and the whole. The linear variation coefficients of FVC and NPP are shown in Fig. 5a) and b) below.
Evolution Effect Process Analysis
Analysis of the Causes of Ecosystem Quality Evolution
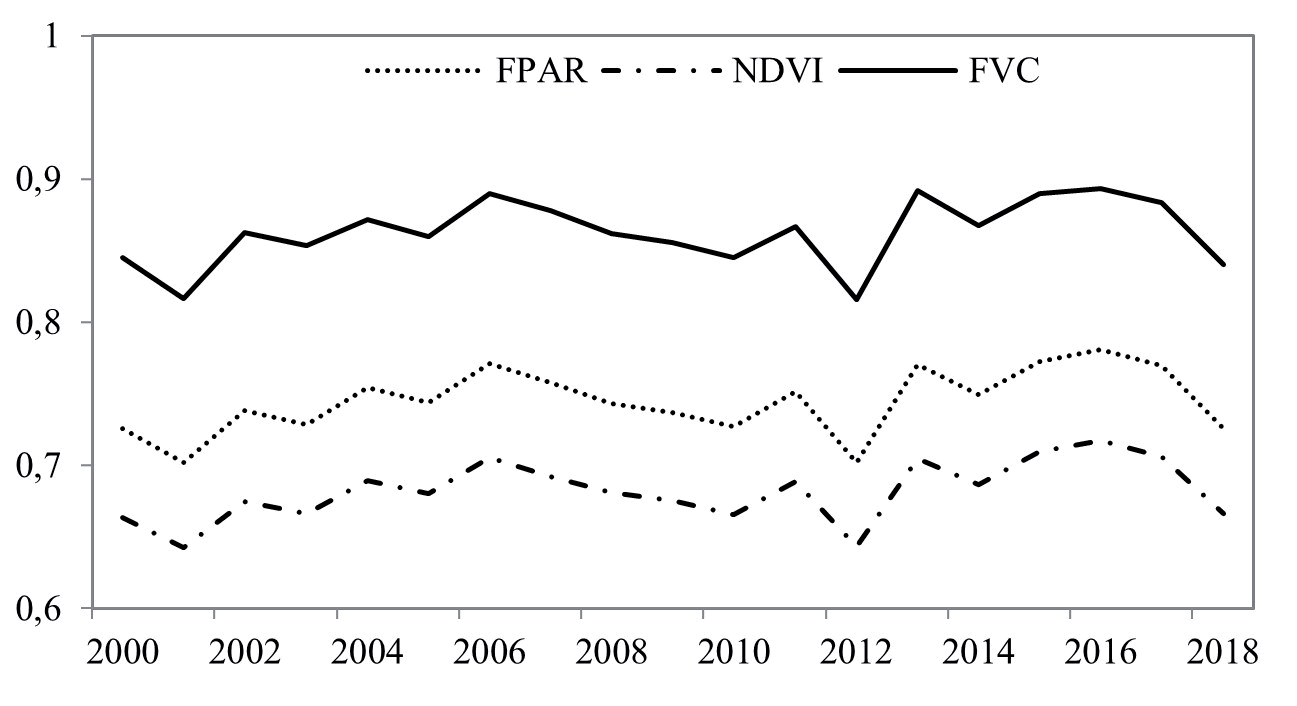
According to the formula, NPP is obtained by IPAR and ɛ inversion, and IPAR is obtained by FPAR and SOL inversion. SOL is understood to be mainly provided by the sun and is not affected by earthquakes. Therefore, it is inferred that NPP variation is mainly related to FPAR. FPAR is obtained by NDVI inversion calculation, and NDVI reflects the vegetation band. Through data comparison, the variation trend of FPAR results is consistent with that of NDVI and FVC, indicating that the change in FPAR is caused by FVC. In Fig. 6, you can see the changes in FPAR, FVC, and NDVI between 2000 and 2018.
In the study area, vegetation types corresponding to forest ecosystems are mainly represented by vegetation coverage. There are two main reasons for this change. The first is the interconversion of ecosystem quality backgrounds. Additionally, during the process of transformation, the ecosystem and the landscape pattern are coupled and coordinated to affect the ecosystem. These factors belong to the evolution process of ecosystem quality background.
Therefore, this paper believes that this is the fundamental reason for the evolution of NPP, that is, the seismic ecological effect causes a series of changes caused by the background evolution of ecosystem quality in the seismic region. Changes in ecosystem quality are just one manifestation. The evolution mechanism caused by seismic ecological effect is expounded through further analysis.
Background Effect of Ecosystem Quality
In terms of the transition of ecosystem quality from 2000 to 2018, urban, grassland, and agricultural ecosystem types made the most significant changes between 2000 and 2018. The urban area increased by 0.82%, while the grassland and farmland area decreased by 0.76% and 0.68%, respectively. Wetland and forest had little change, with an increase of 0.18% and 0.03%, respectively. From 2000 to 2018, forest, grassland, and farmland accounted for 37.2%, 38.23%, and 27.99% of the ecosystem quality background shifts, respectively. Urban and wetland transfer is relatively small, 1.1% and 0.55%, respectively.
Background Heterogeneity Effect of Ecosystem Quality
Forest integrity of response objects decreased from 2000 to 2018 in the study area, based on ecosystem quality heterogeneity in landscape pattern characteristics. The patch area increased by 752.22 hm2 compared with before the earthquake, but the mean patch size decreased by 80.04 hm2, reflecting that the actual forest condition did not improve with the increase of the area. With the forest fragmentation degree increasing, it is evident that forest fragmentation has increased because the number of patches and patch density increased by 140 and 0.002, respectively. When the forest was affected by the earthquake, the percentage of landscape increased by 0.01%, indicating that the ecosystem was affected to a greater extent than before the earthquake. Species diversity decreased and the largest patch index decreased by 0.89%, which reflected that the living space provided by forest for species decreased. The forest response index is shown in Table 2.
Coupling Effects of Ecosystem Quality Background
From the aspect of ecosystem quality background evolution in the correlation between ecosystem type and landscape pattern, there are influences and constraints. In terms of correlation degree, the forest has the highest correlation (0.998), which reflects that the forest has a strong promoting force on the ecosystem. The urban is the most restrictive (correlation degree is 0.468), indicating that the development of the ecosystem is controlled by the urban, and the comprehensive correlation degree is high. In Table 3, you can see the correlation results.
Considering the coupling relationship of ecosystem quality background evolution, after the earthquake, their coupling relationship improved slowly but fluctuated over time. A mild imbalance-ecosystem lag was experienced at the end of 2018 due to a change in priority from increasing to decreasing. From the perspective of ecosystem background, the main reason is that during the period when the ecosystem comprehensive index gets better, the intrinsic patch properties get worse, and their changes are not coordinated. After the earthquake, the patch properties were improved, and the comprehensive indicators of the ecosystem deteriorated. During a period of time, their conditions reached balance and the degree of coordination was improved. However, after this time, the patch properties continued to improve, and the ecosystem’s comprehensive indicators continued to deteriorate and become incongruous. Then they changed in the opposite direction and tended to get better. From the results, it can be seen that the change is in a kind of fluctuation, and the change is in an oscillation interval. The earthquake changed the middle change process, but the nature of the change was not affected, which reflects the characteristic of the periodic change of the ecosystem quality. According to Table 4, the degree of coordination between the two couplings is as follows.
Table 2.
Forest Background Pattern Index In The Study Area From 2000 To 2018.
Table 3.
Study area’s ecosystem pattern from 2000 to 2018, analyzed by correlation.
| Item | Forest | Grassland | Wetland | Farmland | Urban | Number of patches | Patch density | Largest patch index | Mean patch size |
|---|---|---|---|---|---|---|---|---|---|
| Correlation | 0.998 | 0.928 | 0.569 | 0.946 | 0.468 | 0.668 | 0.667 | 0.805 | 0.657 |
| Ranking | 1 | 3 | 8 | 2 | 9 | 5 | 6 | 4 | 7 |
Table 4.
The level of coordination in ecosystem patterns between 2000 and 2018.
Discussion
The calculated results of mean value, standard deviation, linear coefficient, and recovery degree adopted in this paper can well reflect the temporal and spatial changes and recovery characteristics of ecosystem quality before and after earthquakes. The method will be used to determine the quality of seismic ecosystems over time and provide a reference for measuring its changes. Secondly, the evolution mechanism of major seismic ecological effects is explored, and the ideal results are obtained from practice.
However, from the perspective of data integrity, there are still some defects: It is concluded that the change in ecosystem quality is the result of the background evolution of ecosystem quality promoted by the seismic ecological effect. However, the change in ecosystem quality is reflected by ecological factors. The terrestrial vegetation factors FVC and NPP were analyzed in this paper. However, due to the constraints of actual conditions, the relationship between them was not analyzed in many aspects. Therefore, these works need to be further analyzed and perfected.
In addition, ecosystem quality is an objective criterion for evaluating ecosystem evolution. Although much research has been done, much more needs to be done: (1) Ecosystem quality reflects the health attribute of the ecosystem, which determines that it needs to be evaluated by a series of detailed and perfect criteria.
(2) Ecosystem quality involves a wide range of subjects and has regional and heterogeneous characteristics. Scientific analysis requires multidisciplinary data fusion, multi-method experiments, and trade-offs.
Finally, ecological factors are fundamental to reflect the quality of the ecosystem. In the process of NPP inversion, the important process is FPAR inversion. The main data of inversion is NDVI, but NDVI reflects the reflection of the vegetation band. The main source of NPP is plant leaves. It is the result of photosynthesis when the leaves of plants absorb sunlight. Therefore, it is considered that the leaf area index inversion of FPAR is more accurate. However, the leaf area index is generally calculated through NDVI. Future research could consider dividing the area of research into two parts, taking into account this situation. The combination of leaf area index and NDVI was used to retrieve NPP, and then the results calculated by other methods were compared and analyzed.
Conclusions
The Wenchuan earthquake area’s ecosystem quality was examined spatially and temporally in this paper. We analyzed the causes and discovered the evolution mechanism and process of the ecological effect from the earthquake ecological effect perspective. As a result, the following conclusions can be drawn:
As far as methods are concerned:
(1) The mean value method, standard deviation method, linear trend coefficient method, and restoration degree method can well reflect the change process and result of ecological quality in time and space. This shows its applicability in the study of seismic ecosystem quality changes.
(2) By using a three-layer analysis method, we can identify the causes of the changes and the mechanisms accounting for earthquake impacts on the environment. Using this method to study such problems is shown to be practical and universal.
From a theoretical perspective:
(1) Analyzing the characteristics of a change is a scientific and reasonable method to infer its causes based on ecological factors.
(2) The reasoning process of the case is also the embodiment of the evolution process, reflecting the scientific nature of the theory.
(3) The results obtained by combining theory and method objectively reflect the process of ecosystem quality evolution caused by the earthquake ecological effect. It reflects the academic value of the research.

