

Introduction
Sesame (Sesamum indicum L.) is known as an ancient oilseed crop belonging to the Pedaliaceae family and has been widely cultivated in tropical and subtropical areas of Asia, Africa, and South America [1, 2]. Sesame is widely traded in local, regional, and international markets. Furthermore, population pressure, urbanization, and changing lifestyles have increased the global demand for sesame products [3]. Sesame seeds contain 44%-58% oil, 18%-25% protein, 13.5% carbohydrate, and 5% ash [4]. Sesame seed oil is a popular edible oil due to its pleasant and mild taste, excellent antioxidant activity, and high nutritional value [5]. Sesame seeds showed many biological activities such as antioxidant, anticancer, antidiabetic, and cardioprotective [6]. Sesame oil is rich in linoleic and oleic acids, has a predominance of gamma-tocopherol over the other isomers of vitamin E, and has a high content of fat-soluble ligands (sesamin and sesamolin) [1]. Sesame seeds show many biological activities, such as antioxidant, anticancer, antidiabetic, and cardioprotective [6].
Sesame flowers emerge from the leaf axils. The sesame seeds that have been produced until today are generally divided into two groups, i.e., single and triple-capsule. In the single-capsule group, only one flower bud occurs in each leaf axil of the plant, and the two sides of it are atrophied. The number of capsules in the leaf axil, a crucial component of yield, consistently matches the number of flowers that open in the same location and is consistently assessed in field studies [7]. Approximately 93% of Turkish sesame seeds are single-capsuled. Three flowers are formed in each leaf axil in the three-flowers group; the middle blooms first and matures earlier than the lateral flowers. All three flowers develop and form capsules in three-capsuled plants. The three-capsule group accounts for 7% of the total sesame production in Türkiye [8].
Natural antioxidants are present in nearly all plant tissues, with a notable concentration in leaves, stems, and seeds. The exploration of natural antioxidants derived from plants has experienced a significant surge in recent years, aiming to enhance their accessibility [9]. The plants have antioxidant systems comprising non-enzymatic and enzymatic antioxidants (i.e., peroxidase, superoxide dismutase, glutathione reductase, catalase, etc.), which alleviate the negative impacts of oxidative stress [10, 11]. Understanding the prevailing genetic variability, magnitude of heritability, and correlation of agronomic traits plays a vital role in the effective use of germplasm [3]. Extensive research has recently been carried out on the potential of food byproducts as an antioxidant-rich source that could be applied as food additives [12, 13]. Bioactive compounds extracted from byproducts (the agro-food chain) could be one of the most promising means of producing natural antioxidants [14].
Members of the AP2 subfamily are involved in a variety of molecular pathways associated with plant growth, development, and response to various environmental stresses by regulating target gene expression [15]. Apetala2/ethylene responsive factor (AP2/ERF) and WRKY genes are major components of complex regulatory networks in plants during developmental processes and defense responses [16, 17]. Several AP2 genes mediate the biosynthesis of storage compounds during seed development in Arabidopsis [18]. The AP2 transcription factors (TFs) have been documented to be involved in various processes, such as glycolytic and fatty acid biosynthesis [19]. Additionally, the AP2 TFs play roles in regulating germination and seedling growth and suppressing flowering and embryonic development [20], particularly under the influence of the microRNA miR172 [21].
Specifically, the genes Flowering Locus C (FLC), Suppressor of Overexpression of Constants 1 (SOC1), and Short Vegetative Phase (SVP) integrate signals from different flowering time regulatory pathways to regulate flowering transition [22-24]. These genes can either be positive regulators (SOC1, AGL24) or negative regulators (FLC, SVP) of genes regulating the identity of the flower meristem [25, 26].
Previous studies have extensively explored the intricate mechanisms underlying the regulation of flowering in fruit plants [27-29]. The process is found to be highly complex, governed by multiple pathways and intricate gene interactions. These investigations have delved into the molecular intricacies and signaling cascades that orchestrate the precise timing and development of flowers in fruit-bearing plants. The findings underscore the importance of understanding the diverse genetic and molecular factors that contribute to the intricate floral regulatory networks in fruit plants, providing valuable insights for horticultural practices, crop management, and genetic improvement strategies [30, 31]. Until now, a multitude of genes associated with flowering have been recognized. Among these, key genes FLC, flowering locus T (FT), SOC1, leafy (LFY), apetala 1 (AP1), and fruitful (FUL) have been extensively identified and thoroughly characterized for their roles in initiating the flowering process in Arabidopsis thaliana. These primary genes, through their well-established functions, play pivotal roles in orchestrating the complex molecular events that culminate in the induction of flowering in this model plant species [32, 33] However, the functional characterization of genes involved in flower growth and development is not yet clear in many fruit plants.
Species such as Arabidopsis thaliana, Petunia hybrida, Antirrhinum majus, and Oryza sativa are used as model plants for the development of flower organs in plants and to reveal the genetic and molecular mechanisms of flower formation [34]. Members of the AP2 subfamily are involved in many molecular pathways associated with plant growth, development, and response to various environmental stresses by regulating target gene expression [15]. SPL proteins control the expression of the FUL, LFY, and AP1 genes by directly binding to their regulators [35]. Genes derived from auxin play a role in ethylene biosynthesis, indicating that the regulation of capsule numbers in sesame is influenced by plant hormones. An Arabidopsis homolog of SiACS8, identified as AT4G37770 (AtACS8), shares similarities and may contribute to similar regulatory mechanisms [36]. Beta glucosidases in plants are involved in several biological functions, such as defensive symbiosis, cell wall catabolism and lignification, signaling, and plant secondary metabolism functions. Furthermore, many beta glucosidases genes are induced by biotic and abiotic stresses or form a successful response to these stressors [37].
The genetic resources for flower development, however, are limited to three-capsule and single-capsule molecular mechanisms in sesame. Molecular studies on flower buds, sepals, petals, ovules, and finally flower development are required to reveal the genetic mechanism of reproductive development in sesame. This study was carried out to determine the physiological and molecular mechanisms of three-capsule and single-capsule sesame cultivars that are effective in flower formation genes. Seven different genes (APETALA1, APETALA2, SPL4, SOC1, AT4G37770, SILPT3, and beta-glucosidase) were identified for the transcriptomic analysis. The findings reported in this paper provide some information about the molecular and enzyme mechanisms underlying triple encapsulation and single encapsulation events in sesame plants.
Materials and Methods
The study was carried out in the experimental area of the Department of Field Crops, Faculty of Agriculture, Siirt University, in 2017 and 2018. The sesame varieties, i.e., ‘Arslanbey’ (three capsules) and ‘Hatipoğlu’ (single capsule), were used in the study. The seeds of both varieties were sown manually on July 5, 2017, and June 28, 2018. The experiment was set up in a randomized block design with three replications. In the trial, each plot was designed with a length of six meters, four rows per plot, and a row spacing of 70 cm, resulting in a total plot area of 16.8 square meters. Considering the soil analysis, diammonium phosphate and urea fertilizers were applied homogeneously in each plot before planting, with 80 kg of phosphorus and 40 kg of nitrogen per hectare [38]. In both years of the experiment, irrigation was carried out with the drip irrigation method on average 5-6 times. Harvesting was carried out on October 15 2017 and on October 23 2018.
Based on the flowering periods of the varieties, leaf samples were taken during the flowering phase for nine weeks (one week before the start of flowering, the week when flowering started, 1, 2, 3, 4, 5, 6, and 7 weeks after flowering initiation). Selected leaf samples were sterilized with 70% ethyl alcohol and placed in labeled bags, and the bags were immediately placed in foam containing dry ice. The samples were kept at -80ºC in the Hailer ultra-low temperature (ULT) DW-86L486 model freezer without delay, located in the Siirt University Science and Technology Application and Research Centre Laboratory.
Soil Properties of the Experimental Area
The soils of the experimental field had a clayey texture and were non-saline (salt-free), slightly calcareous and low in organic matter, phosphorus, and potassium, as well as being slightly acidic in 2017 and slightly alkaline in 2018.
Meteorological Data
The long-term average temperature of the study region was 24.8ºC, the average maximum temperature was 40.5ºC, the average minimum temperature was 18.4ºC, and the average relative humidity was 35.7%. Compared to the long-term average of the study area, the average temperature was 1.9ºC higher in both years. The average maximum temperature was 32.9ºC, which was below the long-term average. The average minimum temperature values were close to the long-term data. The average relative humidity values remained below average for different years.
Antioxidant Analysis
The iron chelating activities of the samples were modified according to the method of Dinis et al. [39]. The method proposed by Benzie and Szeto [40] was used to determine the FRAP reduction capacity. The DPPH radical scavenging activities of the obtained compounds were performed according to the method of Blois [41].
Catalase and Peroxidase Activity Analysis
The catalase (CAT) enzyme activity was determined according to the method of Aebi [42]. The POD enzyme activity was determined under laboratory conditions using the method of Kalın [43]. The absorbance difference at 470 nm was calculated for the enzyme activities.
Total Ribonucleic Acid (RNA) Isolation
Total ribonucleic acid (RNA) from collected leaf samples was isolated by using the chemical TRIzol (Invitrogen). 100 mg of plant samples were digested with liquid nitrogen and homogenized in 2 mL sterile tubes containing 1 mL of TRIzol reagent. The homogenized samples were kept at room temperature for 5 minutes, and the nucleoprotein complexes were completely separated. For 1 mL of TRIzol reagent, 0.2 mL of chloroform was added to the tubes. The tubes were shaken vigorously by hand for 15 seconds, kept at room temperature for 2-3 minutes, and then centrifuged at 15,000 rpm for 20 minutes at 4ºC. The upper liquid phase was transferred to a new tube and mixed with isopropyl alcohol to allow the precipitation of RNA. Half of the TRIzol reagent used during homogenization was added to the isopropyl alcohol. After the samples were kept at room temperature for 10 minutes, they were centrifuged at 15,000 rpm for 10 minutes at 4ºC. The RNA precipitate was washed with 75% ethanol for each 1 mL of TRIzol reagent used. After mixing the samples with a vortex, they were centrifuged at 10,000 rpm for 5 minutes at 4ºC. After the RNA precipitate was left to dry for 5-10 minutes, it was dissolved in 30 µl of sterile deionized water (ddH₂O) and kept at 55-60ºC for 10 minutes.
cDNA Synthesis
The expression levels of leaf samples were characterized by the qRT-PCR. Firstly, cDNA was synthesized, the total RNAs of the tissues were cleaned, and the mixture formed by adding the components determined for cDNA was kept at 65ºC for 5 minutes and then immediately placed on ice.
Quantification of Some Genes in Single and Triple-Capsule Samples by qRT-PCR
Forward (F) and reverse (R) primers designed for target genes (APETALA2, SPL4, SOC1, AT4G37770, SILPT3, APETALA1, beta-glucosidase) detected by bioinformatics methods were designed using Primer3 software. The primers were designed to amplify a region of the target gene up to 200 bp. For the quantitative analysis of each target gene, specific mixtures were prepared. 2 µl of 1/10 dilutions of cDNAs synthesized from total RNAs purified after isolation for seven different libraries were used in three replications. The experiment was started following the equalization of the cDNA density in each library based on the 18S rRNA gene.
In qRT-PCR experiments with genes, the optimum binding temperature for the primer of each different gene was optimized. The samples were denatured at 95ºC and kept at 65ºC for the melting curve analysis. Fluorescence signals were taken at 530 nm from 65ºC to 95ºC per second against a 0.5ºC gradient increase. The results were analyzed using Picoreal (Thermo) software.
Statistical Analysis
Each experiment was performed in triplicate, and the results were presented as mean values. We employed analysis of variance (ANOVA) to assess statistical differences between sesame varieties and weeks. Following a significant ANOVA result, means were compared using the LSD multiple range test to identify specific treatment groups that differed from each other. All statistical analyses were performed using JUMP (version 7.1) software.
Results and Discussion
The percentage of iron-metal chelating, FRAP, DPPH, catalase, and peroxidase enzyme activities in the leaf tissues of the cultivars and the expression levels of APETALA1, APETALA2, SPL4, SOC1, AT4G37770, SILPT3, and beta-glucosidase genes involved in flower formation were studied.
The highest average iron chelation percentage value (12.78%) was recorded for the single-capsule cultivar. The highest average value (21.61%) was noted during the 1st week, followed by the 6th, 9th, 8th, 3rd, 4th, 7th, 1st, and 5th weeks, respectively (Table 1). The highest mean value (37.13%) was noted for the single-capsule cultivar (Table 1). Zhao et al. [44] stated that metal chelation activities in barley varieties ranged from 1.15 to 2.06 µmolEDTA/g.
The individual and interactive effects of cultivars and weeks were significant (p<0.01) for FRAP absorbance (Table 2). The highest average FRAP absorbance (0.74) was recorded for the single-capsule cultivar in the 2nd week, and 0.70 in the 9th week after flowering initiation. Regarding cultivar × week interaction, the highest FRAP absorbance values were recorded during the 2nd week (0.74) and the 9th week (0.70) for the single-capsule cultivar (Table 2).
The DPPH value was significantly (p<0.01) altered by the individual and interactive effects of cultivars and weeks (Table 1). The highest DPPH value (25.60 inhibition) was recorded for the single-capsule cultivar. Regarding weeks, the highest inhibition (29.75%) was noted during the 3rd week, followed by the 4th, 2nd, 1st, 9th, 7th, 8th, 5th, and 6th weeks, respectively. The highest mean DPPH value (32.88%) in cultivar × week interaction was noted for the 4th week × single-capsule cultivar (Table 3).
The order of DPPH radical scavenging activity in single and triple-capsule cultivars and BHA and trolox standards were Troloks (89.45%)>BHA (78.04%)>single-capsule cultivar (32.88%)>triple-capsule (28.33%) cultivar. The order of FRAP activity was BHA>trolox >single-capsule cultivar>triple-capsule cultivar> control; the absorbance values were 1.96, 1.48, 0.98, 0.57, and 0.41, respectively. The iron chelating activity in the single-capsule cultivar (37.14%) was higher than that of the triple-capsule cultivar (16.59%).
The difference in catalase enzyme activity in week and cultivar × week interaction was highly significant (p<0.01), while cultivar remained non-significant in this regard (Table 4). The highest mean catalase value (31.97 EU/mL) was obtained before flowering initiation, followed by the 3rd, 7th, 8th, 4th, 9th, 6th, 5th, and 2nd weeks after flowering, respectively. The highest average catalase value in cultivar × week interaction (36.26 EU/mL) was recorded during the 1st week for the three-capsule cultivar (Table 4).
Table 1.
The analysis table of Iron chelation data of the leaf tissues of the cultivars.
[i] **; P<0.01, LSD: Least significant difference, CV: coefficient of variation,1: Before Flowering 1. Week, 2: Flowering Period, 3: After Flowering 1. week, 4: After Flowering 2. week, 5: After Flowering 3. week, 6: After Flowering 4. week, 7: After Flowering 5. week, 8: After Flowering 6. week, 9: After Flowering 7. week
Table 2.
The variance analysis of FRAP absorbance in leaf tissues of cultivars Table 1. The analysis table of Iron chelation data of the leaf tissues of the cultivars.
[i] **; P<0.01, LSD: Least significant difference, CV: coefficient of variation, 1: Before Flowering 1. Week, 2: Flowering Period, 3: After Flowering 1. week, 4: After Flowering 2. week, 5: After Flowering 3. week, 6: After Flowering 4. week, 7: After Flowering 5. week, 8: After Flowering 6. week, 9: After Flowering 7. week
Table 3.
The variance analysis for DPPH % inhibition in leaf tissues of cultivars.
[i] **; P<0.01, LSD: Least significant difference, CV: coefficient of variation, 1: Before Flowering 1. Week, 2: Flowering Period, 3: After Flowering 1. week, 4: After Flowering 2. week, 5: After Flowering 3. week, 6: After Flowering 4. week, 7: After Flowering 5. week, 8: After Flowering 6. week, 9: After Flowering 7. week
Table 4.
The variance analysis for Catalase enzyme (EU/mL) activity in leaf tissues of cultivars.
[i] **; P<0.01, LSD: Least significant difference, CV: coefficient of variation, ns: not significant, 1: Before Flowering 1. Week, 2: Flowering Period, 3: After Flowering 1. week, 4: After Flowering 2. week, 5: After Flowering 3. week, 6: After Flowering 4. week, 7: After Flowering 5. week, 8: After Flowering 6. week, 9: After Flowering 7. week
Table 5.
The variance analysis for Peroxidase enzyme activity (EU/mL) in leaf tissues of cultivars.
[i] **; P<0.01, LSD: Least significant difference, CV: coefficient of variation, 1: Before Flowering 1. Week, 2: Flowering Period, 3: After Flowering 1. week, 4: After Flowering 2. week, 5: After Flowering 3. week, 6: After Flowering 4. week, 7: After Flowering 5. week, 8: After Flowering 6. week, 9: After Flowering 7. week
The peroxidase enzyme activity was significantly (p<0.01) affected by individual and interactive effects of cultivars and weeks (Table 5). The highest average peroxidase value (0.15 EU/mL) was noted for the three-capsule cultivar during the 8th week after flowering, followed by the 9th, 4th, 5th, 6th, 7th, 3rd, 1st, and 2nd weeks after flowering, respectively.
Molecular Analyses
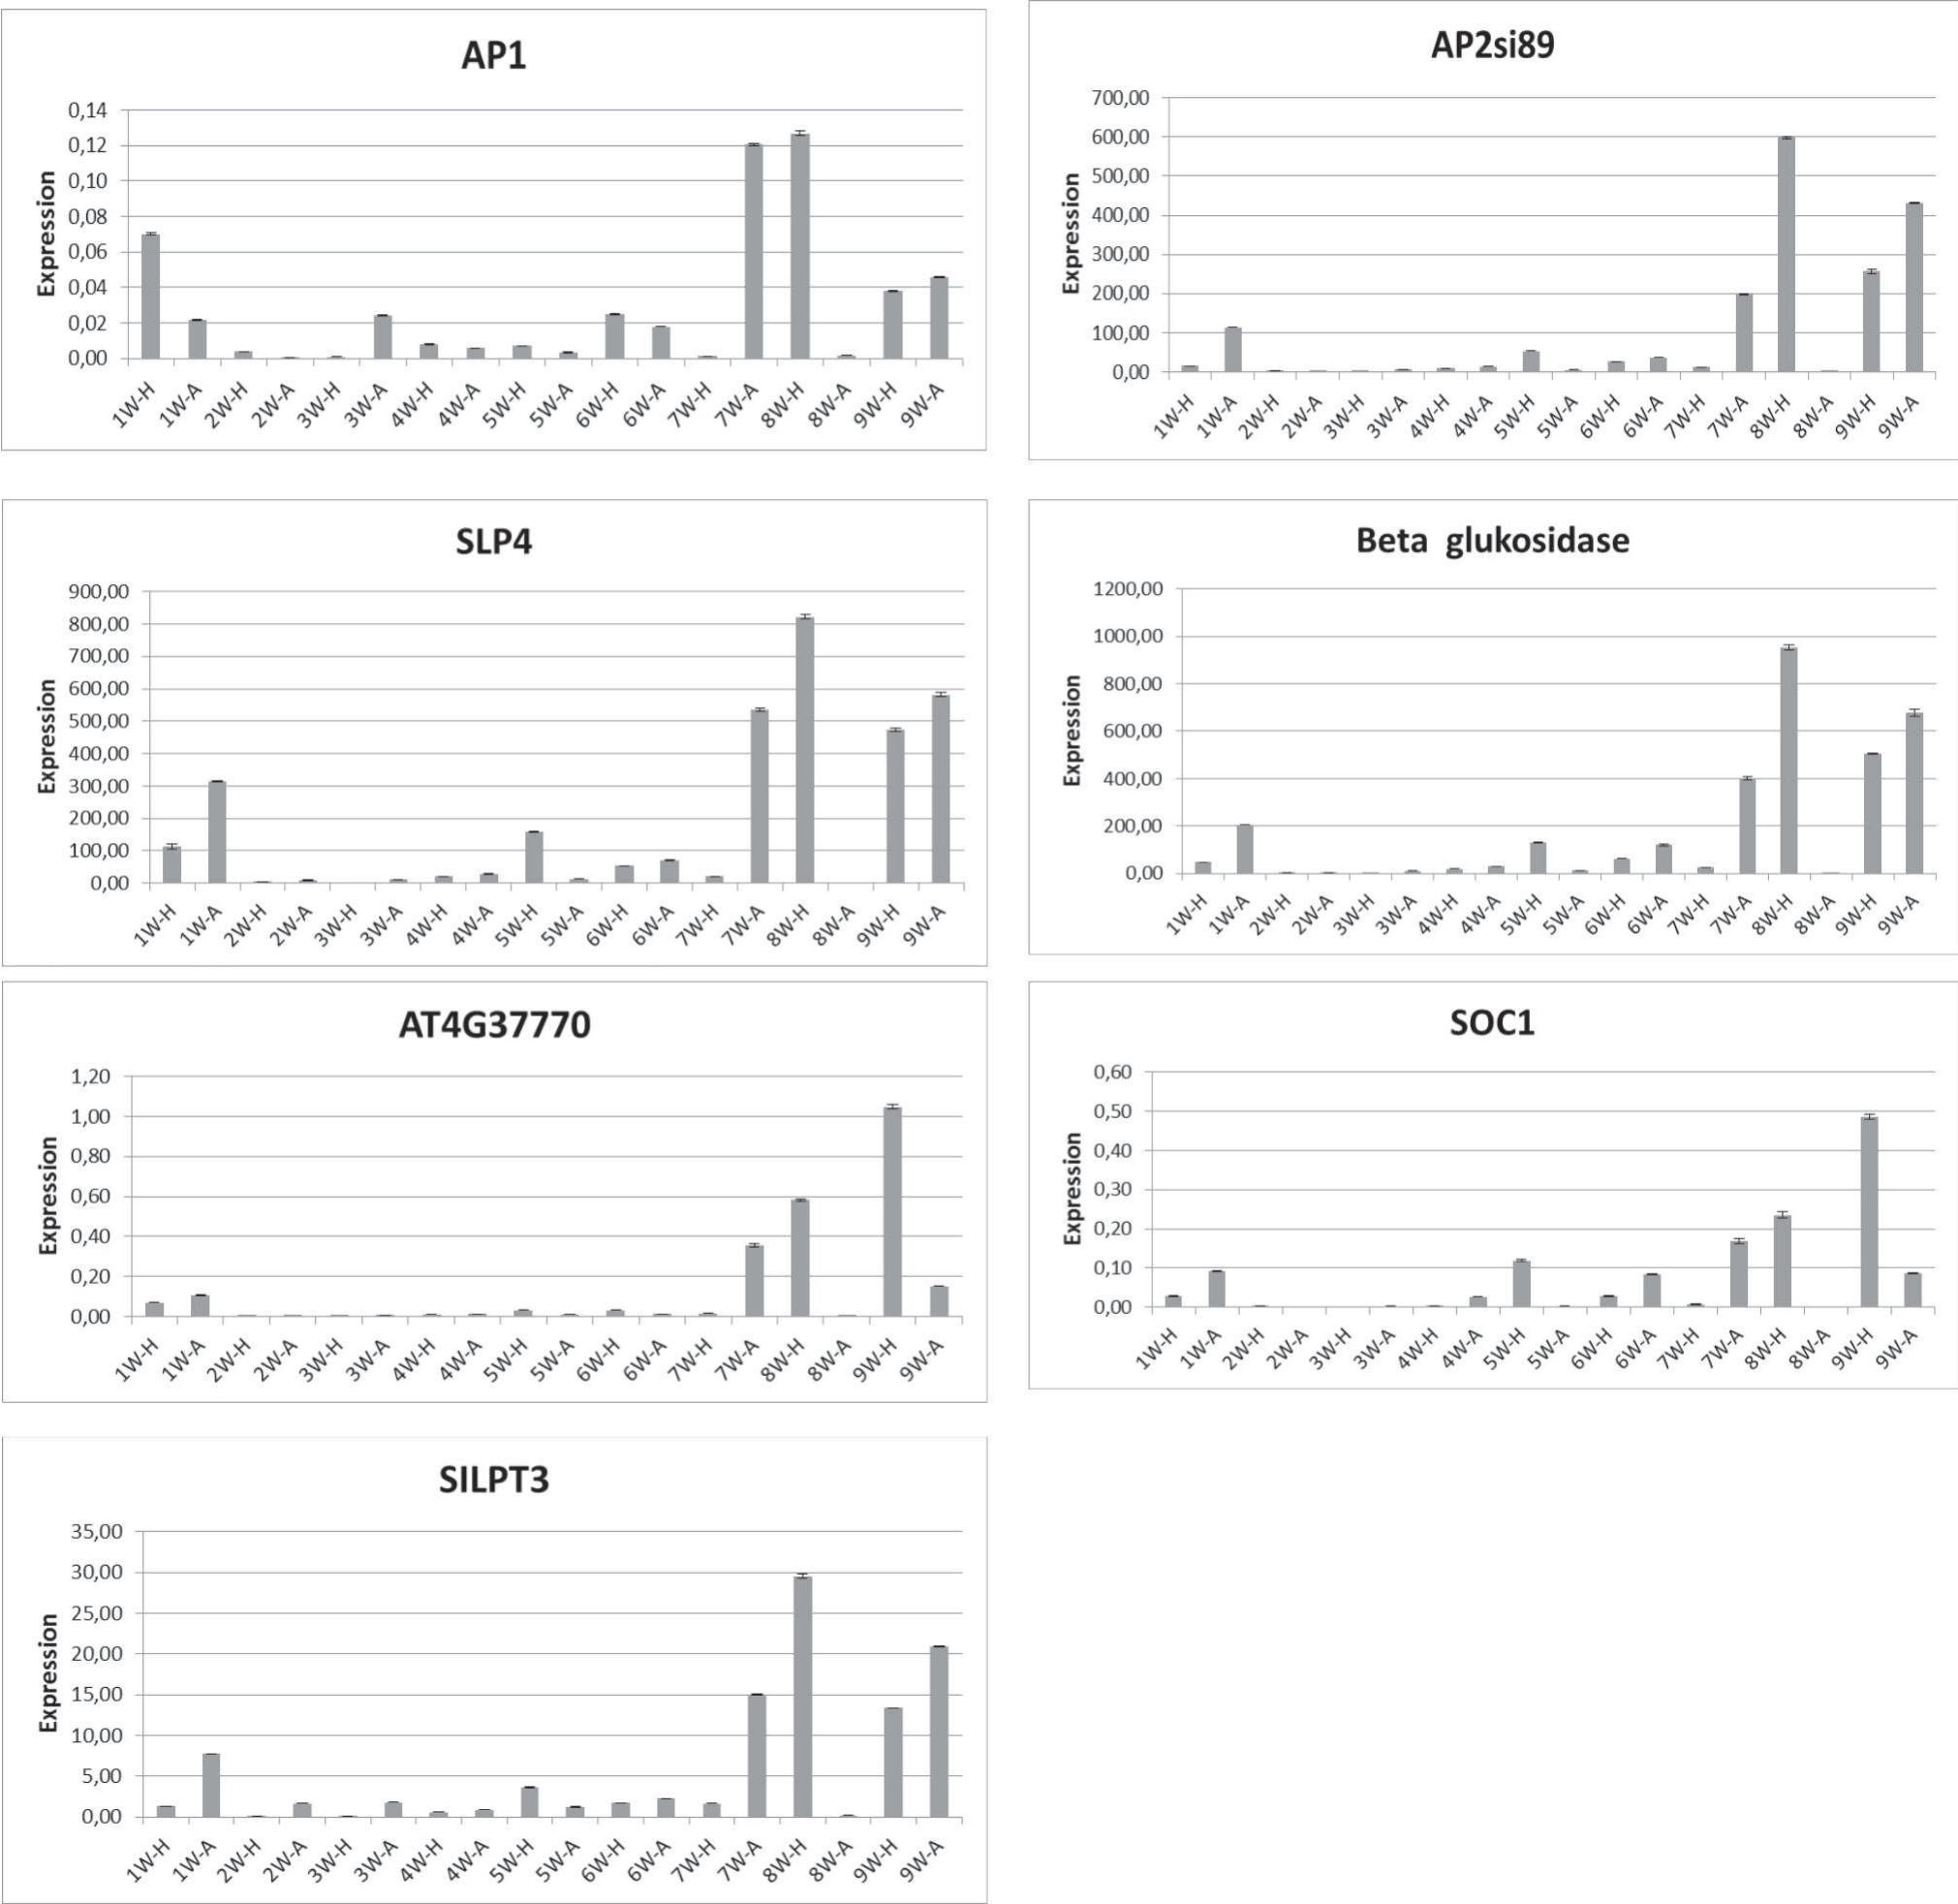
Expression levels of APETALA1, APETALA2, SPL4, SOC1, AT4G37770, SILPT3, and beta-glucosidase genes are given in Fig 1.
The AP1 gene was intensely increased in the single-capsule cultivar during the 6th week after flowering initiation. The Hatipoğlu cultivar had a single flower characteristic and formed only one capsule in the leaf axil.
Loss of function mutations in APETALA1 cause partial conversion to a flower-like identity rather than flower meristems. In addition, the co-production of APETALA1 and LFY double mutants did not result in flower formation [45].
The APETALA2 gene was intensely detected in 8W-H, 9W-A, 9W-H, 7W-A, 1W-A, 5W-H, 6W-H, 4W-A, 4W-H, 1W-H, 7W-H, 3W-A, 6W-A, 5W-A, and 2W-H samples (Fig. 1). However, the APETALA2 gene was almost not detected in 2W-A, 3W-H, and 8W-A samples.
Moreover, the expression of the APETALA2 gene exhibited notable elevation in the single-capsule cultivar, akin to the heightened expression observed for the APETALA1 gene during the 6th week post-flowering. Prior research has highlighted the influence of the APETALA2 gene on augmenting the overall oil content of seeds [46, 47]. The Hatipoğlu cultivar, characterized by a high oil rate, showcased an active APETALA2 gene. These results underscore the significant impact of the APETALA2 gene on the oil content of the Hatipoğlu cultivar.
The SPL4 gene was intensely detected in 8W-H, 9W-A, 7W-A, 9W-H, 1W-A, 5W-H, 1W-H, 6W-A, 6W-H, 4W-A, 4W-H, 7W-H, 5W-A, 3W-A, 3W-H, 2W, 2W-H, and 8W-A samples, respectively (Fig. 1). Furthermore, the expression of the SPL4 gene exhibited a substantial increase in the single-capsule cultivar, resembling the heightened expression patterns observed for the APETALA1 and APETALA2 genes in the 6th week after flowering initiation. It is noteworthy that SPL proteins exert control over the expression of FUL, LFY, and AP1 genes by directly binding to their regulatory elements [48].
The beta glucosidase gene was detected at high density in 8W-H, 9W-A, 9W-H, 7W-A, 1W-A, 5W-H, 6W-A, 6W-H, 1W-H, 4W-A, 4W-H, 7W-H, 5W-A, 3W-A, 3W-H, 2W-A, 2W-H, and 8W-A samples, respectively (Fig. 1). In addition, the beta glucosidase gene was very high in the single-capsule cultivars in the 6th week after flowering initiation.
The AT4G37770 gene was intensely detected in 9W-H, 8W-H, 7W-A, 9W-A, 1W-A, 1W-H, 5W-H, 6W-H, 6W-A, 7W-H, 5W-A, 4W-A, 4W-H, and 3W-A A samples, respectively (Fig. 1). Whereas, the AT4G37770 gene was almost not detected in 3W-H, 2W-A, and 2W-H, 8W-A samples. The AT4G37770 gene was very high in the single-capsule cultivar in the 6th week after the onset of flowering.
The SOC1 gene was intensely detected in 9W-H, 8W-H, 7W-A, 5W-H, 1W-A, 6W-A, 9W-A, 1W-H, 6W-H, 4W-A, 7W-H, 4W-H, 3W-A, and 2W-H samples, respectively (Fig. 1). However, the SOC1 gene was almost not detected in 3W-H, 2W-A, 5W-A, and 8W-A samples. The SOC1 gene was very high in the single-capsule cultivar in the 7th week post-flowering.
The SILPT3 gene was intensely detected in 8W-H, 9W-A, 7W-A, 9W-H, 1W-A, 5W-H, 6W-A, 3W-A, 6W-H, 2W-A, 7W-H, 1W-H, 5W-A, 4W-A, 4W-H, 2W-H, and 8W-A samples, respectively (Fig. 1). However, the SILPT3 gene was almost not detected in the 3W-H sample. In addition, the SILPT3 gene was quite high in the single-capsule cultivar in the 6th week after the onset of flowering.
The oxidative stability of sesame oil obtained from whole seeds is higher than that extracted from de-husked seeds [49]. El-Roby et al. [50] stated that the ethanol extract of sesame seed coat has an antioxidant 1W-H: 1th week-Hatipoğlu, 1W-A: 1th week-Arslanbey, 2W-H: 2th week-Hatipoğlu, 2W-A: 2th week-Arslanbey, 3W-H: 3th week-Hatipoğlu, 3W-A: 3th week-Arslanbey, 4W-H: 4th week-Hatipoğlu, 4W-A: 4th week-Arslanbey, 5W-H: 5th week-Hatipoğlu, 5W-A: 5th week-Arslanbey, 6W-H: 6th week-Hatipoğlu, 6W-A: 6th week-Arslanbey, 7W-H: 7th week-Hatipoğlu, 7W-A: 7th week-Arslanbey, 8W-H: 8th week-Hatipoğlu, 8W-A: 8th week-Arslanbey, 9W-H: 9th week-Hatipoğlu, 9W-A: 9th week-Arslanbey activity like copherol. Besides, the antioxidant activity of a black sesame coat was higher compared to a white sesame coat [51]. Previous studies reported that antioxidant activity has a positive correlation with the phenolic content of sesame seeds [52-54].
Fig. 1.
Expression levels of the apetala1 (AP1), apetala2 (AP2), SPL4, SOC1, AT4G37770, SILPT3 and betaglucosidase genes in leaf tissues of different flowering periods of cultivars
The CAT and POD enzyme activities were higher in both cultivars before the beginning of flowering compared to the flowering period, and the activities decreased at the beginning of the flowering period. The results showed that plants stored enzymes in preparation for flowering and consumed them during the flowering period. The enzyme activities increased following the flowering period in both cultivars.
Numerous studies have demonstrated that an increased accumulation of phenolic compounds in plants can serve as a protective mechanism against diseases. This enhanced phenolic accumulation is associated with heightened activity of defense-related enzymes, contributing to the plant’s ability to resist and combat various pathogens [55-57]. The findings presented by Zhou et al. [58] underscore the significant roles played by the APETALA1/FUL, AP3/PI, AGL104, and SOC1 genes in the intricate process of floral organ formation in E. agallocha. Furthermore, Song et al. [59] conducted a comprehensive analysis, identifying genes with pronounced expression across more than three tissues, such as SiLTPXI.7 and SiLTPI.24, which exhibited exclusive expression in flowers, stems, and leaves. In their investigation of nsLTP genes across different tissues in four sesame genotypes, the researchers revealed that the -nsLTP genes serve as primary contributors to the elevated oil content observed in sesame seeds. Therefore, the high oil rate of the Hatipoğlu cultivar can be attributed to the high SILPT3 gene in the single-capsule Hatipoğlu cultivar. The findings suggest that SiLTPI.23 and SiLTPI.28 may interact with APETALA2 transcription factors to promote oil accumulation in sesame seeds by inducing fatty acid and other lipid biosynthesis in developing seeds and by enhancing their transfer from other sesame tissues into developing seeds [59].
The gene expression levels related to the encapsulation status in leaf tissues of the cultivars were analyzed for 9 weeks. The results showed that 8W-H is prevalent in the expression levels of APETALA1, APETALA2, SPL4, SILPT3, and beta-glucosidase genes, while 9W-H was mostly observed in the expression levels of SOC1 and AT4G37770 genes.
Conclusions
The antioxidant properties of sesame seeds, attributed to compounds like sesamin and sesamolin, counteract oxidative stress through enzymatic activities. The single-capsule cultivar exhibited the highest antioxidant levels, potentially due to efficient antioxidant transfer from leaves to seeds, while enzyme activities peaked before flowering, suggesting preparation for the flowering transition. Transcript profiling revealed key transcription factors regulating hormone response and floral organ identity, with genes related to nutrient assimilation playing critical roles in flower growth. Further research is needed for the functional characterization of candidate genes, and combining transcriptome data from diverse genotypes and developmental stages could enhance understanding of sesame flower development.

