

Introduction
With the increasing concern for resource environment and ecological issues, green innovation has increasingly become a focal point of research for scholars at home and abroad. While green innovation and green technology are developing rapidly, the operation and development of innovation ecosystems are also incorporating green elements, enriching the composition of the aspects of innovation ecosystems, improving the way of collaborative innovation among multiple actors, breaking down the boundaries of industries, regions, and enterprises, and continuously promoting the innovation process [1]. Therefore, an in-depth study of synergistic innovation among various subjects to achieve long-term stability of the green innovation ecosystem is of great significance for reducing pollution, realizing green growth, and improving the supply and industrialization of green technology. It also provides theoretical guidance for the stability of green innovation ecosystems of various specialties formed subsequently.
Research on green innovation ecosystems is at a developmental stage, although there is a consensus among academics on the prospects for development and the central role of green innovation ecosystems [2, 3]. In previous studies, scholars have mainly focused on the connotation, characteristics, and generation mechanisms of green innovation ecosystems and have a preliminary understanding of green innovation ecosystems [4]. Ying et al. and Lin et al. explored the internal and external drivers of green innovation ecosystems, mainly the institutional environment, the environment of academic and research institutions, and the internal environment of enterprises [5, 6]. Phuyal et al. emphasize that the critical factor for the stable development of green innovation ecosystems is technological innovation [7]. Based on the complexity of technological innovation, green innovation increasingly relies on synergistic exchanges and integration among multiple subjects [8]. In contrast, the innovation ecosystem emphasizes synergistic symbiosis to achieve value co-creation through inter-subjective collaborative innovation [9]. Guo et al. found that the central bodies of innovation within the green innovation ecosystem are mainly core enterprises, academic and research institutions, and the government [10].
The marginal contribution of this paper is as follows:
(1) The innovation subjects within the system are divided into core enterprises, academic and research institutions, and the government to discuss how the innovation subjects make decisions to maximize benefits in the evolution of green innovation ecosystems. (2) Based on the synergistic theory, it constructs the game model of innovation subject evolution and contributes to the synergistic theory. (3) It simulates the dynamic evolution process of innovation subjects and analyzes the agglomeration effect of different policies and measures in other contexts. (4) The synergy coefficient of green innovation benefits and the synergy coefficient of green innovation costs are incorporated into the variable hypotheses to explore the impact of the synergy value generated under the synergy effect on the evolution of green innovation ecosystems and provide a quantitative basis for green collaborative innovation.
Theoretical Basis and Literature Review
Green Innovation Ecosystems
Some scholars have defined the concept of green innovation ecosystems in recent years. J. Zeng et al. believe that the goal of the green innovation ecosystem is to enhance the green innovation capacity and promote the emergence of green innovation as the goal between various types of innovation subjects and the innovation environment. Through the flow and interaction of innovation factors, they continue to encourage the development of green innovation and then form a symbiotic competition, the dynamic evolution of the complex system [11]. Deng et al. constructed a multi-factor green innovation ecosystem analysis framework containing government, enterprises, research institutions, public society, universities, and the natural environment based on the five-helix element analysis model, laying a theoretical foundation for studying green innovation ecosystems [12]. Qu et al. explore the relationship between the government, financial institutions, and enterprises in the green innovation ecosystem of the three-party evolutionary game and analyze the impact of the initial willingness of innovation subjects [13]. Su et al. investigated the stabilization strategies of government, enterprise, and public participation in green technology innovation through an evolutionary game model [14].
Multi-Major Collaborative Innovation
Synergy theory, proposed and founded by the German physicist Hermann Hacken, reveals how an open system can spontaneously transform from an unstable disordered state to a stable ordered state through the synergistic action between internal subsystems when there is an exchange of matter or energy with the outside world [15]. Wang and Bai believe that the subject of collaborative innovation is no longer just a “point-to-point” cooperative relationship but the establishment of a dynamic relationship across the institutional boundaries of the network. Collaborative innovation is the inevitable requirement to overcome the “neck” technology, but also to break through the foundation of the green key innovation technology [16]. The cooperative relationship of collaborative innovation among multiple subjects is dynamic. Changes in the subtle behavior of the issues will affect the collective innovation network topology and the network relationship, affecting collaborative innovation performance [17]. A heterogeneous multi-body collaborative innovation network mainly involves industry-university-research collaborative innovation and constructs the network evolution model, whose nodes are enterprises, universities, research institutions, governments, et al. [18].
Review of Existing Research
The existing research dimensions need to be deepened urgently, and there are still the following deficiencies: First, domestic scholars have studied more of the two-party evolutionary game between industry, academia, and research, but fewer have studied the three-party evolutionary game of government, industry, academia, and research. Secondly, most of the existing studies focus on the theoretical mechanism and rarely use mathematical methods for quantitative research. Finally, there needs to be more literature on constructing stochastic evolutionary game models from a multi-actor collaborative innovation perspective. This paper establishes a tripartite evolutionary game model of the government, core enterprises, academic, and research institutions based on revenue optimization explores the stabilization of the equilibrium of interests of different innovation subjects in green innovation ecosystems in the process of green technological innovation, as well as the influence of various elements on the decision-making of the issues, and validates the model by using Matlab simulation software, which provides a theoretical basis for the evolutionary game of multi-subjects’ collaborative innovation in green innovation ecosystems. Therefore, the research in this paper has important theoretical and practical significance.
Model Construction
Description of the Problem
From an ecological point of view, the green innovation ecosystem consists of two parts: the green innovation environment and the green innovation main body. In this paper, the core layer of the green innovation ecosystem mainly contains core enterprises, government, academic and research institutions, and other innovation subjects; the auxiliary layer mainly contains financial institutions, intermediary organizations, competitive, and complementary enterprises, green supply chain upstream and downstream enterprises, and other related interest groups and other subjects; and the environmental layer mainly contains the scientific and technological environment, the economic environment, the market environment, the institutional environment, the natural environment, and other innovation environments. In this paper, the dynamic evolution game model of the green innovation ecosystem is constructed with the core layer as the main body of the model.
Green Innovation Ecosystem Game Modeling
Basic Assumptions and Parameterization
Hypothesis 1: Participating subjects. In the green innovation ecosystem innovation game, the game subjects include core enterprises (E), academic and research institutions (S), and the government (G). Three-party game subjects interact, and each issue in the “information asymmetry” and “limited rational man” under the game’s premise is discussed several times to find the optimal interests of the strategy.
Hypothesis 2: Engagement Strategies. The subjects of the three-party game choose whether to participate in the green innovation ecosystem. (x participates, 1 – x does not participate) is the strategic and probabilistic choice of the government, (y synergizes, 1 – y does not synergize) is the strategic choice of the core firms, and (z synergizes, 1 – z does not synergize) is the strategic choice of the academia and research institutes, x, y, z∈[0,1]. During the evolutionary game, the three groups change their strategies and seek Nash equilibrium during the game.
Hypothesis 3: Initial Innovation Costs and Synergy Costs. The green innovation activities of core enterprises need to invest in R&D costs, noting that the green innovation inputs of core enterprises are C1, and the green innovation activities of academic and research institutions need to invest in R&D costs as C2. In the collaborative innovation process between core enterprises and academic and research institutions, let the share ratio coefficient of R&D costs be α. The synergy coefficient of R&D inputs is γ, then the cost of the core enterprise is γα(C1 + C2), and that of the academic and research institutions is γ(1 – α) (C1 + C2).
Hypothesis 4: Initial Innovation Gains and Synergy Gains. In the green innovation ecosystem, the base economic benefits of core firms and academic and research institutions are L1 and L2, respectively. Assuming that the innovation benefit gained by the core enterprise in green innovation alone is R1, the innovation benefit gained by the academic and research institutions in green innovation alone is R2, the coefficient of the share ratio of the green innovation benefit when both parties cooperate is β, and the synergy coefficient of the green innovation benefit is μ, the co-innovation use of the core enterprise is μβ(R1 + R2), and the co-innovation help of the academic and research institution is μ(1 – β) (R1 + R2).
Hypothesis 5: Government support. The government formulates regulatory policies, incentives, and penalties for fostering the green innovation ecosystem, assuming that the government’s participation in the co-innovation process generates regulatory costs T, which are zero when the government is lenient. The government provides co-innovation incentives (innovation subsidies and tax incentives) S for the core firms and the academia and research institutes when the two parties cooperate and allocate grants to both parties in the co-innovation process by φ, which is then the co-innovation subsidy given to the core firm is φS and the co-innovation support given to the academy and research institution is (1 – φ)S. The government’s innovation incentive subsidy is S1 (S1 <S) when only one of the core firms and the academic and research institutions chooses to co-innovate. The environmental and social benefits, such as regional economic development, increased employment, and tax revenue, that the government receives when it chooses a participatory strategy is W. b is the coefficient of perceived benefit, which indicates the proportion of the advantage gained under the government’s non-participation to the use acquired by both parties. The gift brought to the government by the government’s choice of non-participation but due to the option of core enterprises, academia, and research institutes to participate in the green innovation ecosystem is expressed by bR1, bR2.
Hypothesis 6: Default. When core enterprises and academic and research institutions are in the process of collaborative innovation, if the two have a breach of contract, the subject must bear the reputation, the amount of money, and other aspects of the penalties faced by the breach of contract. P is the number of liquidated damages to be paid by the core enterprises or academic and research institutions for betraying the agreement. The spillover coefficients of green technologies in core enterprises and research institutions are ρ1 and ρ2, respectively. The party choosing a non-collaborative strategy can “hitchhike” to obtain innovation benefits from the other party, then ρ2R2, ρ1R1 denote the spillover benefits of green technologies obtained by the core enterprises and research institutions exiting from the green innovation ecosystem, respectively.
Hypothesis 7: Punishment. The government has the right to penalize core enterprises and academic and research institutions if, in the course of carrying out collaborative innovation, they engage in negative cooperative behaviors such as believing that green technological innovation under collaboration is less effective and choosing non-collaboration to obtain more innovation benefits, which harms the green innovation ecosystem. The fines imposed on core firms and academic and research institutions for betraying their contracts are ηF, where η is the severity of the government’s penalties on core firms and educational and research institutions, and F is the upper limit of the sentences.
The related parameters in Hypotheses 1-7 are shown in Table 1.
In summary, the green innovation ecosystem innovation subject game payment matrix can be obtained, as shown in Table 2.
Table 1.
Parameter symbols and meanings.
Table 2.
Three-way subject synergistic innovation game matrix.
Model Construction and Solution
The expected benefit function of the government’s choice of the “participation” strategy is:
The expected payoff function for the government’s choice of a “no participation” strategy is:
The average expected return function for the government is:
The expected benefit function of the core firm choosing the “synergy” strategy is:
(4)
The expected payoff function of a core firm choosing the “no synergy” strategy is:
The average expected return function for core firms is:
The expected benefit function of choosing the “synergistic” strategy for academic and research institutions is:
(7)
The expected payoff function for an academic institution choosing the “no synergy” strategy is:
The average expected return function for academic and research organizations is:
Stability Analysis of the Replicated Dynamic Equations for the Subjects of the Three-Party Game
A system of replicated dynamic equations is constructed from Eqs. (1)-(9) to obtain Eqs. (10)-(12).
(11)
(12)
Stability Analysis of Government Gaming Strategies
A first-order partial derivative concerning the variable x in (10) yields:
According to equation (13), let
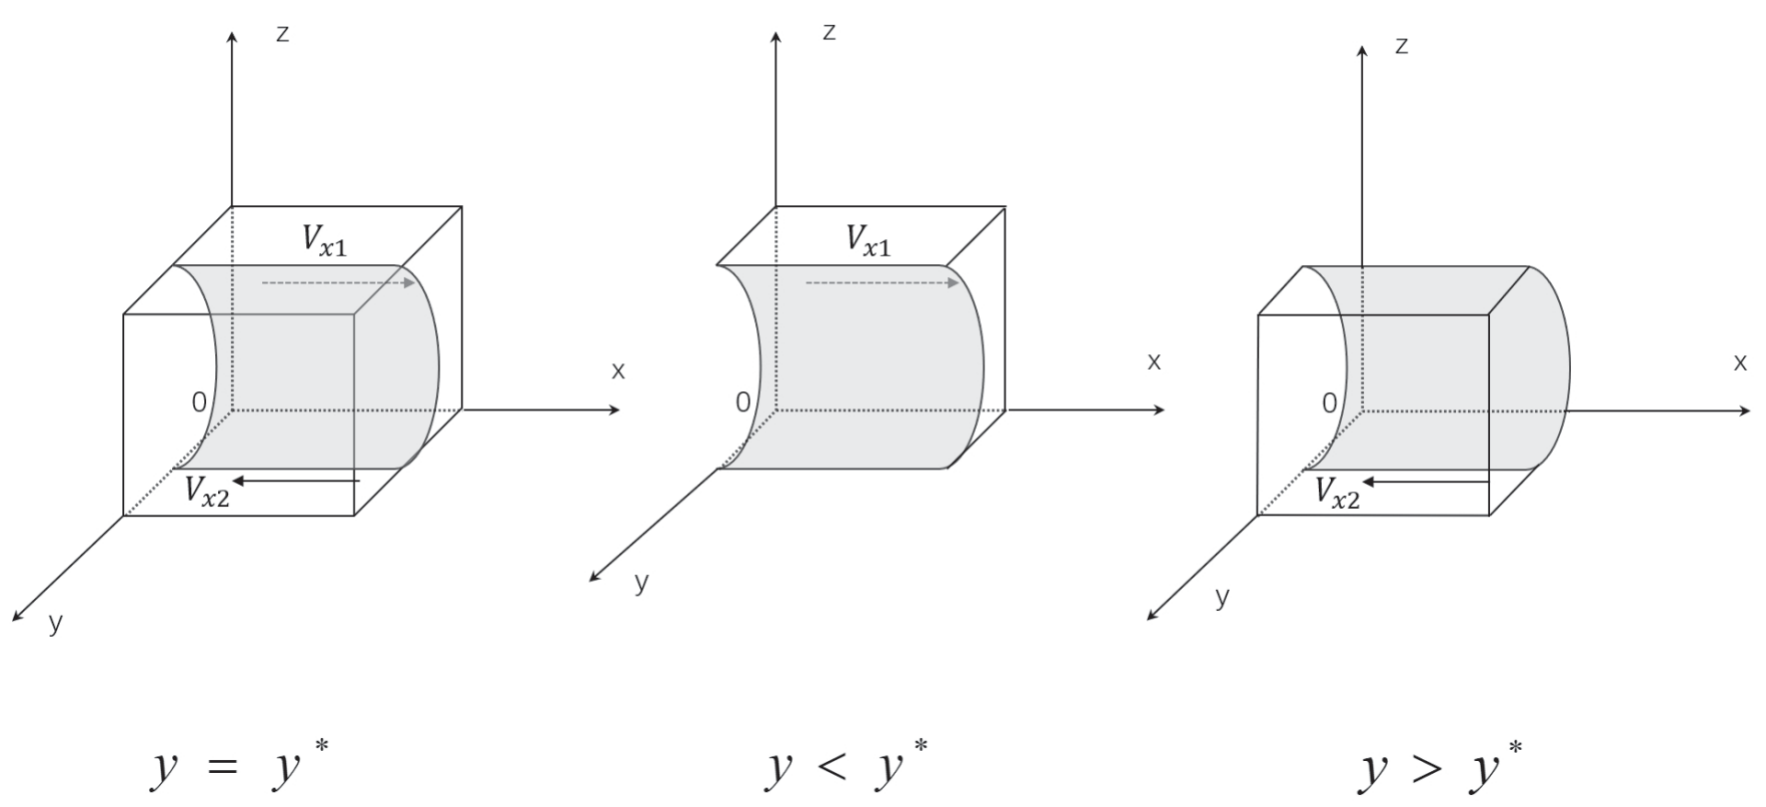
Lemma 1: When y < y∗ , the government evolutionary stabilization strategy is x = 1 ; When y > y∗ , the government evolutionary stabilization strategy is x = 0 .
Proof:
According to the stability theorem of differential equations, if the government’s evolutionary stabilization strategy is to “participate” in the green innovation ecosystem, then it needs to satisfy the following criteria, then it needs to satisfy: F(x) = 0 , and F′(x) < 0 such that:
then
Thus, G(y) is a decreasing function with respect to y. When
Corollary 1: When the initial state of the government’s decision is located in space Vx1 , x = 1 is a stable equilibrium point in space Vx1 , i.e., the government’s game strategy gradually evolves in the direction of “participating” in the green innovation ecosystem. When the initial state of the government’s decision is located in space Vx2 , x = 0 is a stable equilibrium point in space Vx2 , i.e., the government’s game strategy gradually evolves in the direction of “non-participation” in the green innovation ecosystem.
Corollary 2: Parametric analysis. As can be seen from Fig. 1, when W, ηF becomes larger (or S1, T, S becomes smaller), and other parameters remain unchanged, y∗ becomes larger, the cross-section part moves in the positive direction of the y-axis, the space Vx1 becomes more extensive, the area Vx2 becomes smaller, and the probability of the government’s strategic choice tending to be “participation” becomes more considerable.
End of proof.
Stability Analysis of Core Firms’ Game Strategies
A first order partial derivative of F(y) with respect to the variable y in (11) gives:
According to Eq. (14), let
(2) When x ≠ x∗ , two equilibrium points y = 0 and y = 1 are obtained from F(y) ≡ 0 as the two steady state points of the core firm’s game strategy in the system.
Lemma 2: When x < x∗ , the core firm evolves a stable strategy of y = 0 ; When x > x∗ , the government evolves a stabilization strategy of y = 1.
Proof:
According to the stability theorem of differential equations, if “synergy” is the evolutionary stable state of the core firm’s strategy choice, then it needs to be satisfied: F(y) ≡ 0 , and F′(y) < 0 such that:
then
Therefore,
Corollary: Similarly, the analysis of the phase diagram of the evolution of the decision-making behavior of the core firms shows that when C1, C2, ρ2R2 becomes larger (or S1, R1, R2, S, ηF, P becomes smaller) and the other parameters remain constant, x* becomes more extensive, the probability that the core firms’ strategic choices tend to be “un-synergistic” becomes more considerable.
End of proof.
Stability Analysis of Gaming Strategies in Academic and Research Organizations
A first order partial derivative of z with respect to the variable F(z) in (12) gives:
According to Eq. (15), such that
it can be seen that (1) when x = x∗∗ , F(z) ≡ 0 , indicating that at this time, regardless of what value of x, the game strategy of the academic and research institutions in the system is in a stable state, so any z ∈[0,1] is a stable point; (2) When x ≠ x∗∗ , two equilibrium points z = 0 and z = 1 are obtained from F(z) ≡ 0 as the two steady state points of the core firm’s game strategy in the system.
Lemma 3: When x < x∗∗ , the evolutionary stabilization strategy for academic and research institutions is z = 0 ; When x > x∗∗ , the evolutionary stabilization strategy for academic and research institutions is z = 1.
Proof:
According to the stability theorem of differential equations, if “synergy” is an evolutionarily stable state for the strategy choice of academic and research institutions, then it needs to be satisfied: F(z) ≡ 0 , and F′(z) < 0 such that:
then
Therefore,
Corollary: Similarly, the analysis of the phase diagram of the evolution of the decision-making behavior of academic and research institutions shows that when C1, C2, ρ1R1 becomes larger (or S1, R1, R2, S, ηF, P becomes smaller) and the other parameters remain constant, x** becomes more prominent, the probability of “no synergy” in the strategic choices of academic and research institutions has become higher.
End of proof.
Stability Analysis of Game System Combinatorial Strategies
To further explore the strategic evolutionary equilibrium point of core enterprises, academic and research institutions, and the government in the green innovation ecosystem. According to Friedman’s [19] evolutionary game analysis method, the local stability analysis of the Jacobi matrix of this system obtains the evolutionary stability strategy of the three-dimensional dynamical system, and the partial derivatives of x, y, and z for the replicated dynamical system (10)-(12) of the three parties can be obtained as follows for the three-party subject’s Jacobi matrix J:
According to et al. Ritzberger [20] and Selten [21], in multiple swarm evolutionary games, a strict Nash equilibrium is a stable solution of the evolutionary game, and that strict Nash equilibrium is pure strategy. In Eq. (16), the nine local equilibrium points E1(0,0,0), E2(0,0,1), E3(0,1,0), E4(0,1,1), E5(1,0,0), E6(1,0,1), E7(1,1,0), E8(1,1,1), E9(x*,y*,z*) of the replicated dynamical system (16) can be obtained by letting
(23)
It follows that the eigenvalues of the Jacobi matrix at this point are
According to the determination method proposed by Friedman, the stable point of the replicated equilibrium equation is the stabilizing strategy (ESS) if the eigenvalues are all negative, and vice versa for the unstable end. The positivity or negativity of the determinant DetJ and trace TrJ of the matrix J can also determine the stability of the equilibrium point of a system of differential equations. The stabilization point of the replicated equilibrium equation is the stabilization strategy (ESS) when the matrix J has DetJ > 0 and TrJ < 0 [22]. Then, the stabilization point of each party’s innovation strategy will be E(1,1,1) . At this time, the influence factors of collaborative innovation strategies between the subjects should meet the following situation:
As shown in Equation (24), at this point, the benefit of the government participation strategy is greater than the sum of the regulatory cost of its government participation strategy and the incentive subsidy given by the government for collaborative R&D and innovation; the sum of government subsidies received by core firms, synergy gains, government penalties for core firms’ betrayal of the contract, and the amount of liquidated damages for core firms’ betrayal of the contract is greater than the sum of the synergy costs of the core firms and the green technology spillovers that the core firms receive from exiting the green innovation ecosystem; the sum of the government subsidies received by the academic and research institutions, the synergy benefits, the government’s penalty for the betrayal of the contract by the educational and research institutions, and the liquidated damages for the betrayal of the contract by the academic and research institutions is greater than the sum of the synergy costs of the core firms and the green technology spillovers that the core firms receive by exiting the green innovation ecosystem.
To facilitate the study of whether the other eight equilibrium points satisfy the evolutionary steady state, and for the sake of non-generality, the correlation coefficients
The above analysis shows that E2E4E7 may be the gradual stability point of the system. Government subsidies and penalties for green innovation for core enterprises and academic and research institutions, as well as the coefficient of synergistic benefits for core enterprises and academic and research institutions, are important factors influencing the choice of strategies for innovation agents.
Table 3.
Local stability analysis of each equilibrium point.
Green Innovation Ecosystem Evolution Simulation
Parameterization Settings
Based on the above analysis, to further study the overall evolution of strategy combinations in the replication dynamic system, as well as the influence of vital elements on the evolution process and the evolution results of the three-party game, the initial parameter values of the dynamic game model for the collaborative research and development of green innovation technology by government, industry, academia, and research in the green innovation ecosystem are set for simulation analysis. Comprehensive existing literature on the parameter value of the experience [23-26], combined with the introduction of various local governments on industry-university-research cooperation and green innovation subsidy policy documents and based on the reality of collaboration among industry-university-research, the parameters of the initial assignment of the value of the situation as shown in Table 4, through the above analysis and the initial value of the setting, the use of Matlab software on the government, the core enterprise and the academic and research institutions of the dynamic evolutionary process of the simulation and analysis, to find the equilibrium path of the evolution of the game.
Analysis of Numerical Simulation Results
Based on the above parameter settings, the evolution law of the green innovation ecosystem is explored when the parameters change.
Impact of Government Reward and Punishment Mechanisms on the Evolution of Green Innovation Ecosystems
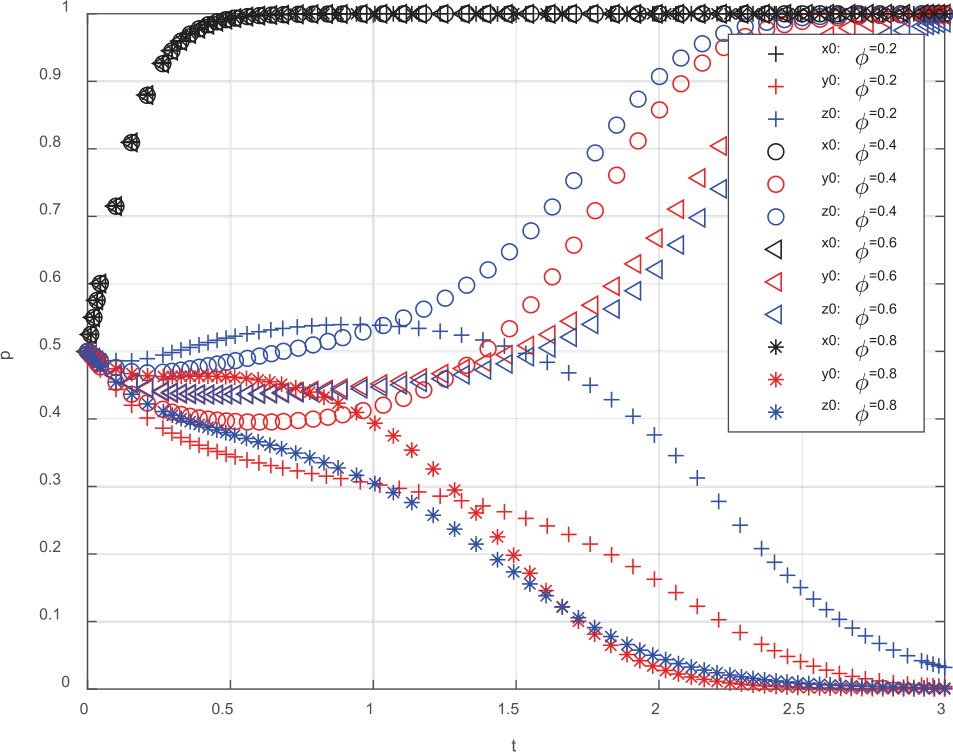
The green collaborative innovation subsidies S of core enterprises and academic and research institutions are allocated according to φ, 1 – φ. In this paper, to analyze the effect of government subsidy strength on the stability of the green innovation ecosystem, φ is set to (0.2,0.4,0.6,0.8), the rest of the parameters are kept unchanged, and the results are shown in Fig. 2. It can be seen from the figure that the government’s subsidy to industry-university-research and the behavioral evolution path of industry-university-research show an inverted “U” shape. That is, it has the optimal distribution ratio, and the optimal benefit distribution ratio is around 0.6. When the green innovation subsidy is low, it has little effect on the behavioral decisions of industry, academia, and research, which stems from the fact that the cost of choosing collaborative R&D is much higher than the sum of the penalty amount and the amount of breach of contract, and both industry, academia, and research decide to betray the alliance agreement.
Impact of Government Penalization Mechanisms on the Evolution of Green Innovation Ecosystems
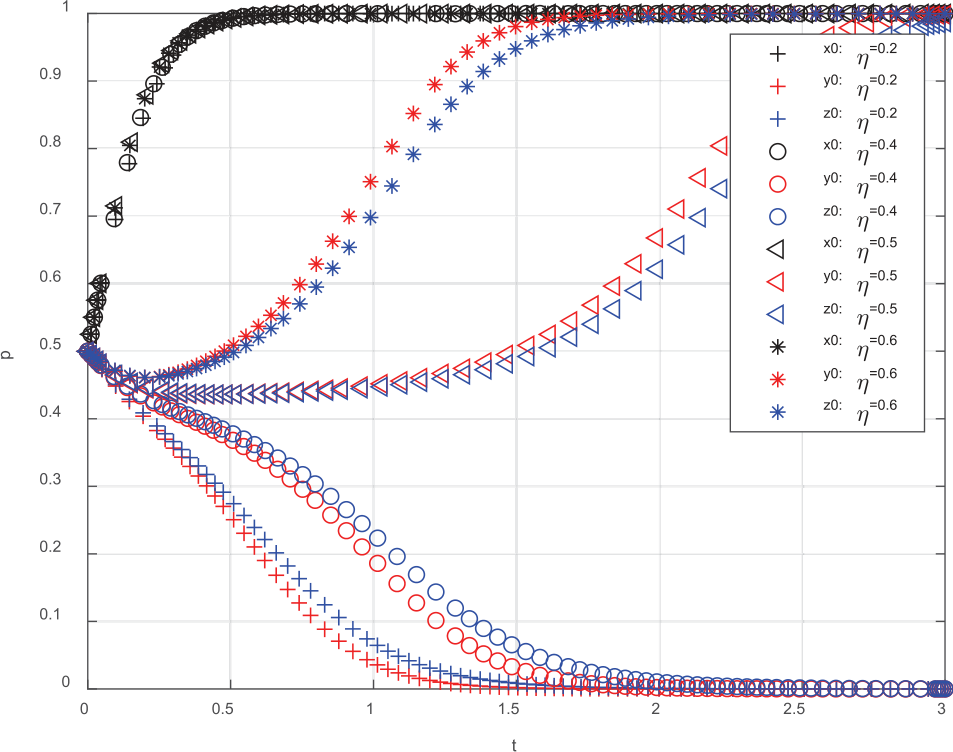
Fig. 3 represents the effect of the change in the government penalty η on the evolution of the game strategy of the green innovation ecosystem when the rest of the parameters are kept constant by setting the government penalty as (0.2,0.4,0.5,0.6). It shows that there is a threshold value between 0.4~0.5 for the effect of government punishment on the system evolution results, and the greater the policy punishment, the more it enhances the willingness of the core firms and the academic and research institutions to collaborate. In addition, when analyzing the influence of government reward and punishment mechanisms on the behavioral decision-making of government, industry, academia, and research at the same time, it is found that the influence of government reward and punishment mechanisms on the behavioral change of green innovation subjects at the same time is more pronounced.
Impact of the Benefit Sharing Ratio and Synergy Benefit Coefficient on Green Innovation Ecosystems
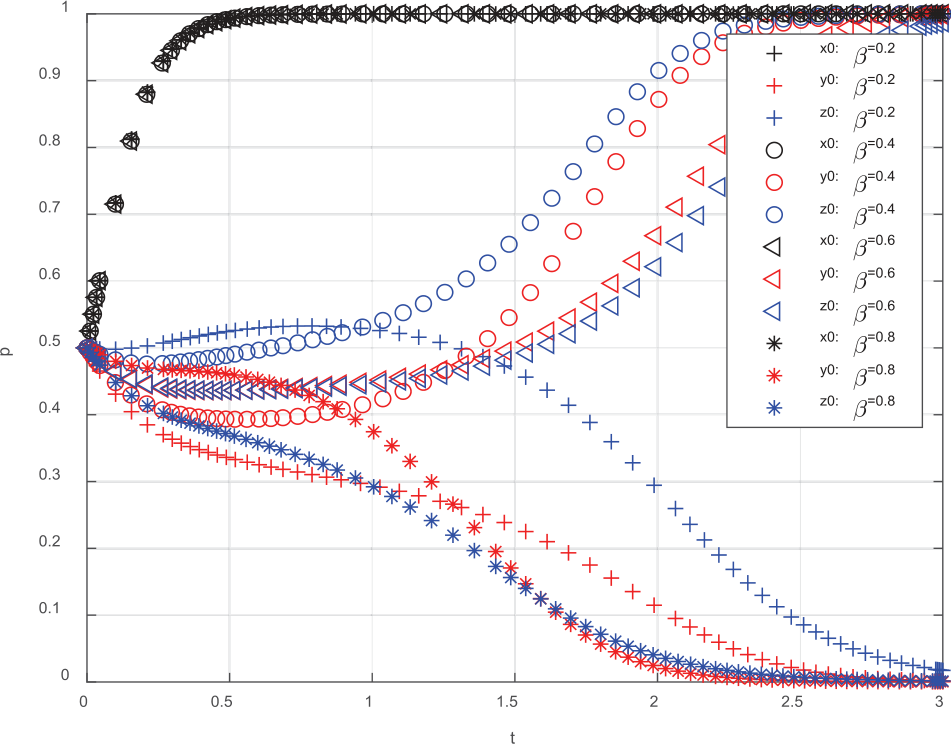
The green innovation benefit sharing ratio β is set to (0.2,0.4,0.6,0.8) in turn, and the rest of the parameters remain unchanged. The results of the numerical simulation are shown in Fig. 4. From the figure, it can be seen that when β = 0.2, β = 0.8, and the equilibrium point will tend to E(1,0,0); When β = 0.4, β = 0.6, the equilibrium point will connect to E(1,1,1). It shows that the R&D benefit sharing ratio of industry-university-research collaborative green innovation and the behavioral evolution path of industry-university-research present an inverted “U” shape, i.e., it has the optimal allocation ratio, and the optimal benefit sharing ratio is near 0.5, in which the core enterprises are much more concerned about and sensitive to the benefits than the academics and researchers.
Conclusions and Implications
Main Conclusions
This paper applies the theory of the evolutionary game with incomplete information, establishes the evolutionary game model of the green innovation ecosystem with government-core enterprises-academic and research institutions as the main body, analyzes in depth the influence of the behavioral decisions of the green innovation main body on the stability of the green innovation ecosystem, and analyzes the effect of some key factors on the strength of the green innovation ecosystem through simulation.
The results show that:
(1) In the market mechanism, the distribution ratio of benefits is a key factor affecting the green innovation ecosystem. At the critical value of the distribution ratio of benefits, the behavioral strategy of industry-university-research is very easy to be interfered with by random factors. At this time, the collaborative innovation benefits and collaborative research and development costs of industry-university-research have a greater impact on the behavioral strategy of industry-university-research and the benefits of industry-university-research have the optimal distribution ratio.
(2) Under government participation regulation, government rewards and penalties are positively correlated with the stability of green innovation ecosystems, and the simultaneous action of rewards and penalties is more effective than a single mechanism (subsidies and penalties) in stabilizing green innovation ecosystems, which not only saves the government’s financial expenditures but also achieves the expected results.
(3) Government subsidies are an institutional complement to promote cooperation. In a good cooperative atmosphere, the effect of the role of government subsidies is not obvious, but when the atmosphere of green collaborative innovation is poor, government subsidies are crucial, and the flexible use of subsidy policy tools and the role of mediation can promote inter-subjective cooperation on green innovation.
Management Implications
Based on the tripartite subject evolution game analysis, Matlab simulation, and research conclusions, this paper draws the following insights to maintain the stability of the green innovation ecosystem:
(1) Develop a reasonable revenue-sharing program. In practice, the top-level system designers should consider the impact of the income distribution coefficient on the evolution of the game strategies of the two sides, formulate a reasonable income distribution mechanism, ensure the fairness of the income distribution coefficient to make the income distribution of the industry-university-research institutes reach the optimal value of the two sides, and give full play to the coordinating roles of the central bodies.
(2) At the same time, the government must play a guiding and corrective role in the green innovation ecosystem. The government should develop an effective incentive and penalty mechanism for green collaborative innovation and provide a favorable green innovation and green investment environment for core enterprises, academic, and research institutions.
(3) In addition, according to the fact that enterprises aim at economic interests and academic and research institutions mainly aim at social interests, the government should strengthen the policy orientation and publicity for educational and research institutions, increase the willingness of educational and research institutions to participate, and give full play to the role of academic and research institutions in promoting collaborative innovation.

