

Introduction
During the 14th Five-Year Plan period in China, the fragile ecological environment has become a bottleneck for economic and social development, and environmental protection has entered a new phase of collaborative management to reduce pollution and carbon emissions. The annual economic loss caused by environmental pollution accounts for 2-5% of the gross domestic product (GDP) [1], mainly owing to the blind pursuit of economic growth and a crude development model [2]. In 2012, the green economy (GE) was defined as a new market-oriented economy, based on the traditional industrial economy and developed with the aim of coordination between the environment and the economy [3]. Scientific and technological innovation (STI) must be relied on to deal with the harmonious development of ecological environment and social economy. STI can maximize the use of resources, improve production efficiency, and accelerate the transformation from a crude economy to a GE [4], the development of which adds momentum to STI [5].
Anhui Province, as a key part of the Yangtze River Delta (YRD) region, has invested ample human and material resources into economic development and innovation, and its rate of urbanization has been increasing. Urbanization has brought economic benefits to the province; however, it has also caused environmental pollution and resource shortages [6]. In a 2019 report, the government of Anhui clearly stated that it would “promote the building of the beautiful Yangtze River (Anhui) and Huai River green economic belts and integrate eco-environmental conservation and economic construction”. With increased government input into environmental conservation, the ecological environment has improved, but not sufficiently [7, 8]. STI can help reduce carbon emissions, and a low-carbon economy is conducive to both the environmental protection and economic development, thus accelerating GE development [9, 10]. The relationship between STI and GE has become a critical issue in high-quality development [11]. Therefore, it is important to scientifically explore the coupling and coordination between STI and GE in Anhui Province.
An intensive study of the relationship between STI and GE has yielded some useful insights. On the one hand, the implications of STI on GE have been studied. Ding et al. used partial least squares regression to measure the impacts of the components of technological innovation capabilities on the degree of GE development in China and found a significant positive impact [12]. Liu and Dong believe that the intensive effect of STI can significantly improve the efficiency of green economy [13]. Zhou analyzed the application of digital finance and STI in economic development, GE, and sustainable development, and showed that STI can achieve green mobility and promote the development of a GE [14]. Additionally, Han et al. demonstrated that the key to growing a GE is increasing the green total factor productivity driven by STI and institutional innovation [15]. However, the impact of STIs is bidirectional, and many regions tend to neglect to protect the ecological environment during STI development. Although the level of STI in China has risen steadily, it has been accompanied by increases in wastewater and solid waste emissions, which hinder the development of a GE [16]. For example, wastewater from industrial wastewater treatment plants disrupts the mineral balance of the soil, causes soil contamination, and affects the quality of surface water and the production of drinking water [17]. Cars are a convenient means of travel, but their emissions pollute roadside plants, reduce air quality, and cause environmental pollution [18]. Wang and Luo also argued that STIs exacerbate environmental pollution when direct foreign investment is low [19]. On the other hand, relatively few studies on the direct impact of a GE on STI have been conducted. Yang et al. suggested that the impact of GE development on STI is positive in the short term, but the effect gradually declines to zero [20]. Wang et al. used a coupled study design and found that marine STI provides a driving force for marine eco-economic growth, which guarantees marine STI [21]. The most critical factor in GE development is improving the environment; therefore, many scholars have focused on the effect of environmental regulations on STIs. For instance, Du and Peng explored the impacts of environmental regulations on STI performance using panel data from A-share-listed Chinese chemical companies from 2010-2014; their results indicated that intensive environmental regulations can positively facilitate relevant technological diversity [22]. In addition, Li et al. tested the impacts of environmental regulations on STI in resource-based industries using data from 2003-2019, demonstrating that environmental regulations can have a significant positive effect on product innovation, with a lag of one to two periods, but not in the current period [23].
On the whole, domestic and foreign scholars have achieved fruitful results in one-way research on STI and GE, but there are also some shortcomings. First of all, most studies on the relationship between these two systems focus on the direct impact of STI on GE and the indirect impact of GE on STI, and how the two systems interact is rarely mentioned. Secondly, the research scope mainly focuses on regions such as economic belt and urban agglomeration, and rarely studies the provincial scale. In addition, there is less research on the coupling coordination mechanism, spatial correlation and spatio-temporal evolution of STI and GE. Therefore, taking Anhui province as an example, we constructed a comprehensive index system of STI and GE based on the panel data of 16 prefecture-level cities from 2012-2021. We established an entropy weights method (EWM) and both coupled coordination and spatial autocorrelation models to explore the level of coupling coordination and spatiotemporal evolution of these systems. The results will provide a theoretical basis and policy reference for innovation-driven developmental strategies and high-quality economic development in Anhui Province.
Materials and Methods
Study Area
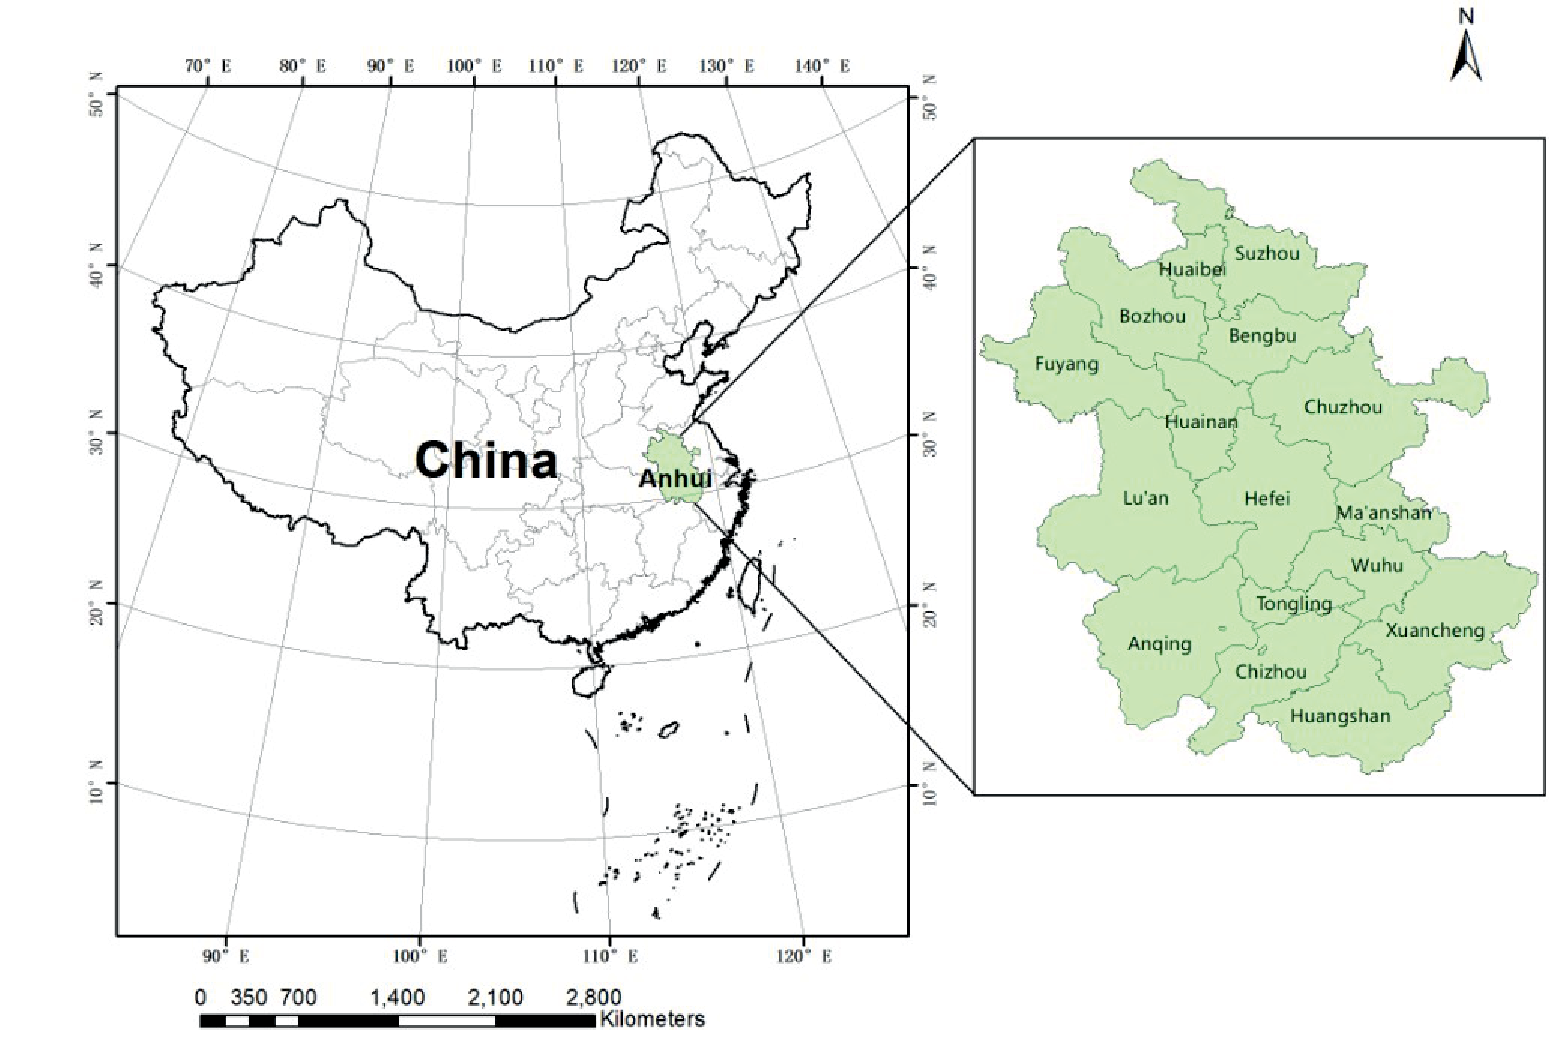
Anhui Province is a provincial administrative unit located in the YRD region in the eastern People’s Republic of China (~29°4′-34°6′N, ~114°5′-119°6′E) (Fig. 1.), it has a total area of 140,100 km2. It has jurisdiction over 16 prefecture-level cities, 9 county-level cities, 50 counties and 45 municipal districts. In terms of urban development and ecological environment, this province has responded positively to national policies aimed at promoting economic development and improving the ecological environment. Nevertheless, rapid economic growth has created challenges that now face the ecological environment and economic–environmental coordination is essential for the continued development of Anhui Province.
Coupling Mechanism of STI and GE
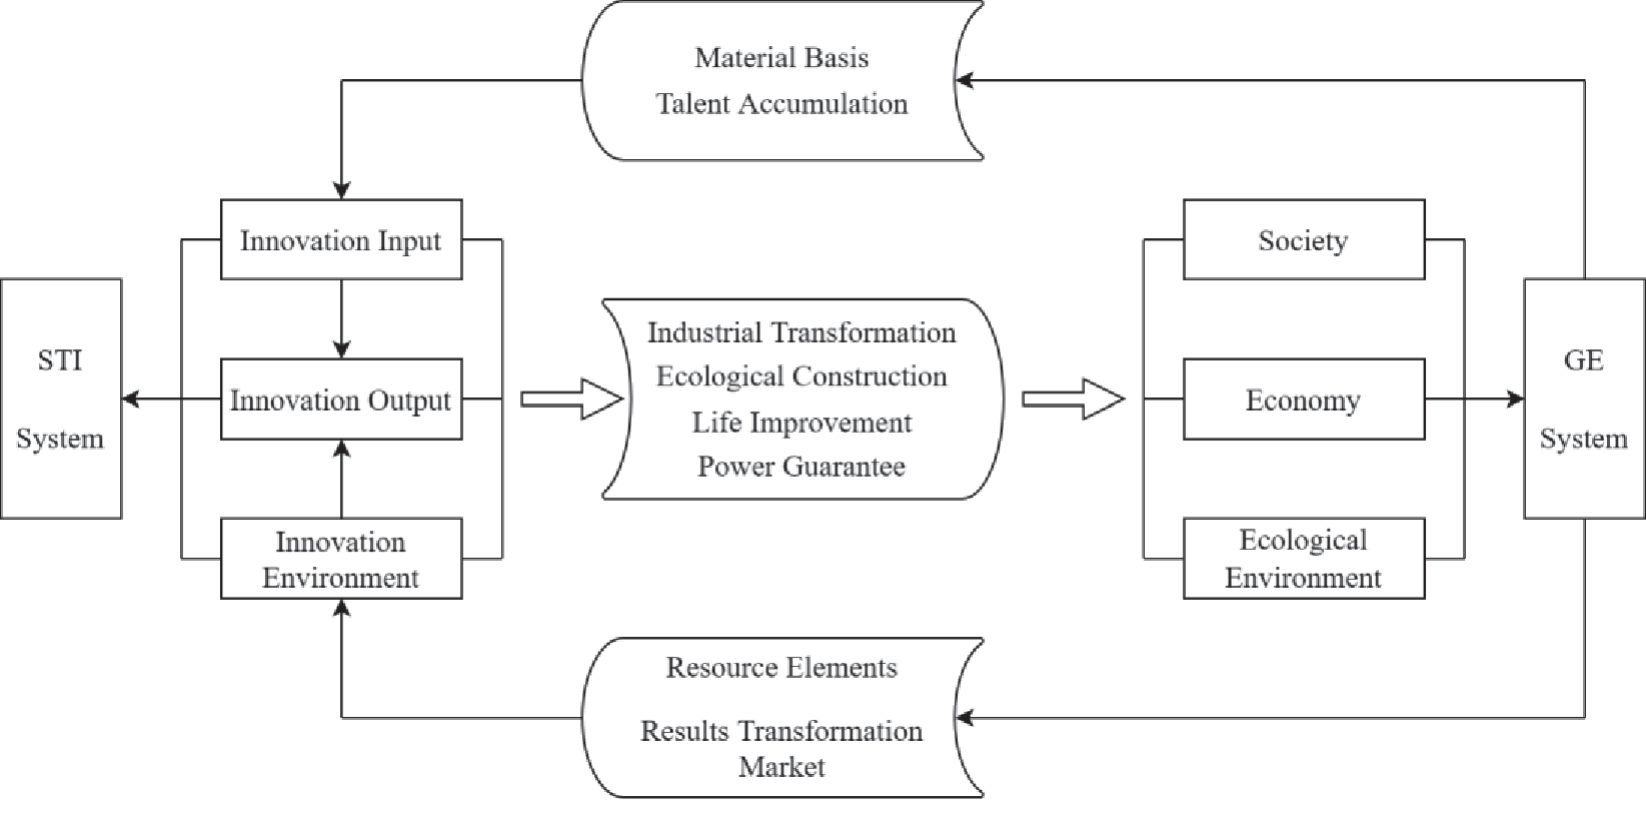
STI and GE are not independent systems. They complement each other and have inherent advantages in coupling.STI is an important driving force for the development of GE, which also lays a solid foundation for the progress of STI. The fundamental purpose of developing a GE is to harmonize the economy, society, and environment, which involves production distribution, environmental protection, education, science and technology, and public health policies and practices. STI bridges the economy, society, and environment [24] and can play a critical role in GE development across these three dimensions [25]. At the economic level, STI products, such as patents and reports, can provide the theoretical basis for developing low-energy consumption and high-efficiency products, leading to more efficient production methods, accelerating the transformation of industrial structures, and facilitating high-quality economic development. The benefits of economic growth will entice higher resource investment into STI to further accelerate its development. At the social level, STI can provide jobs, improve people’s quality of life, and enhance their happiness. When consumers enjoy the convenience of technology, they are more likely to pay for it, which is a strong driver for STI development. Simultaneously, environmental improvements can reduce the need for government and enterprise investments in pollution control, thus accelerating economic development and promoting the progress of STI. However, STI has had many negative impacts throughout history, including problems of environmental pollution caused by the over-development of science and technology. Thus, studying the interaction between STI and GE is important. The coupling mechanisms between the two are shown in Fig. 2.
Construction of the STI and GE Index System
The coupled coordination between STI and GE is relatively complex and requires comprehensive multi-level and multi-dimensional analyses. Referring to the existing literature [26-29], based on the consideration of representativeness, ease of access and stability, we evaluate the level of STI in terms of three dimensions: environment, input and output. Innovation environment can provide a good innovation atmosphere, involving the services provided by the government and the social environment naturally formed by the society, including the number of general higher education institutions and the proportion of education expenditure to local fiscal expenditure. Innovation requires a lot of investment of human, financial, material and information resources, and only when these innovation resources are invested in innovation activities can the smooth development of various innovation activities be ensured, including the indicators such as proportion of research and development (R&D) expenditure, the full-time equivalent of R&D personnel, and the proportion of enterprises with R&D institutions. In addition, innovation output is the result of innovation development that leads to direct outputs such as economic growth and high technology products, where indicators such as turnover on technology market, number of patent applications, number of patents granted and number of published papers are used to evaluate innovation capacity output in several countries and regions, and are methodologically mature. The level of GE covers economic, social, and environmental aspects. Drawing on previous research [25, 30-32], we established a GE index system with three dimensions - economic, ecological, and social - to achieve the organic unity of benefits along these dimensions. First, GE advocates low energy consumption and high efficiency to achieve sustainable development [33]. To promote high-quality development and achieve the goal of peak carbon neutrality, it is essential to change resource utilization and continuously improve its efficiency under the dual constraints of resources and the environment; therefore, including resource and energy consumption in our analysis was consistent with the concepts of GE development. The total investment in fixed social assets, energy consumption per unit of GDP, GDP per capita, and the proportion of the added value of the tertiary industry to GDP were selected to evaluate the economic benefits of GE in Anhui Province. Second, compared with the traditional economy, there is more attention paid to reducing environmental pollution while following the aim of economic development in a GE, which plants the seeds of green values in people’s hearts, thereby encouraging the government and enterprises to develop green STI and accelerate the transformation of the value chain. We chose the proportion of days with an air quality better than Grade 2, the comprehensive utilization rate of industrial solid waste, and the rates of greening coverage in built-up areas and urban sewage treatment to measure the environmental benefits of a GE. Third, social harmony is the driving force of social development. A stable social environment provides high-quality talent and sufficient jobs to a region, thus accelerating urbanization and promoting high-quality regional development. Indicators, such as the rates of urban unemployment registration and urbanization, and the number of years of education per capita were used to evaluate the social construction benefits of a GE.
Evaluation Model
EWM
In a comprehensive evaluation method, the weights of indicators are usually measured using subjective, objective, and combined weighting methods; these results are mainly associated with the accuracy and objectivity of the evaluation outcomes [34]. The subjective and the combined methods determine the weight value of each index according to the subjective judgment of the evaluator, which ultimately affects the objectivity of the assignment results. Here, we adopted an objective EWM to determine index weights, and the weighting process was based on data to avoid the interference of human subjective factors; thus, the weights obtained were more objective and realistic [35]. As the index system could not achieve uniformity in units or magnitudes, it was necessary to normalize the selected indexes and concurrently carry out the translation process to remove the effect of zero values to make the indexes comparable and improve the scientific value of the results. Positive indicators were calculated as follows:
Table 1.
Metrics of the STI and GE indicator system.
while negative indicators were calculated according to Eq. (2):
where m is the original indicator, M is the standardized value, min is the minimum value, max is the maximum value, Mij is the normalized value of indicator j in system i after normalization, and mij is the value of indicator j in system i. The weight (P) of indicator j in system i was calculated as:
while the entropy value (e) of indicator j was calculated as:
The weights (w) of index j were calculated using the following formula (Table 1.):
Finally, the integrated development index (L) of the system i was calculated according to Eq. (6):
Coupling Coordination Model
Coupling is a physical phenomenon that refers to the interactions between or among two or more systems under their own and external actions [36]. The degree of coupling can indicate the levels of dependence and constraint between systems [37]. Here, a coupling coordination model was applied to assess the degree of interaction between STI and GE, which was calculated as follows [38]:
where M1 is the STI level of development, M2 is the level of GE development, and C is the degree of coupling between STI and GE. The values of the coupling degree are C∈[0,1]. When C→0 the degree of coupling is lower, indicating that the STI and GE systems or their internal elements are under mutual constraint; however, when C→1, the level of coupling is higher, indicating that the STI and GE systems are in a highly coupled state of benign resonance, complementing and promoting each other, and moving in stable and regular directions.
Coupling degree is usually used only to reflect the degree of interaction between systems, while coupling coordination degree not only considers the degree of interaction between systems, but also their respective development levels, reflecting the degree of harmony and consistency of development between systems [39]. The degree of coupling coordination was calculated as follows [40]:
where D denotes the level of coupling coordination of the STI and GE systems, with a range of D∈[0,1]. When D→1, the level of coupled and coordinated development is high, and when D→ 0, it is low. In Eq. (9), T denotes the combined degree of STI and GE development, and α and β are the coefficients to be determined for the two systems, respectively, considering the direction and degree of influence the two systems have on each other. STI and GE were considered to have the same status in the evaluation, such that α = β = 0.5 [41]. Based on previous studies [42, 43], the degrees of coupling and coupling coordination were classified according to the actual situation in Anhui Province, as shown in Table 2.
Spatial Autocorrelation Model
Spatial autocorrelation can effectively reveal a significant correlation between the attributes of an element at one location and those of its neighboring locations. Global spatial autocorrelation is used to describe the spatial correlation of an element’s characteristic values in an observation area, which can be measured by the global Moran’s index (I); local spatial autocorrelation can reveal the correlation between elements and the clustering characteristics of an element’s attribute values over a local range, which can be expressed by the Moran’s scatter and local indicators of spatial association (LISA) clustering diagrams.
Table 2.
Classification of coupling and coordination types.
| Range | Coupling Type | Range | Coordination Level |
|---|---|---|---|
| 0 ≤ C < 0.3 | Low | 0 ≤ D < 0.3 | Low |
| 0.3 ≤ C < 0.5 | Antagonistic | 0.3 ≤ D < 0.5 | Intermediate |
| 0.5 ≤ C < 0.8 | Running-in | 0.5 ≤ D< 0.8 | Good |
| 0.8 ≤ C < 1 | High | 0.8 ≤ D < 1 | High |
Global spatial autocorrelation is a spatial description of an attribute over an entire study area and may be calculated as follows [44]:
where n is the number of cities studied, Ui and Uj denote the level of coupling coordination between city i and city j, respectively, Ū is the mean degree of coupling coordination, and Wij is the spatial weight matrix. When cities i and j are spatially contiguous, Wij = 1; otherwise, Wij = 0. The value of Moran’s I ranges from [–1,1], I>0 means that a positive correlation exists between the spatial attributes (i.e., a high level of coupling coordination is adjacent to a high level of coordination, or a low level is next to low level), with a clustered distribution. Conversely, if I<0, a negative correlation exists between the spatial attributes (i.e., a high level of coupling coordination is next to a low level), with a discrete distribution. Finally, if I ≈ 0 or I = 0, then the space follows a random distribution [45]. The value of standardized Z can be used to examine the degree of significance of the global Moran’s I. In Eq. (11), VAR(I) represents the variance, and E (I) denotes the expected value of the global Moran’s I.
Global spatial autocorrelation has certain limitations and cannot reveal local spatial distributions. In such cases, local spatial autocorrelation can be used to examine the location and extent of spatial agglomeration or dispersion within each local region and among adjacent regions. Local spatial autocorrelation can be calculated as follows [46]:
where S2 represents the variance. The degree of local spatial autocorrelation can be illustrated using Moran’s scatter plot. The first quadrant plots a high-high (H-H) distribution that shows a positive correlation with a spatial pattern in which areas with high values are next to each other. The second quadrant plots a low-high (L-H) distribution, showing a negative correlation with a spatial pattern in which areas with low values are next to areas with high values. The third quadrant is a low-low (L-L) distribution, which shows a positive correlation with a spatial pattern in which areas with low values are next to each other. The fourth quadrant plots a high-low (H-L) distribution that shows a negative correlation, with a spatial pattern in which areas with high values are next to areas with low values.
Data Sources and Processing
Our research objects study included 16 prefecture-level cities in Anhui Province from 2012-2021, and a system of evaluation indicators for the coupled and coordinated development of STI and GE in Anhui Province was built. The data for each indicator were obtained primarily from the China Statistical Yearbook, Anhui Statistical Yearbook, and Anhui Science and Technology Statistical Bulletin, and missing data from individual cities were determined by interpolation. In 2011, the prefecture-level Chaohu City was abolished, Lujiang County was divided into Hefei City, the establishment of the city command headquarters’nest area was abolished, and Chaohu City was changed to the county level, administered by Hefei City, while He County and Hanshan County were subordinate to Ma’anshan City and Wuwei County was subordinate to Wuhu City. The number of prefecture-level cities in Anhui Province has been changed from 17 to 16. In order to unify the research area, 16 prefecture-level cities in Anhui Province after the adjustment of administrative divisions are taken as the research object, so the research period is set to 2012-2021. In addition, indicators for GDP, GDP per capita, total investment in fixed assets, and other factors related to prices in the index system were deflated based on the 2012 constant price.
Results
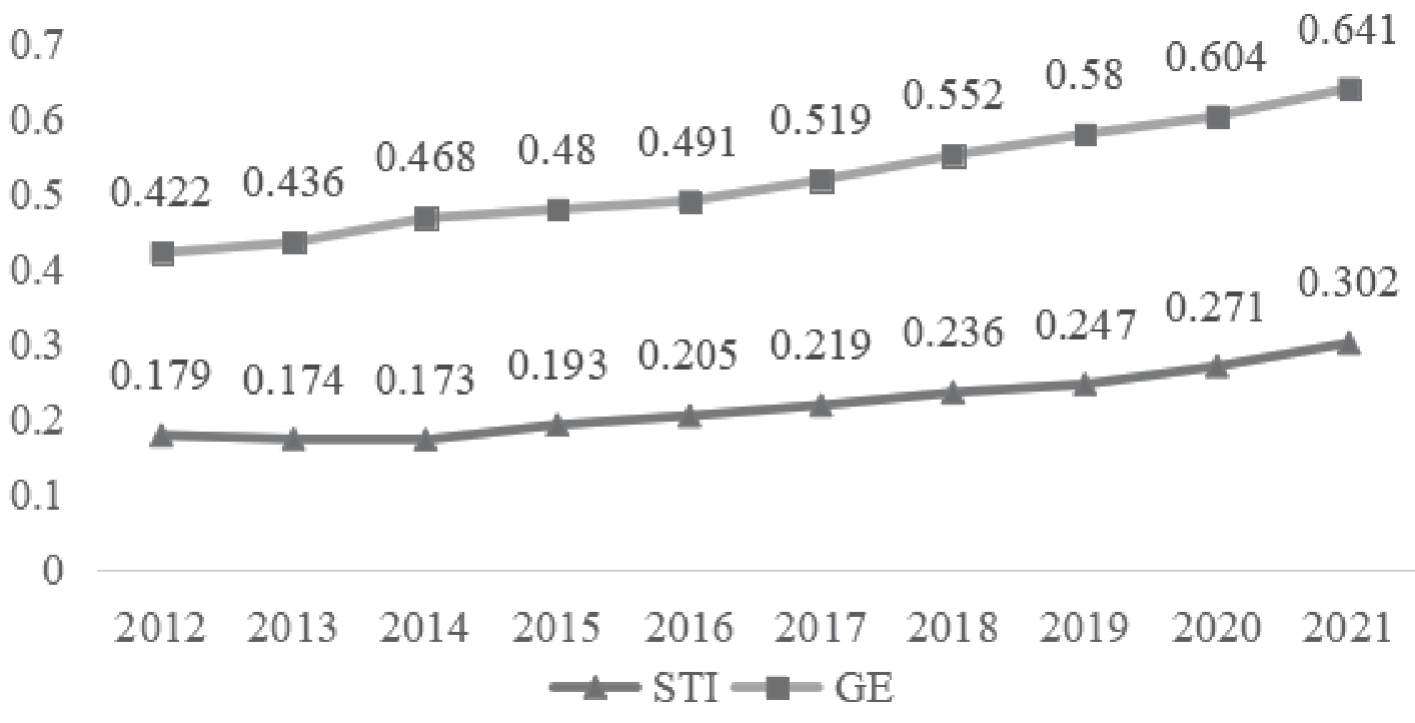
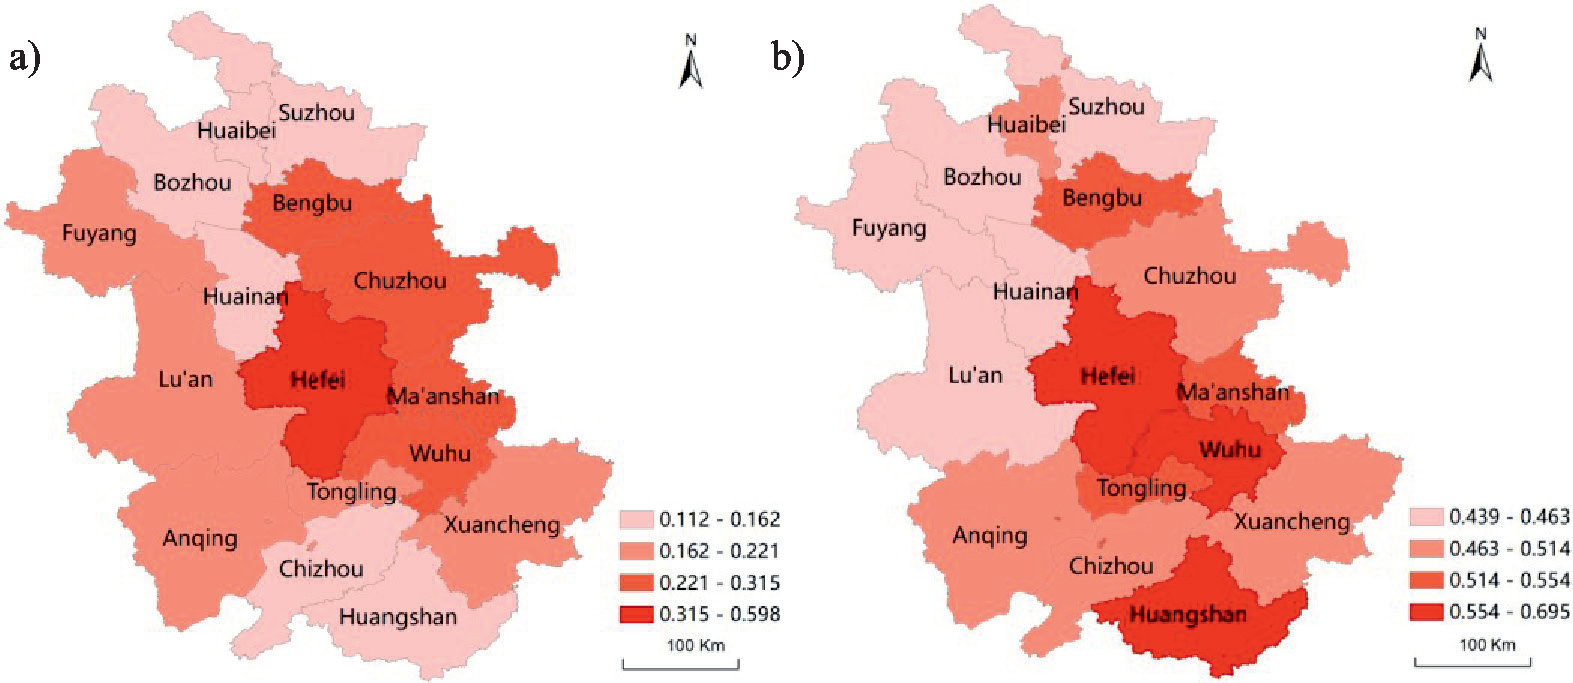
Based on the panel data of 16 prefecture-level cities in Anhui Province from 2012-2021, the levels of integrated STI and GE development were measured and line graphs were drawn using Stata v.16 (StataCorp LLC, USA). The results are shown in Table 3. (for odd years) and Fig. 3. Using the natural break method of ArcGIS v.10.8 (ESRI, USA), the integrated levels of development calculated for the two systems from 2012-2021 were divided into four levels (Fig. 4.).
Table 3.
Comprehensive development level of STI and GE in Anhui Province.
Level of STI Development
Overall, the level of STI development in Anhui Province increased by 69%, from 0.179 in 2012 to 0.302 in 2021, showing a fluctuating upward trend (Fig. 3.). The main reason is that Anhui Province has accelerated the implementation of innovation-driven development strategy, and the level of manpower and material resources input in STI has been continuously improved. During the study period, the full-time equivalent of R&D personnel grew substantially, from 103,047 in 2012 to 235,292 in 2021, and the expenditure on R&D in the same period grew significantly from 28.18 billion yuan to 100.61 billion yuan. Such growth in R&D expenditure provides strong support for STI output.
In terms of STI, the overall level of development in each city was low, with significant regional differences. At the first level, only Hefei has a development index of 0.598. The reason lies that the government of Hefei has actively attracted research talent and increased financial support in the past 10 years, which has guided and stimulated all types of innovation to maximally enhance their STI capabilities. Bengbu, Chuzhou, Ma’anshan, and Wuhu were at the second level, with indexes of 0.286, 0.247, 0.268, and 0.315, respectively. These four cities are near the well-developed Jiangsu Province and have a natural geographical advantage to learning from advanced experience. At the third level, Fuyang, Lu’an, Anqing, Tongling, and Xuancheng have indexes of 0.188, 0.17, 0.209, 0.221, and 0.174, respectively. Although Xuancheng borders both Zhejiang and Jiangsu and has a superior geographical location, it is disadvantaged by late urbanization and underdevelopment due to the late establishment of the city, few research institutes, lacking talent pool, and weak basic research. Moreover, the STI development index alone is not satisfactory because traditional industries are inefficient and have not advanced. The remaining cities are mostly located on the periphery of Anhui Province, with less convenient transportation. In particular, Huainan and Huaibei have neglected the development of other industries due to a focus on mining and therefore have difficulty attracting innovative talent; thus, improvements in quality and the level of innovation are poor, placing them at the fourth and lowest level of development in Anhui.
Level of GE Development
The overall level of GE development has steadily increased by 52%, from 0.422 in 2012 to 0.641 in 2021 (Fig. 3). This shows that the Anhui provincial government attaches great importance to the balance between ecological environmental protection and economic development in the past 10 years, and has achieved certain results in energy conservation and emission reduction, ecological governance, and industrial structure upgrading and transformation. In terms of GE, the level of development in each city exhibits a clear spatial distribution, with that in the southeast being significantly higher than in the northwest (Fig. 3). Hefei, Wuhu, and Huangshan are at the first level, with indexes of 0.695, 0.594, and 0.599, respectively. Huangshan, a tourist destination, has a low STI index but rich ecological resources and a strong environmental carrying capacity; therefore, green wealth development has notable advantages there. Tongling, Ma’anshan, and Bengbu are at the second level of GE development and also have a high level of STI. The cities at the third level are Huaibei, Chuzhou, Anqing, Chizhou, and Xuancheng, which have poorer per capita GDP indicators, but better green coverage of built-up areas, urban sewage treatment rate, and years of education per capita. The remaining cities have poor economic, social, and environmental indicators and are therefore at the fourth level of green development. The levels of both STI and GE development in Anhui Province have risen notably, indicating that the provincial government has paid attention to STI and GE. However, the level of STI development has been lower than that of GE, and the province should continue investing in STI resources and the relevant mechanisms to drive innovation.
Degree of Coupling and Coupling Coordination
Fig. 3 shows that the levels of STI and GE development have almost the same trend, and both show a clear positive correlation over time. Consequently, it is necessary to consider the degree of coupled coordination between the two systems. Fig. 5. shows that the coordination curve of STI and GE is always below the coupling curve, which means that the relationship between them needs to be further optimized. The degree of coupling between the two systems increased from 0.883 in 2012 to 0.945 in 2021. The degree of coupling has been in the range of 0.8-1.0, both of them are highly coupled, indicating that the two systems develop in a standardized and orderly direction and promote each other. The obvious decline in the coupling degree between 2013 and 2014 is due to the reduced proportion of education expenditure, which leads to the weakened impact of STI on the GE. The change in the coupling coordination degree is relatively stable and has been steadily increasing. Furthermore, the development of the coupling coordination level from intermediate to good coordination (intermediate coordination in 2012- 2014 and good coordination in 2015-2021) indicates that the progress of STI promotes the development of GE to a certain extent, the development of GE also has a positive impact on STI, and the overall mutual influence and adhesion between the two systems are gradually increasing.
To further analyze the spatial evolution of the coupled and coordinated development in 16 prefecture-level cities of Anhui Province, the spatial distributions of the two systems in 2012, 2015, 2018, and 2021 were analyzed. It can be seen from Fig. 6 that the overall coupled and coordinated development of the two systems is positive, but with clear spatial variability.
Low coordination zone: A low-coordination zone can be seen in Suzhou and Huangshan in 2012 and Bozhou in 2015, while no cities were in this zone in 2018 or 2021. By 2018, all cities were at an intermediate level of coordination or greater, indicating that the innovation-driven developmental strategy implemented in Anhui Province has begun to bear fruit.
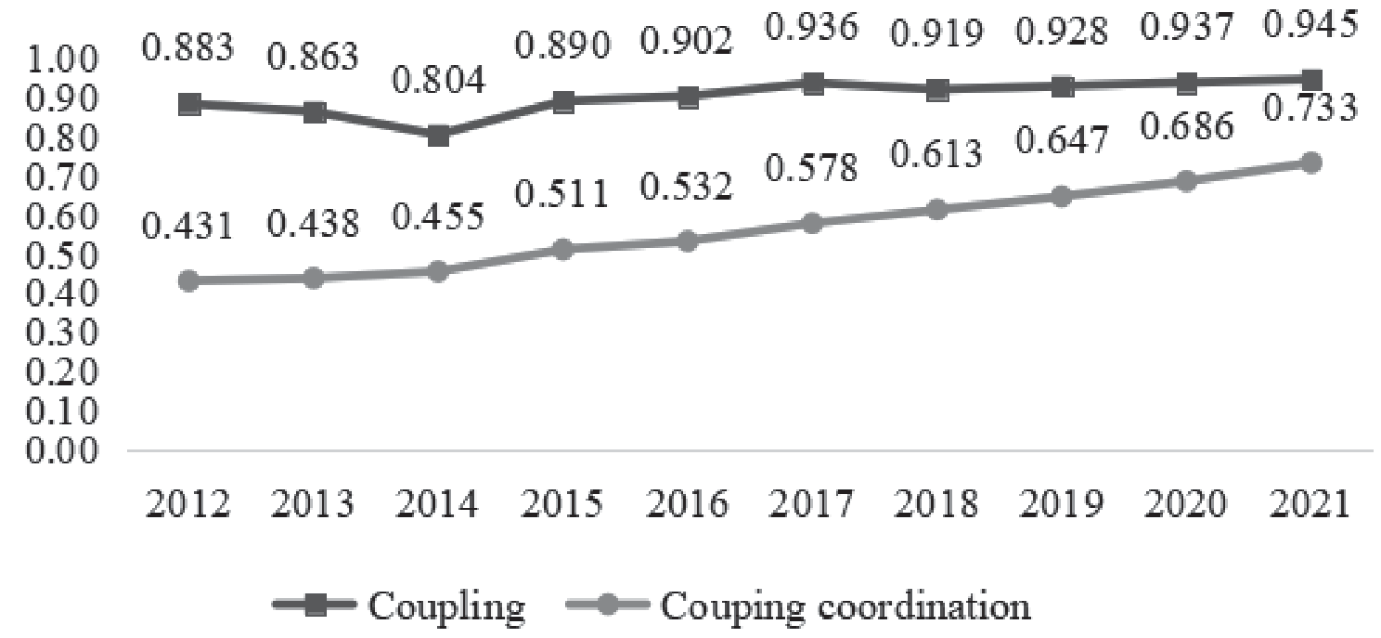
Fig. 6.
Spatial evolution of coupling coordination between STI and GE in Anhui Province: a) 2012, b) 2015, c) 2018, d) 2021.
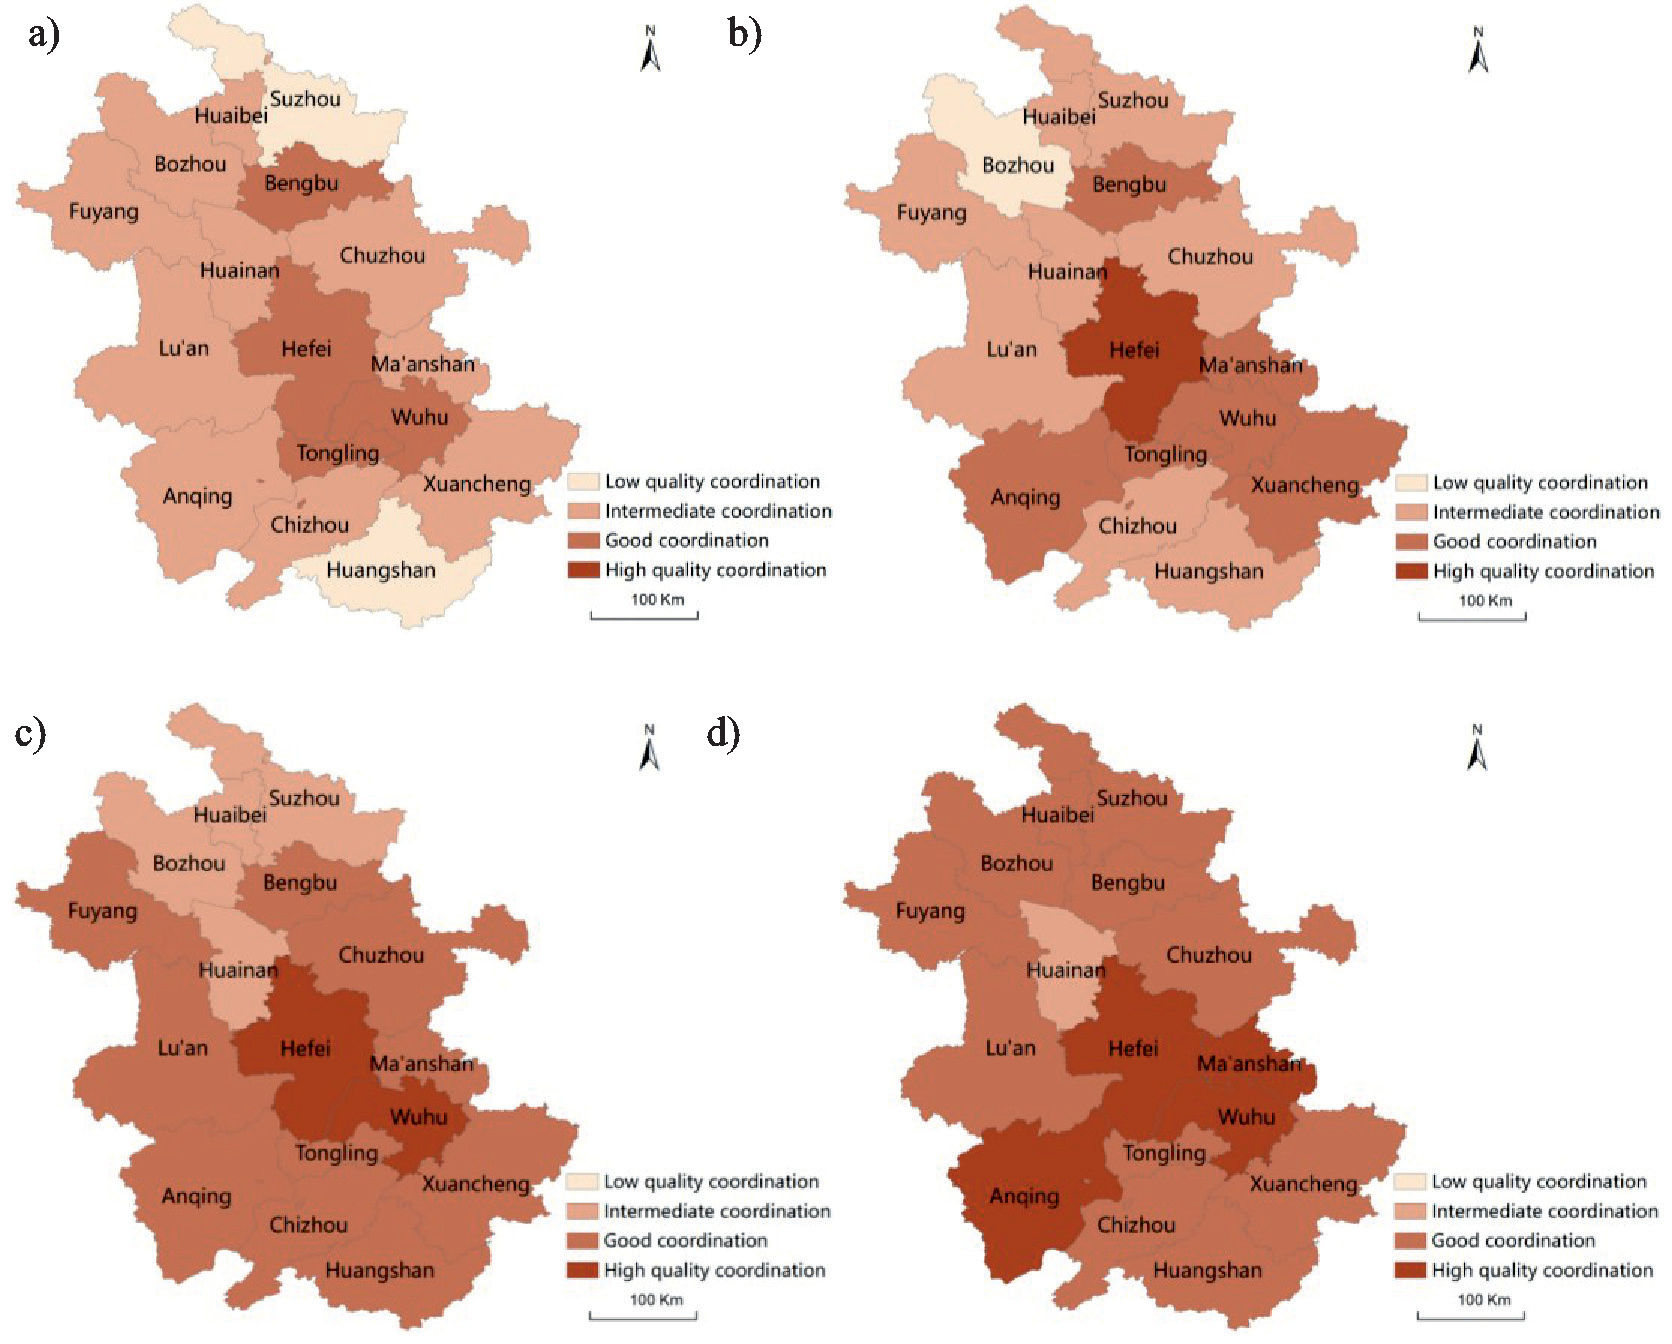
Intermediate coordination zone: An intermediate-coordination zone was found in Huaibei, Bozhou, Fuyang, Huainan, Lu’an, Anqing, Chizhou, Xuancheng, Ma’anshan, and Chuzhou in 2012, in Huaibei, Suzhou, Fuyang, Lu’an, Huainan, Chuzhou, Chizhou, and Huangshan in 2015, in Huaibei, Suzhou, Bozhou, and Huainan in 2018, and in Huainan in 2021, as all other cities had moved into the good and high coordination zones. As a coal city, Huainan suffers from the crowding out of human capital, STI, and foreign investment due to its over-reliance on resource industries. Huainan should accelerate industrial transformation, take advantage of its resources, carry out cross-regional cooperative activities, improve its soft and hard strengths, and promote the coordinated development of STI and GE.
Good coordination zone: In 2012, the cities of Hefei, Wuhu, Tongling, and Bengbu were in the good-coordination zone. The zone further expanded to include Ma’anshan, Anqing, Xuancheng, Wuhu, Tongling, and Bengbu in 2015, and Fuyang, Lu’an, Anqing, Tongling, Chizhou, Huangshan, Xuancheng, Ma’anshan, Chuzhou, and Bengbu in 2018. In 2021, most cities in Anhui except for Huainan were in the good-coordination zone and Hefei, Wuhu, Ma’anshan, and Anqing were in the high-coordination zone. Over time, the number of cities in the region has increased; while the momentum for development is good, there is still room for improvement. The cities should invest more in R&D, learn from the advanced experience and technology of Hefei and other regions, link with industrial gradient transfers and upgrades, strengthen STI and business model innovation, and promote the coupled and coordinated development of STI and GE.
High coordination zone: No cities were in the high-coordination zone in 2012. By 2015, only Hefei was in this zone, followed by Wuhu in 2018 and Ma’anshan and Anqing in 2021. Overall, the area is gradually expanding, with Hefei as the center and spreading in all directions. In Hefei, the rapid development of STIs and the high efficiency of STI transformation have promoted GE development, and sufficient funding has enabled the government to invest more resources in STIs.
Spatial Autocorrelation of STI and GE Coupling Coordination
Global Spatial Autocorrelation
To reflect the spatial clustering and evolution of coupling coordination between STI and GE, four years -2012, 2015, 2018, and 2021-were selected to calculate the global Moran’s I, as shown in Table 4.. Except for in 2012, I > 0, p < 0.05, and |Z| < 1.96 in all years, which passed the significance test and indicated a significant positive spatial correlation between the degree of coupling coordination of the two systems. The global Moran’s I gradually increased, suggesting that the degree of spatial agglomeration also increased over this period.
Local Spatial Autocorrelation
Our Moran’s scatter plot (Fig. 7.) shows that the local spatial autocorrelation indexes of coupling coordination of the STI and GE systems are distributed in all four quadrants, mostly in the first (H-H) and third (L-L) quadrants. Some are situated in the second (L-H) and fourth (H-L) quadrants, indicating that the high and low values of coupling coordination tend to form bipolar clusters. This is consistent with the aforementioned results on the level of coupling coordination development. To reveal the spatial distributions of local spatial autocorrelation more clearly, a LISA agglomeration map was drawn by matching the attributes of each city with its location (Fig. 8.).
H-H cluster area: In 2012, the H-H area was mainly concentrated in Hefei and the eastern cities, including Ma’anshan, Wuhu, and Tongling. In 2015, Xuancheng and Anqing developed from an L-H area to an H-H area, while in 2021, Huangshan developed from an L-L to an H-H area, showing signs of the H-H area expanding to the south. These results indicate that cities with high coupling coordination drive the development of neighboring regions through a spatial spillover effect.
H-L cluster area: During the first three years, only Bengbu belonged to the H-L agglomeration area but in 2021, it was transformed into an L-L area. It shows that before 2018, Bengbu city’s STI level is in a leading state compared with the surrounding cities, but after 2018, their STI level is low. The main reason is that Bengbu government reduced the investment in scientific research in 2019, in which the proportion of R&D expenditure in GDP and full-time equivalent of R&D personnel decreased significantly. Although the investment in scientific research increased later, the level of STI was still close to that of neighboring cities.
L-H cluster area: In 2012, Huainan, Lu’an, Anqing, Chizhou, Xuancheng, and Suzhou were in the L-H area. These cities are adjacent to the H-H area and are siphoned from, with a large loss of human, financial, and other resources that is not conducive to local development and creates a trough area. With the radiation of the high-value area, the number of L-H cities gradually declined to include only Chuzhou, Lu’an, and Chizhou in 2021.
Fig. 7.
Scattered distributions of local Moran’s I for STI and GE development: a) 2012, b) 2015, c) 2018, d) 2021.
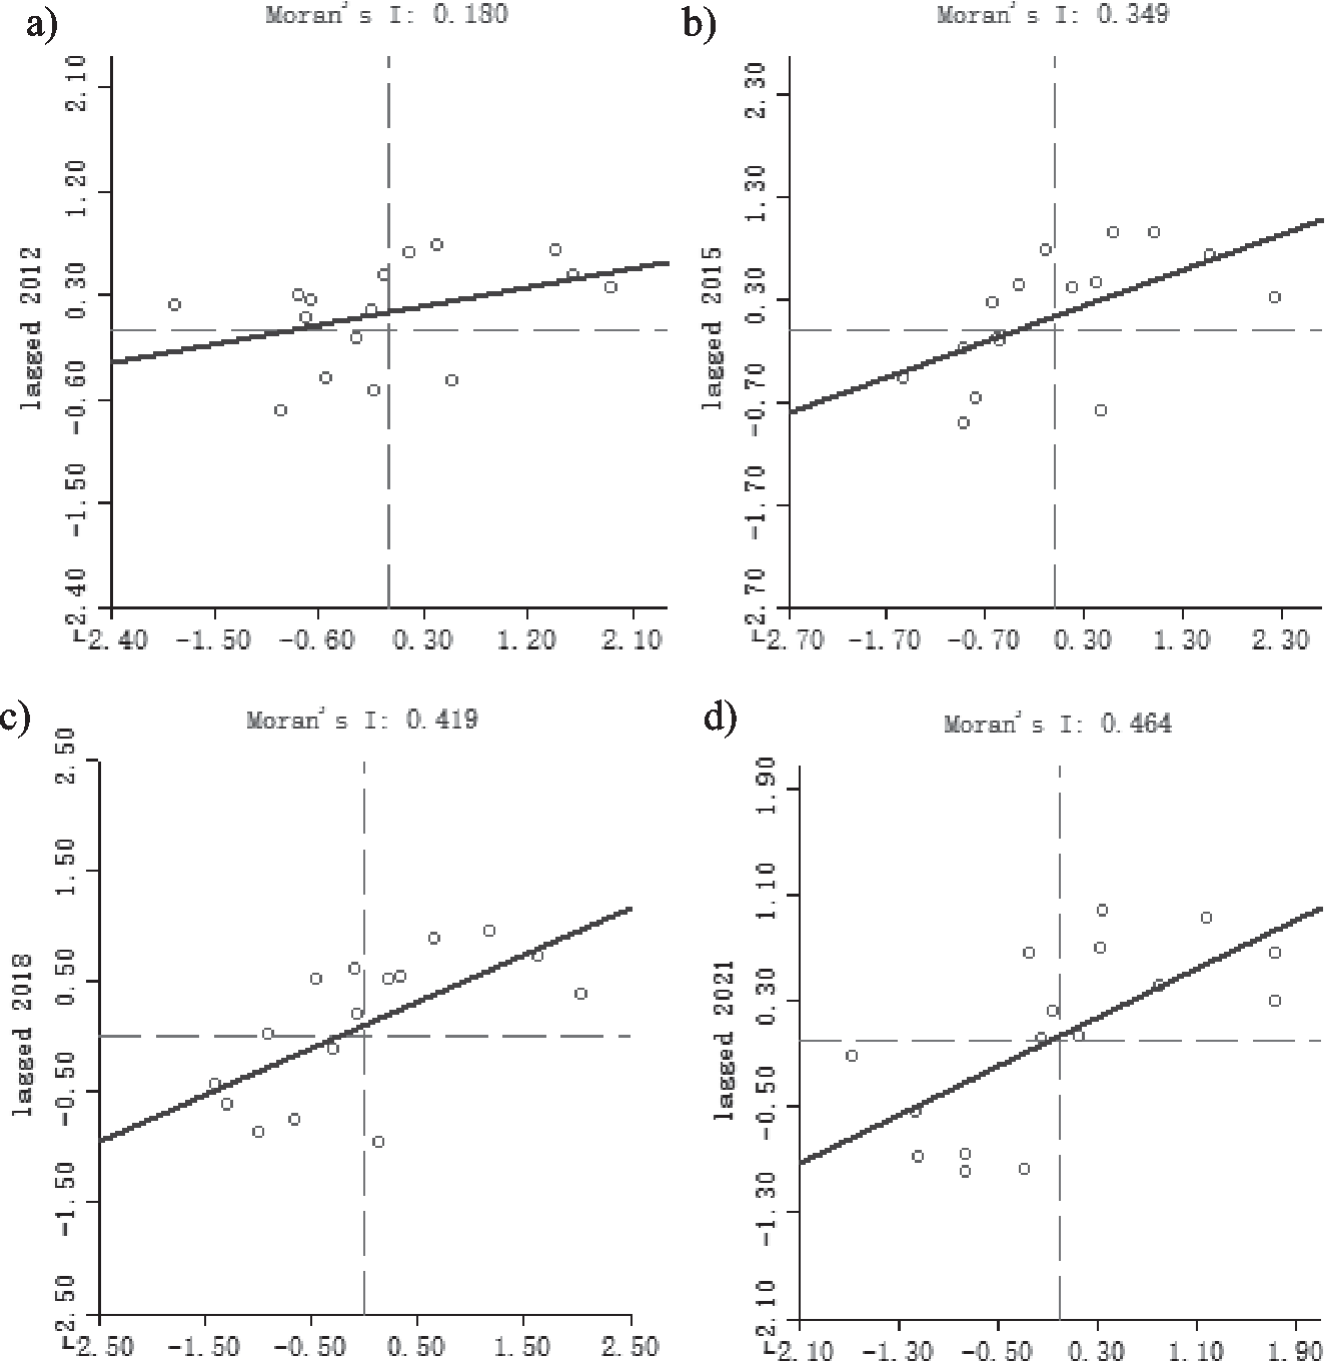
Fig. 8.
Local indicators of spatial association (LISA) clustering of STI and GE coupling coordination: a) 2012, b) 2015, c) 2018, d) 2021.
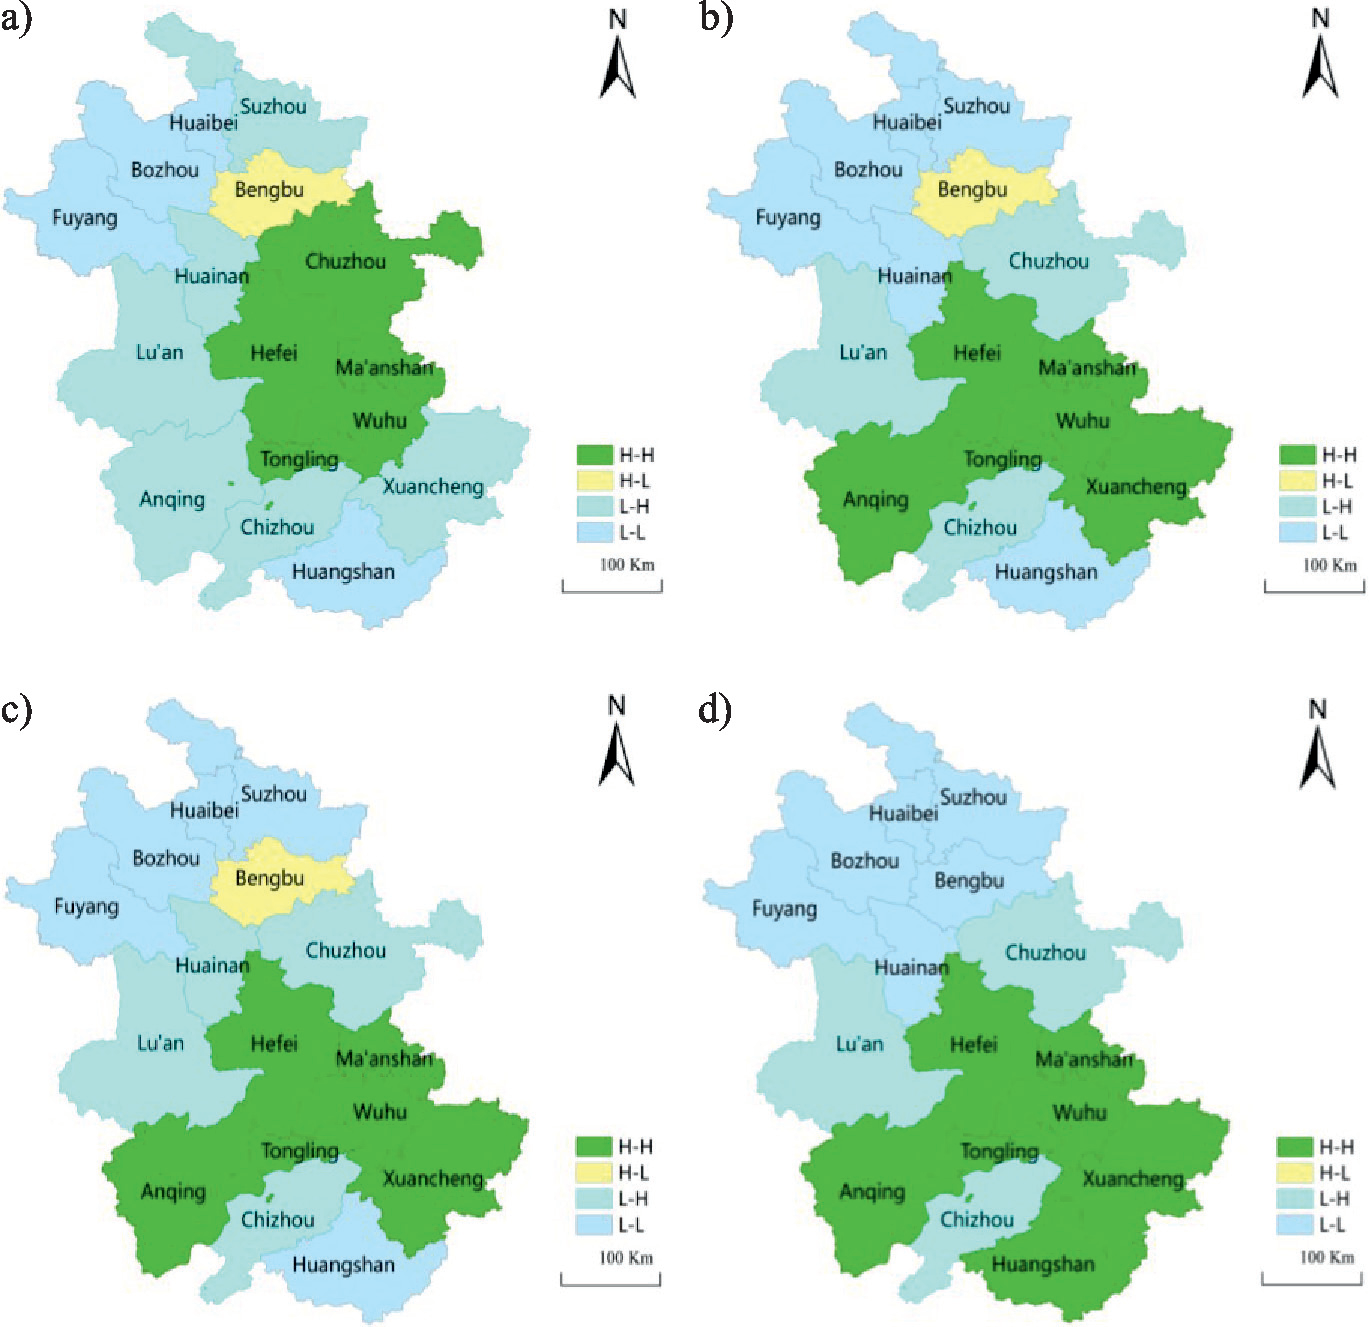
L-L cluster area: The L-L agglomeration area mainly included Fuyang, Bozhou, Huaibei, and Huangshan in 2012 and was concentrated in just six northern cities in 2021. These cities are far from the economic center, the regional industrial structure is undeveloped and unitary, and the economic structure of the primary industry is relatively large. These factors result in serious population losses and restrict the development of STIs; therefore, the level of coupling coordination is not optimal.
Discussion
Based on our analyses, we present several policy recommendations for the current economic development of Anhui Province. First, the level of GE development in Anhui Province was always higher than that of STIs during the study period, but the rate of GE growth was slower than that of STIs. Scientific and technological innovation can not only directly provide technical support for economic development and ecological protection, but also play a “linking role”, that is, indirectly through industrial cultivation and industrial innovation, improve the efficiency of resource utilization, clean production process, reduce the interference and destruction of economic development on resources and environment, and break the bottleneck constraints of resources and environment. At the same time, rapid economic development has injected new impetus into STI. Therefore, relevant departments should take GE as the direction, increase the investment and construction of STI, gradually phase out the “three high industries” (i.e., high pollution, high energy consumption, and high emissions), actively introduce green industries, optimize industrial structures, and improve the level of industrial development to achieve the simultaneous and coordinated development of STI and GE in Anhui Province.
The degree of coupling coordination between STI and GE in Anhui had continuously trended upward, though with substantial spatial heterogeneity and an overall low level. Due to the geographical location and the uneven distribution of resources, the development of cities along the river such as Hefei, Wuhu and Ma’anshan is obviously better than that of other regions, while the development of resource-based cities such as Huainan and Huaibei is slow. This indicates that there is still room for improvement in the development of STI and GE. Therefore, local cities should formulate differentiated development strategies according to their own development level of STI and GE, combined with regional resource endowment advantages. Cooperation and communication with Jiangsu, Zhejiang, and Shanghai should be further strengthened to facilitate full YRD integration. Backward areas should learn from the experience of other regions, introduce new technologies, connect with industrial gradient transfer, and transform the mode of economic development. The role of policy guidance in the chain of STI should be maximized and independent innovation and international cooperation adhered to. Finally, the establishment of enterprise innovation and development of the main body of GE should be explored and the comprehensive strength of industrial and academic research teams should be assembled.
The overall spatial pattern of the H-H cluster area is mainly in the southeastern part of Hefei and its neighboring cities; the L-L cluster area is mainly in the northwestern part of the city where economic development is lagging behind; the L-H cluster area is scattered between the H-H and L-L areas. In order to improve the level of regional coupling and coordination, we should make full use of the radiating effect of the H-H cluster area and drive the L-H gathering area to transform into H-H gathering area. The L-L cluster area should be given priority attention as the primary development object to improve the level of coupling and coordination. So, the incentive mechanism of spatial autocorrelation should be improved by relying on economically developed provinces in the YRD, encouraging high-level areas, such as Hefei to support other cities, and driving the development of surrounding low-value areas through green technology and industrial transfer. Based on their characteristics, low-value agglomeration areas, such as northern Anhui, should maximize their resources to drive regional development and improve marketability. Special policies can be introduced to establish a docking mechanism to guarantee industrial transfer. Simultaneously, we should establish mechanisms for regional synergistic development, mutually promote the STI and GE systems, and gradually reduce the gap to improve the overall level of coordination in Anhui Province.
Conclusions
Using panel data from 16 prefecture-level cities in Anhui Province from 2012-2021, we employed an EWM to measure the overall levels of STI and GE development at both the global and local scales, analyzed the coupled and coordinated development of each region using a coupling coordination model, and examined the spatial correlation between the two systems using a spatial autocorrelation model. Our empirical results show that the level of integrated STI and GE development has maintained an upward trend, with the GE level being ahead of the STI level. While STI has grown at a faster rate than GE, this gap is gradually decreasing. The regional distribution of STI and GE is consistent; they are both unevenly distributed and low overall. The level of development in central cities, led by Hefei, is the highest, while those of other regions are relatively low; overall, the level of development in the southeast is higher than in the northwest.
The degree of coupling between STI and GE has fluctuated but remained highly coupled since 2012. Additionally, the degree of coupling coordination has steadily increased, and the main level of coupling coordination has increased from intermediate to good. Nevertheless, there is still room for progress, as spatial differences in coupling coordination are substantial, with the spatial evolution being centered in Hefei and Wuhu and radiating to the surrounding areas.
The degree of positive correlation in the coupling coordination of STI and GE is significant, as the global Moran’s I has increased each year, along with spatial agglomeration. Most cities are distributed in H-H and L-L areas and few are in L-H and H-L areas. The areas with high and low values of coupling coordination tend to be bipolar agglomerations.

