

Introduction
With its rich history and superior natural conditions, tea production in Fujian Province is a significant contributor to both domestic and export markets [1]. Fujian Province is renowned for its wide variety of tea, including green tea, oolong tea, black tea, white tea, and flower tea [2]. It serves as the place of origin, primary production hub, and significant export center for oolong tea, black tea, white tea, and jasmine tea [1, 3]. Currently, the tea industry stands as one of the nine pillar industries in Fujian Province, playing a distinctive role in enhancing agricultural efficiency, augmenting rural income, and facilitating rural development [3-4]. Although Fujian Province leads in tea yield, the dissemination of asexual superior varieties, and production of various tea types among all tea-producing provinces and cities, there are notable spatial disparities within the province regarding tea yield and cultivated area, leading to uneven levels of tea production [1, 3]. Moreover, the overall comparative advantage of tea production in Fujian Province has been progressively diminishing, particularly concerning locational entropy, where it is no longer as dominant as Zhejiang Province and Guizhou Province [5].
Conversely, Fujian Province’s geographical position at the crossroads of tropical regions in South Asia and Central Asia renders it ideal for tea production due to the favorable temperature and moisture conditions [1]. Some studies had indicated a noteworthy correlation between meteorological factors, including rainfall and high temperature, and the spatial distribution of tea production [6-7]. However, the precise influence of these factors on the comparative advantage of tea production remains uncertain and necessitates additional investigation. Therefore, it is urgent to investigate the meteorological factors influencing the comparative advantage of tea production in Fujian Province and enhance the level of tea production in the ongoing development of the tea industry.
Currently, researchers have conducted numerous studies focusing primarily on the layout, spatiotemporal pattern evolution in China by the Herfindahl index and exploratory spatial data analysis [8], descriptive statistical analysis [9], the spatial gravity model [10] and the concentration index and industry gravity theory [11], Sichuan by exploratory spatial data analysis, and industry gravity model [12] and Sri Lanka by Landsat-5 remote sensing images [13]. Several studies have investigated the factors that influence the layout and spatio-temporal evolution of tea production [1,6-7, 14]. For example, Wu et al. [14] found that changes in the layout of tea production were influenced by natural resources, consumer demand, cultural factors, technological progress, and socio-economic factors. Furthermore, research has demonstrated a strong correlation between the spatio-temporal pattern evolution of tea production and factors such as farmers’ per capita disposable income, tea planting area, yield per unit area, and total power of agricultural machinery [1]. Additionally, studies had found that tea production was adversely affected by excessive rainfall and high temperatures [6-7]. A limited number of scholars have also conducted studies on the comparative advantage of tea production [5, 15-16]. In summary, previous studies lack an analysis of the spatio-temporal patterns of tea production’s comparative advantage at the county level [12, 15]. Additionally, research on the meteorological factors influencing this comparative advantage remains limited and requires further investigation.
Fujian Province is situated in southeastern coastal China (23°31′–28°18′ N, 115°50′–120°43′ E) [17]. It has a subtropical maritime monsoon climate, with mountainous and hilly terrain covering over 80% of its total area [17]. Considering that the annual average temperature, precipitation, and other environmental conditions in most parts of Fujian Province are suitable for tea cultivation [18], this study selects Fujian as a case study. This study examined the spatio-temporal patterns of tea production and the comparative advantage of tea production in Fujian Province from 2001 to 2020. It also analyzed the meteorological factors influencing the comparative advantage of tea production in the province in 2020. The objectives of this study are: (a) to investigate the spatio-temporal patterns of tea production at the county level in Fujian Province; (b) to analyze the spatio-temporal patterns of comparative advantage of tea production at the county level in Fujian Province; and (c) to identify the key meteorological factors influencing the comparative advantage of tea production at the county level in Fujian Province.
Materials and Methods
Data Collection and Processing
The data on tea production and gross domestic product (GDP) of counties in Fujian Province during 2001-2020 were collected from the Fujian Statistical Yearbook (2000-2021). The MODIS Land Surface Temperature (LST) standard products, with a spatial resolution of 1 km×1 km during 2001-2020, were obtained from NASA (https://ladsweb.modaps.eosdis. nasa.gov/). The ERA5 Monthly Product Data, including the wind speed, precipitation, air temperature, sunlight intensity, evaporation, and atmospheric pressure with a spatial resolution of 0.1°×0.1°, were collected from the European Centre for Medium-Range Weather Forecasts (https://cds.climate.copernicus.eu/). The meteorological factors, including ground temperature, wind speed, precipitation, air temperature, sunlight intensity, evaporation, and atmospheric pressure of counties in Fujian Province, were extracted using spatial analysis with ArcGIS 10.6. Hotspot analysis was performed using ArcGIS 10.6, while the geographic detector analysis was carried out by using GeoDetector_2015.
Resource Endowment Coefficient
The resource endowment coefficient measures the proportion of a specific resource in a country or region relative to its gross domestic product (GDP) at both national and global levels [19]. This study used the resource endowment coefficient to assess the comparative advantage of tea production in Fujian Province. The calculation of the resource endowment coefficient is as follows [19]:
where Rit represents the resource endowment coefficient of tea production in region i during period t, Vit represents tea production in region i during period t, Vi represents tea production in Fujian Province during period t, Git represents gross national product in region i during period t, and Gi represents gross national product in Fujian Province during period t. If 0<Rit<1, it indicates that the region has no comparative advantage of resource endowment of tea production. If 1<Rit<2, it indicates that the region has a certain comparative advantage of resource endowment of tea production. If Rit>2, it indicates that the region has a strong comparative advantage of resource endowment of tea production.
Hotspot Analysis
The hotspot analysis using Getis-Ord Gi* identifies statistically significant clusters, where high values cluster together (hot spots) and low values cluster together (cold spots) [20-21]. The Getis-Ord Gi* analysis was utilized in this study to identify hotspots and coldspots of tea production in Fujian Province using ArcGIS 10.6 software. The formula for Getis-Ord Gi* is as follows [21-22]:
where Xj is the attribute value of for feature j; wij(d) is the spatial weighted matrix between feature i and j; n represents the total number of features; Z(Gi*) is standardized value; Var(Gi*) is variation value; E(Gi*) is expected value.
Geographic Detector
The geographic detector is a novel statistical method used to identify spatial heterogeneity and uncover the underlying factors driving it [23]. The geographic detector consists of four components: a factor detector, an interaction detector, an ecological detector, and a risk detector [24]. The factors contributing to the comparative advantage of tea production in Fujian Province were identified and analyzed using the factor detector and interaction detector in this study. The factor detector can be expressed as follows [23-25]:
where q represents the explanatory power of independent variables, k represents the number of sub-regions of factor X, N and Nk represent the total number of units in the study area and the number of samples in sub-region k, respectively. σ2 and σk2 represent the total variance and variance of samples in sub-region k, respectively. The value of q is within the range [0,1] [24]. The larger the q value, the stronger the heterogeneity of spatial stratification [24].
Based on the factor detector, the interaction detector investigated the interactions between two distinct factors, X1 and X2 [24, 26]. Initially, the relative importance q1∩q2 was computed following the interaction [24, 26]. Then, the interaction effect of individual factor (q1, q2) was compared with the driving forces after interaction (q1∩q2) [24, 26]. The interaction detector contained five types of interactions, including nonlinear attenuation, univariate attenuation, bivariate enhancement, independent, and nonlinear enhancement (Table 1) [26].
Results
Spatio-Temporal Pattern of Tea Production in Fujian Province During 2001-2020
Tea production at the county level in Fujian Province exhibited significant regional variations from 2001 to 2020, as depicted in Fig. 1.
Initially, the spatio-temporal pattern of tea production displayed a scattered distribution, which later gradually shifted towards an aggregated distribution between 2001 and 2020. There was a gradual increase in the number of counties with high tea production from 2001 to 2020. Most counties in Fujian Province had low tea production. The regions with high tea production between 2001 and 2020 were primarily concentrated in Anxi, Youxi, Zhenghe, Wuyishan, Jian’ou, Shouning, Fuding, and Fu’an. This phenomenon may be attributed to the geographic distribution of tea cultivation in Fujian Province, which is primarily concentrated in four major regions: northern, southern, eastern, and western Fujian. Notably, Wuyishan and Anxi serve as the province’s core areas of tea production. Furthermore, the regions with high tea production had an obvious relation with mountainous regions, particularly in areas surrounding the Wuyi, Daiyun, Taimu, and Bopingling mountain ranges. In addition, counties with high GDP levels, especially in coastal areas, generally demonstrated low tea production outputs.
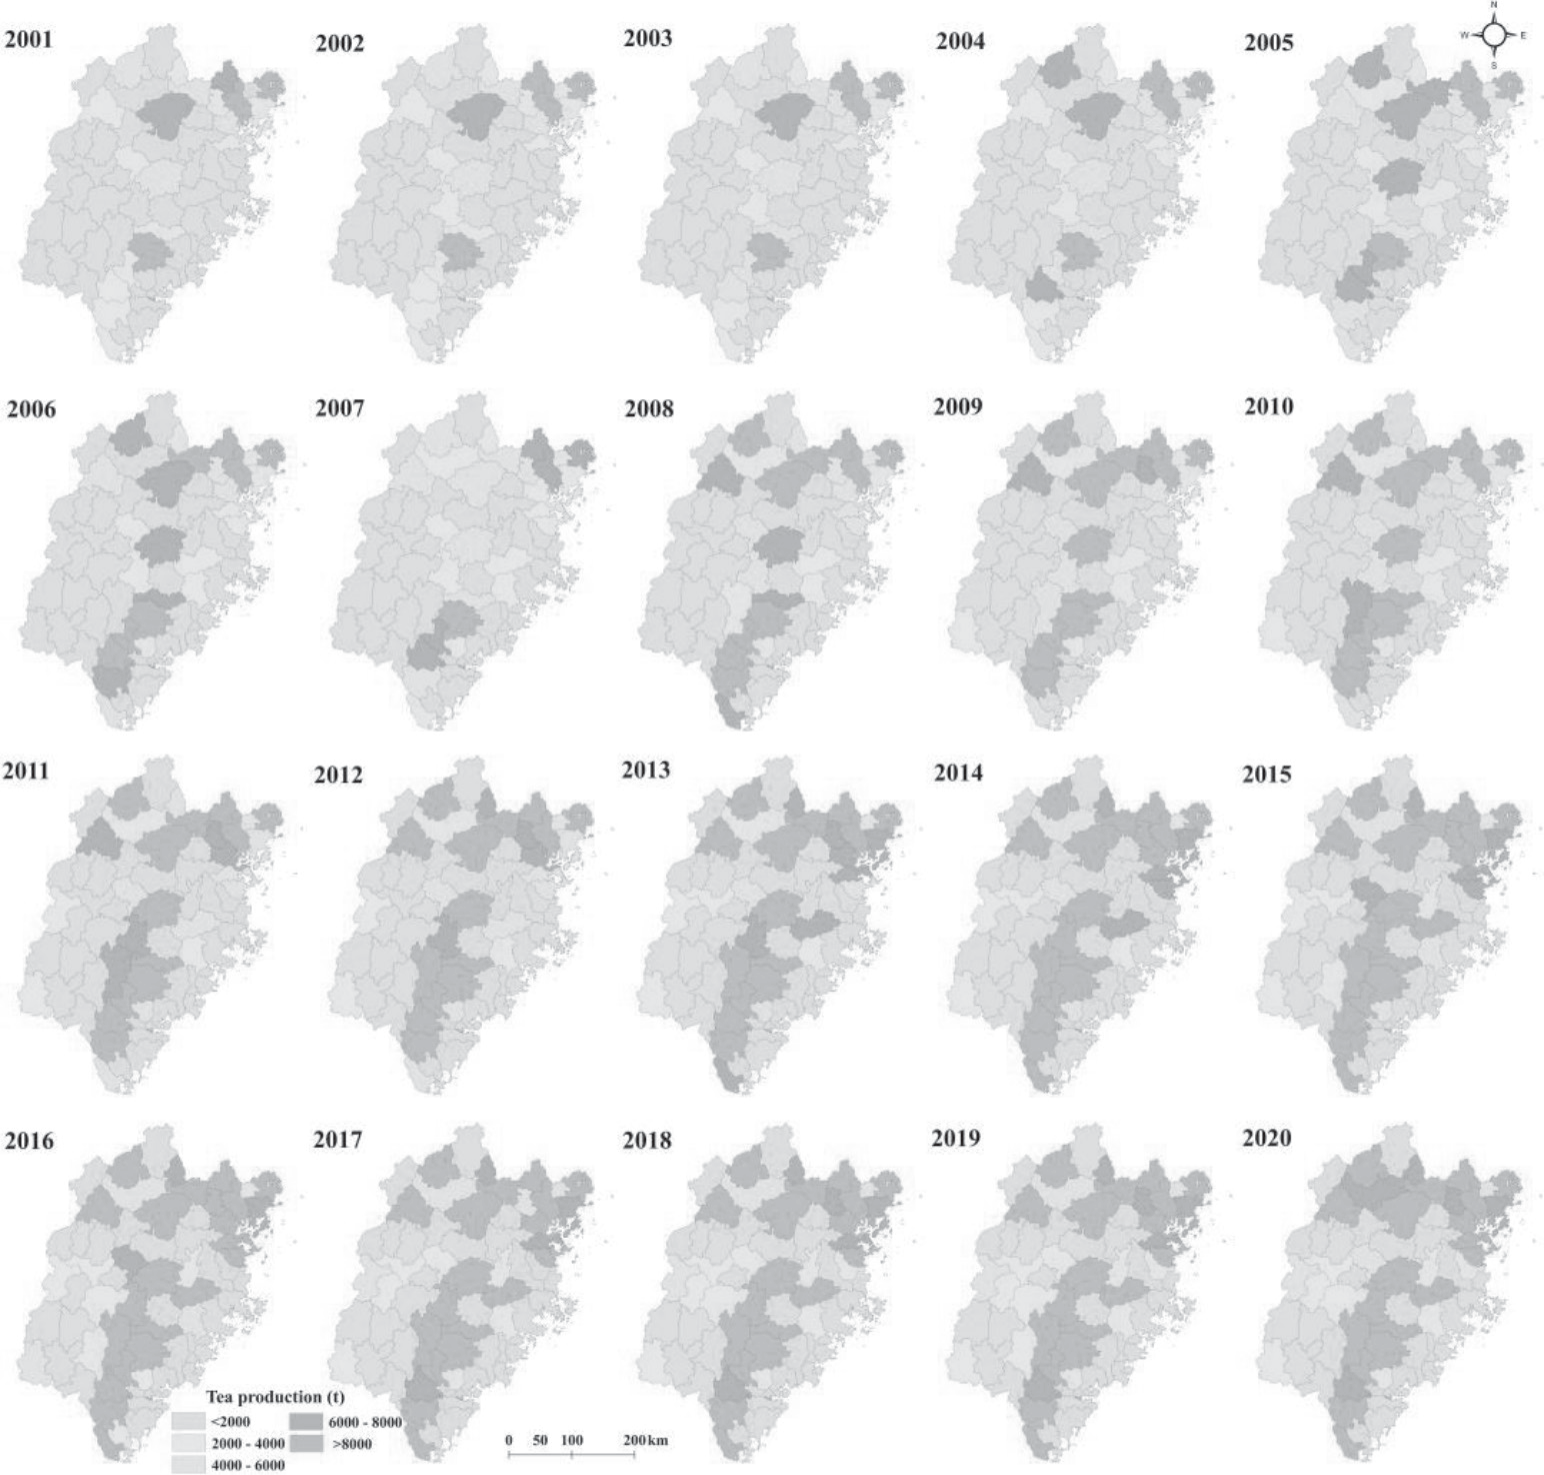
The highest tea production was 75,613 t in Anxi in 2020, followed by 73,428 t in Anxi in 2019. The lowest tea production was 0 tons in Pingtan, Shishi, and Dongshan during 2001-2020, and in Jinjiang during 2007-2020. The tea production in the majority of Fujian Province’s counties during 2001-2020 experienced a noticeable increase, constituting 92.54% of the total counties. Anxi witnessed the highest increase in tea production during 2001-2020, with a rise of 60,510 t, followed by Fuding with a rise of 23,522 t. Tea production decreased in only 5 counties from 2007 to 2020. Yanping experienced the greatest decrease in tea production during 2001-2020, with a decline of 601 t, followed by Gutian with a decline of 336 t.
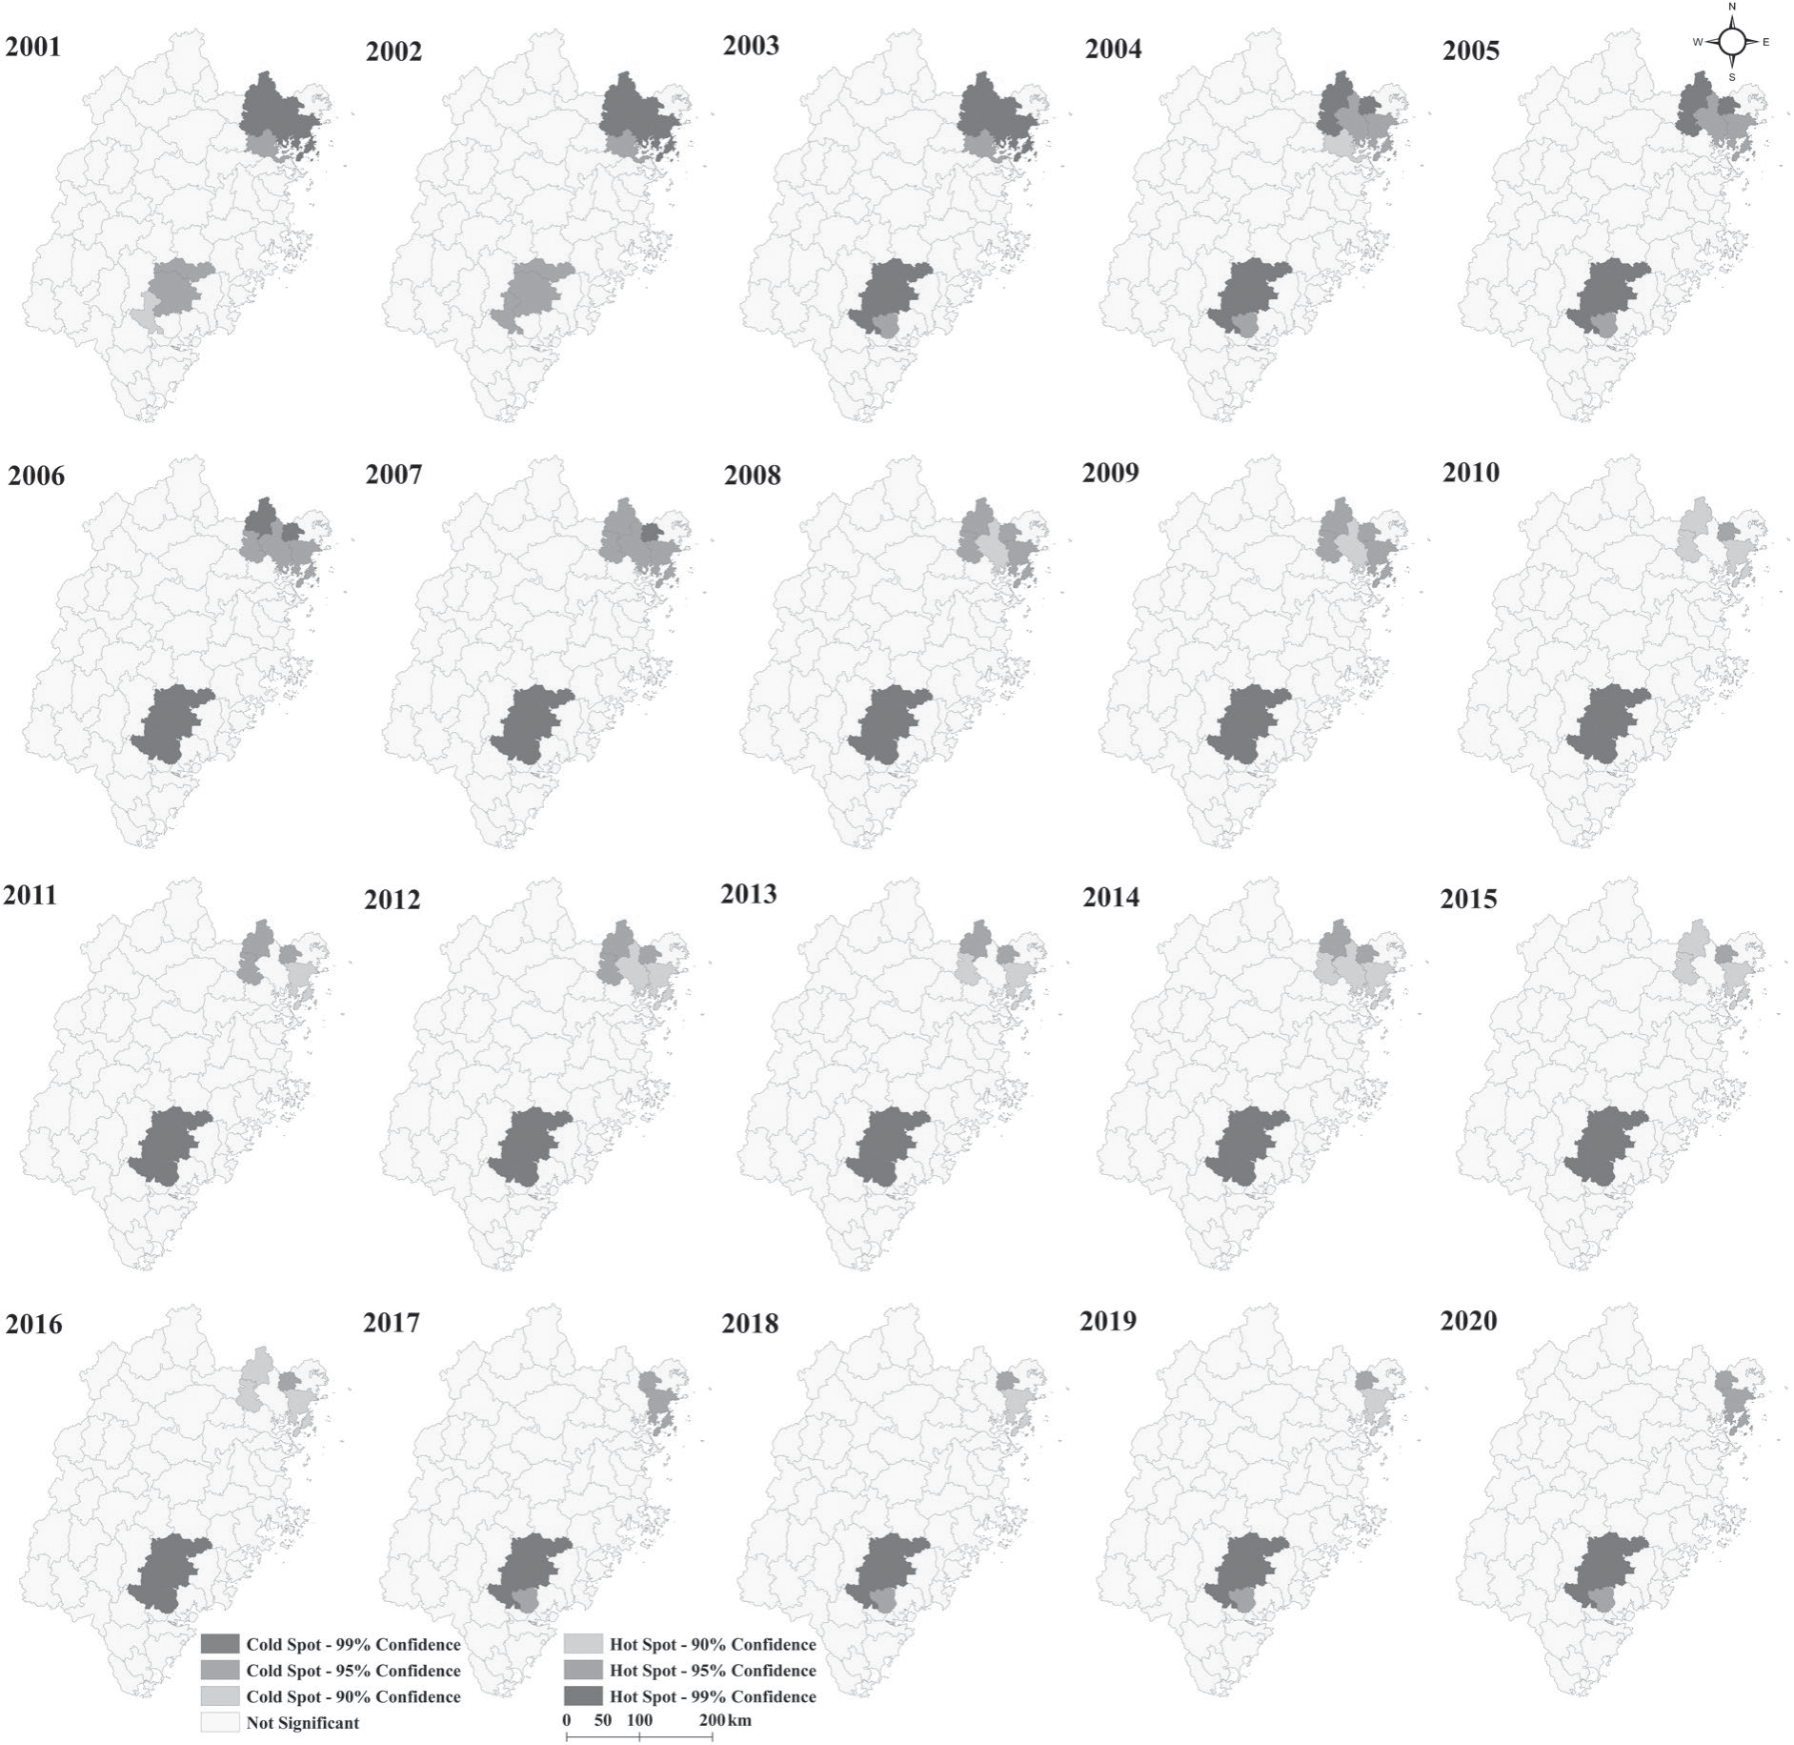
Fig. 2 revealed the presence of two prominent tea production hotspots in Fujian Province from 2001 to 2020, displaying a “dual core” agglomeration pattern. The one core is mainly located in eastern Fujian Province, including Shouning, Zhouning, Zherong, Fu’an, Xiapu, and the municipal district of Ningde City. The other core is mainly located in southern Fujian province, including Anxi, Changtai, Hua’an, and Yongchun. The core production areas in eastern and southern Fujian Province showed distinct correlations with the Taimu and Daiyun mountain ranges, respectively. During 2001-2020, the range of hotspots of tea production in southern Fujian Province remained basically consistent; however, the range of hotspots of tea production in eastern Fujian Province narrowed gradually over time. The hotspot area for tea production in eastern Fujian Province decreased by 72.65%, declining from 5,561.27 km² in 2001 to 1,520.75 km² in 2020. The hotspot area for tea production in southern Fujian Province expanded from 4,012.51 km² in 2001 to 4,634.74 km² in 2003 and remained stable at this level until 2020.
Spatio-Temporal Pattern of Comparative Advantage of Tea Production in Fujian Province
Fig. 3 indicates clear spatio-temporal differences in the comparative advantage of tea production at the county level in Fujian Province from 2001 to 2020. The counties that exhibited a high comparative advantage of tea production during 2001-2020 were primarily located in the northern region of Fujian Province, including Wuyishan, Zhenghe, Jianyang, Songxi, and Jian’ou. Additionally, some areas in eastern Fujian Province, such as Shouning, Zherong, Xiapu, Zhouning, Fuding, and Fu’an, as well as southern Fujian Province, including Yongchun, Anxi, Nanjing, and Hua’an, also showed high comparative advantage. Counties exhibiting high comparative advantage of tea production showed significant geographic correlation with mountainous regions, particularly in areas adjacent to the Wuyi, Daiyun, Taimu, and Bopingling mountain ranges. Moreover, coastal counties with higher GDP levels consistently exhibited lower comparative advantages of tea production, suggesting an inverse relationship between economic development and tea cultivation specialization.
The counties that had a low comparative advantage of tea production during 2001-2020 were primarily located in the coastal areas of Fujian Province, including Changle, Fuqing, Shishi, Jinjiang, and Dongshan, as well as in western Fujian Province, including Shanghang, Changting, Liancheng, and Yongding. Statistical data analysis revealed that the highest comparative advantage of tea production in Fujian Province was 23.80 in Zhenghe in 2006, with Anxi following closely at 23.18 in 2011. The lowest comparative advantage of tea production in Fujian Province was 0, observed in Pingtan County, Shishi, and Dongshan from 2001 to 2020, and in Jinjiang from 2007 to 2020. Nearly half of the counties in Fujian Province experienced a decrease in comparative advantage for tea production from 2001 to 2020. The largest increase in comparative advantage for tea production from 2001 to 2020 was 5.47 in Hua’an, followed by 4.10 in Anxi. More than half of the counties in Fujian Province experienced a decrease in comparative advantage for tea production from 2001 to 2020. The largest decrease in comparative advantage for tea production from 2001 to 2020 was 7.57 in Zhenghe, followed by 4.36 in Fu’an. Altogether, Shouning, Wuyishan, Zhenghe, Zhouning, Songxi, Anxi, and Hua’an always had a high comparative advantage of tea production, which exceeded 5 during 2001-2020.
Fig. 3.
Spatio-temporal pattern of comparative advantage of tea production in Fujian province during 2001-2020.
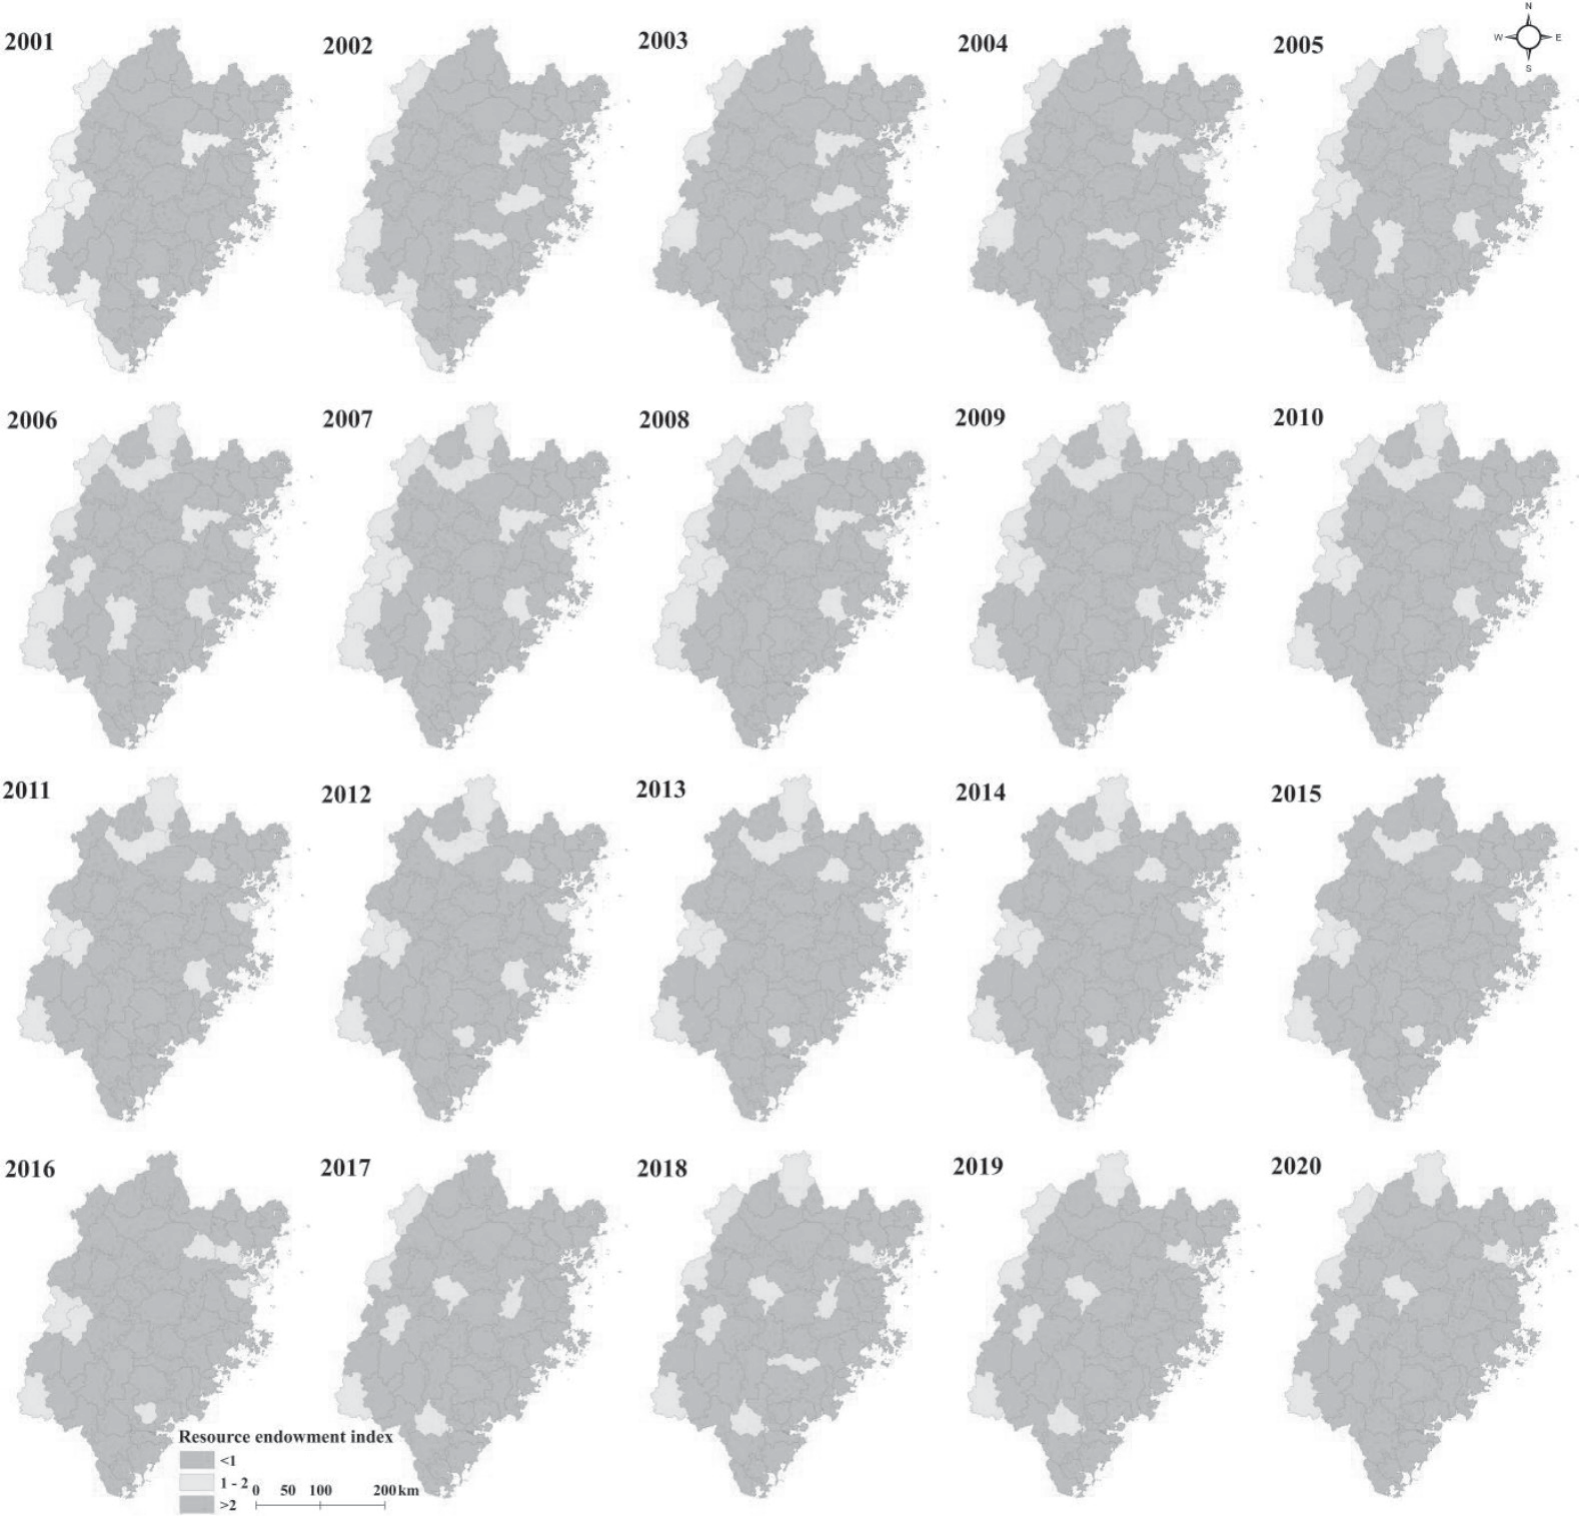
Fig. 4 shows a significant hotspot of comparative advantage of tea production in the northeast part of Fujian province, including Songxi, Zhenghe, Shouning, Pingnan, Zhouning, Fu’an, and Zherong, during the period of 2001-2020. This hotspot of comparative advantage of tea production showed distinct correlations with the Taimu and Jiufeng Mountains. Another hotspot of comparative advantage in tea production, located in Hua’an and Anxi, emerged between 2006 and 2016, although it was not as prominent. This hotspot of comparative advantage of tea production was primarily in areas adjacent to Daiyun Mountain. A coldspot, characterized by a comparative disadvantage in tea production, was observed in Jinjiang during the periods of 2001-2005 and 2014-2020. The hotspot area of tea production in northeastern Fujian Province decreased from 8,628.44 km² in 2001 to 5,471.71 km² in 2020. In contrast, the hotspot area of tea production in southern Fujian Province expanded from 910.25 km² in 2006 to 4,338.44 km² in 2010 but declined to 2,977.89 km² by 2016. The coldspot area of tea production first appeared (455.73 km²) during 2001-2005, then expanded from 455.73 km² in 2014 to 2,101.25 km² in 2020.
Analysis Results of Meteorological Factors for the Comparative Advantage of Tea Production in Fujian Province During 2001-2020
Using the county as the evaluation unit of analysis, we applied the geographic detector to assess the influence of meteorological factors, including ground temperature, wind speed, precipitation, air temperature, sunlight intensity, evaporation, and atmospheric pressure, on the comparative advantage of tea production as an independent variable by using GeoDetector_2015. These factors were discretized using the natural breaks method prior to analysis. Both factor detection and interaction detection analyses were conducted.
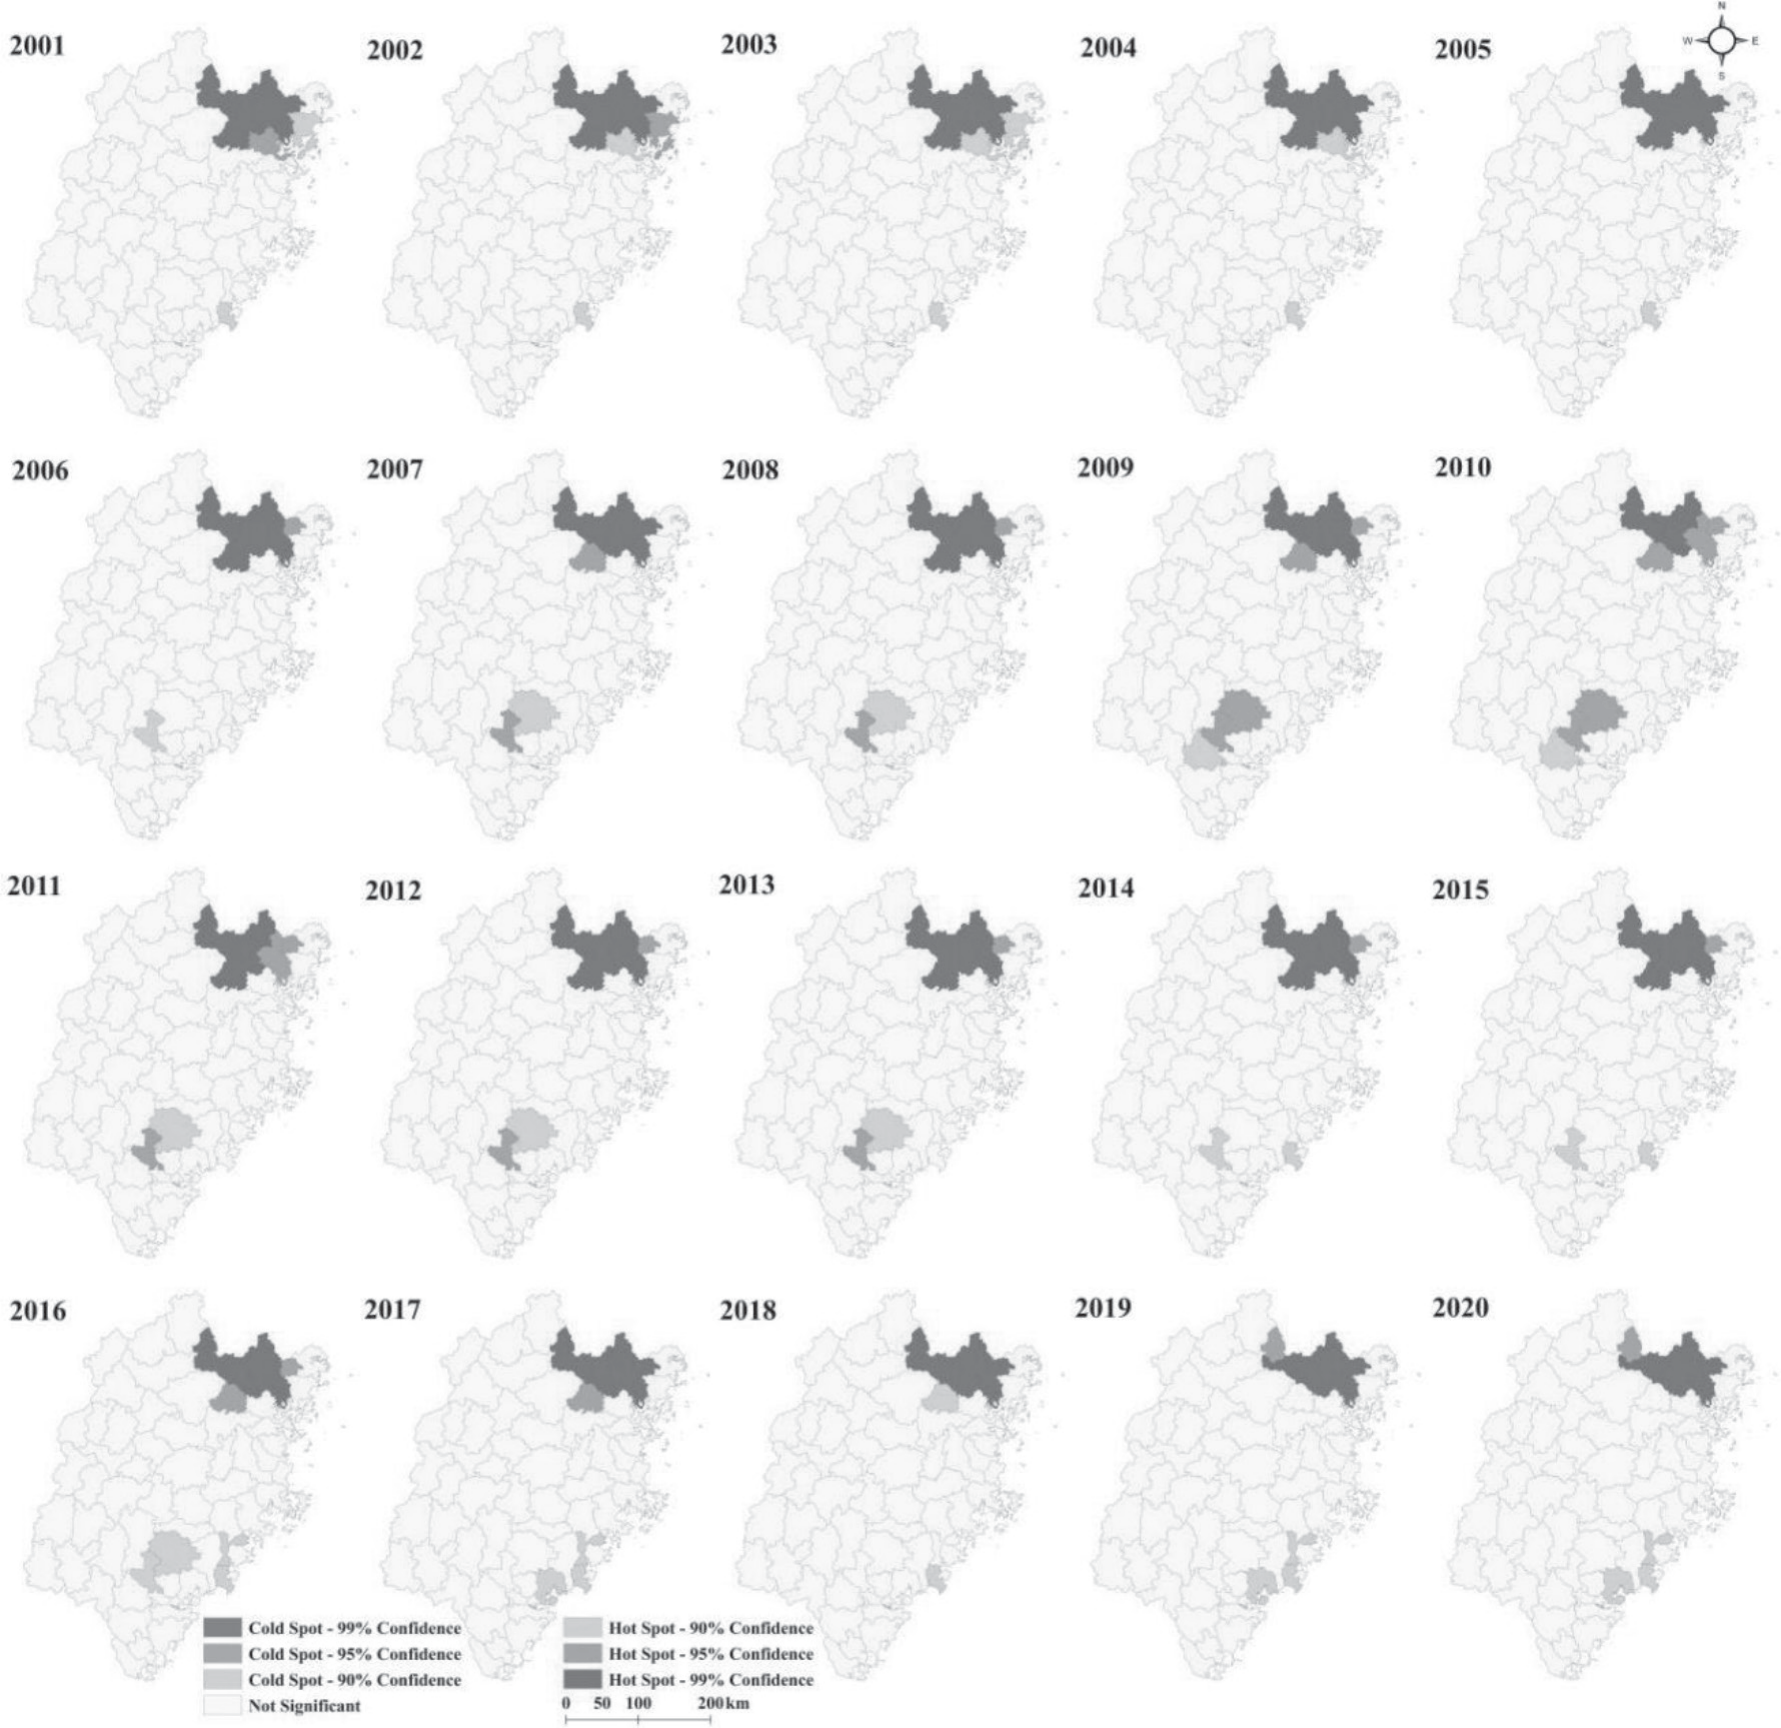
Table 2.
Detector results of meteorological factors for comparative advantage of tea production in Fujian province in 2020 (q value).
The calculations were conducted to investigate the influence of these factors on the comparative advantage of tea production in Fujian Province during the period of 2001-2020. The results are presented in Tables 2 and 3. A higher value indicates a greater explanatory power of these meteorological factors on the spatial differentiation of the comparative advantage of tea production.
Table 2 showed that the ranking of the average influence of meteorological factors on comparative advantage of tea production was as follows: air temperature>atmospheric pressure>ground temperature>sunlight intensity>wind speed>precip itation>evaporation. Air temperature in April, May, June, and July, as well as evaporation in June and July, exhibited a significant contribution rate with q values exceeding 0.3. However, overall, the contribution rate of individual meteorological factors was relatively small. The highest q value was 0.338 for air temperature in July, followed by 0.326 for air temperature in April and May. Based on the comparison of data from Tables 2 and 3, it was evident that the interaction between any two meteorological factors had a greater impact on the comparative advantage of tea production than the independent effect of a single factor, indicating a dual-factor enhancement effect. The interaction and combination of atmospheric pressure and air temperature, along with other meteorological factors, could significantly improve the q values. The highest q value observed was 0.666 in the interaction between atmospheric pressure and sunlight intensity in January, followed by 0.587 in the interaction between air temperature and sunlight intensity.
In general, the comparative advantage of tea production in Fujian Province in 2020 was influenced by meteorological factors such as air temperature and atmospheric pressure. The combined effect of various meteorological factors on the comparative advantage of tea production was significantly greater than that of individual factors.
Discussion
This research analyzed the spatio-temporal pattern of tea production and its comparative advantage in Fujian Province at the county level during 2001-2020. Furthermore, it explored the meteorological factors that influenced the comparative advantage of tea production in Fujian Province at the county level in 2020. Previous studies have conducted analyses on the spatio-temporal pattern of tea production [1, 12, 14]. Similar to these studies, our results revealed the spatio-temporal pattern of tea production in Fujian Province at the county level from 2001 to 2020. Unlike the study [1], which was conducted at the city level, our county-level analysis provides a more accurate spatial distribution pattern. In contrast to the study [12], which applied kernel density analysis, our approach using hotspot analysis better elucidates the spatio-temporal pattern of tea production, which is also confirmed by the study [14]. In addition, our research not only demonstrated the spatio-temporal pattern of tea production but also revealed the comparative advantage of tea production at the county level during the same period. Moreover, we discovered a “dual core” agglomeration pattern of tea production, with one obvious hotspot, one less obvious hotspot, and one cold spot, showing comparative advantages in Fujian Province from 2001 to 2020. To our knowledge, few studies have reported similar results. Additionally, we utilized the resource endowment coefficient to calculate the comparative advantage of tea production at the county level in Fujian Province.
The resource endowment coefficient could be employed to compare the cost perspectives of different regions engaged in the production of specific products. This coefficient has been extensively utilized in various domains, including agriculture [27] and fisheries [28], to analyze comparative advantages. Consistent with these studies, our findings also shed light on the comparative advantage of tea production.
Furthermore, we discovered that meteorological factors, such as air temperature, precipitation, and atmospheric pressure, significantly influenced the comparative advantage of tea production in Fujian Province in 2020. Notably, air temperature in April, May, June, and July, as well as evaporation in June and July, played crucial roles. Prior research has also established that temperature and precipitation impact tea production [7, 29-30]. Unlike study [7] that relied on panel data statistical analyses, study [29] that employed Sen’s slope estimator with Mann-Kendall and regression tests, and study [30] that applied the DNDC model, geographic detector approach adopted in this study effectively detected spatial heterogeneity and identified key driving factors of meteorological influences on tea production. Moreover, in contrast to these previous studies, our investigation simultaneously examines both individual and interactive impacts of meteorological factors (ground temperature, wind speed, precipitation, air temperature, sunlight intensity, evaporation, and atmospheric pressure) on the comparative advantage of tea production.
Table 3.
Interaction detector results of meteorological factors for comparative advantage of tea production in Fujian province in 2020.
Our results revealed that air temperature in April, May, June and July significantly influenced the comparative advantage of tea production. This may be because the tea in Fujian Province is typically harvested in two peak seasons: mid-April to early May and mid-June to early July. Moreover, the evaporation in June and July had an obvious impact on the comparative advantage of tea production in Fujian Province. The reason might be that evaporation is a critical factor influencing the water balance of tea plants, particularly during the high-temperature period in June and July. Notably, the interactive effects between meteorological factors exerted a stronger influence on the comparative advantage of tea production than any single factor. This indicated that the spatio-temporal pattern of comparative advantage of tea production in Fujian Province is not controlled by a single meteorological factor. Therefore, regarding the tea production in Fujian Province, one should consider not only single meteorological factors like air temperature and evaporation, but also interacting meteorological factors, particularly the combined effects of air temperature and sunlight intensity, as well as atmospheric pressure and sunlight intensity. The results provide valuable insights for concentrating tea production in climatically advantageous areas, establishing specialized production zones, and ultimately enhancing both tea yield and farmer incomes, thereby supporting rural revitalization initiatives. Drawing on the comparative advantage of tea production and the predominant meteorological factors influencing it, the government might formulate policies to support tea production management departments and farmers in optimizing the layout of tea production. Additionally, these results contributed to the effective utilization of the climate advantages of tea production in Fujian Province, further enhancing its competitiveness and popularity.
There are three main limitations to this study. Firstly, this study only utilized the resource endowment coefficient to calculate the comparative advantage of tea production. In the future, methods such as the concentration coefficient, revealed comparative advantage, and comprehensive advantage index may be employed to calculate the comparative advantage of tea production. Secondly, we only analyzed the meteorological factors that influenced the comparative advantage of tea production in Fujian Province in 2020. To enhance the reliability and accuracy of the results, it is recommended that the meteorological factors influencing the comparative advantage of tea production in multiple years be examined in future research. Thirdly, we only considered total tea production data and did not consider structural differences among tea types (e.g., oolong, green tea) due to a lack of subtype-specific output data. In the future, data on the output of different tea types should be collected and analyzed for more accurate interpretation.
Conclusions
Our findings revealed a “dual core” agglomeration pattern for the spatio-temporal distribution of tea production from 2001 to 2020. Furthermore, our results disclosed a prominent hotspot, a less noticeable hotspot, and a coldspot for the spatio-temporal pattern of the comparative advantage of tea production. Additionally, we identify the dominant meteorological factors that influenced the comparative advantage of tea production in Fujian Province in 2020. Altogether, this study successfully disclosed the spatio-temporal pattern and meteorological factors of the comparative advantage of tea production in Fujian Province.

