

Introduction
Pulmonary tuberculosis (PTB) refers to tuberculous lesions of lung tissue, trachea, bronchus, and pleura, which are classified into five types: primary #Contributed equally tuberculosis, blood-borne tuberculosis, secondary tuberculosis, tuberculous pleurisy, and trachea and bronchial tuberculosis [1]. The primary method of spreading pulmonary tuberculosis is through the air. By coughing or sneezing, pulmonary tuberculosis patients release droplet nuclei containing the tuberculosis virus into the air, potentially infecting everyone who comes into contact with the contaminated area. Many factors influence the development of pulmonary tuberculosis, and studies show that meteorological factors [2], socioeconomic factors [3], and geo-ecological factors [4] are closely linked to the development of pulmonary tuberculosis.
Meteorological factors and air pollution may influence tuberculosis by affecting the growth, reproduction, and spread of mycobacterium tuberculosis [5]. Studies have shown that innate immunity in respiratory epithelial cells exposed to air pollution particles decreases, which leads to faster growth of Mycobacterium tuberculosis, stimulates apoptosis of macrophages, damages the immune system, and increases the risk of pulmonary tuberculosis transmission [6, 7]. The probability of developing drug-resistant tuberculosis was shown to be greatly elevated by exposure to ambient air pollution (PM2.5, PM10, O3, and CO), according to Yao L’s study [8]. PM2.5 carries metal ions into the alveoli and bronchi, causing various inflammatory responses that increase the risk of TB [9]. The humid environment promotes the growth and reproduction of TB bacteria, which may lead to an increased incidence of TB, while the high wind speed dilutes the concentration of TB bacteria in the air, which may reduce the risk of TB. On the one hand, prolonged sunlight exposure and large amounts of ultraviolet radiation limit the growth and reproduction of mycobacterium tuberculosis. On the other hand, ultraviolet light can help the synthesis of vitamin D, which can protect individuals from TB to some extent [9, 10]. Therefore, the degree of environmental pollution and meteorological factors have an important impact on the spread of tuberculosis. According to a study by Wang et al., they used DLNM to find short-term and cumulative lag effects in TB development [11]. Climate change has a delayed effect on tuberculosis. DLNM can better analyze the influence of meteorological factors on the incidence of tuberculosis and explore the nonlinear exposure-response dependence and delayed effect of the relationship between meteorological factors and the incidence of tuberculosis [12]. For example, the health effects of temperature usually have a J-shaped [13], U-shaped, V-shaped, or W-shaped [14] nonlinear distribution, which is not suitable to be studied using linear methods, while the distributed lag non-linear model (DLNM) proposed by Armstrong [15] is based on the simultaneous consideration of the lag effect of exposure factors and the nonlinear relationship between exposure-response. Based on the simultaneous consideration of the lag effect of exposure factors and the non-linear relationship of exposure-response, the lag effect and the non-linear relationship between exposure factors and health indicators were well integrated by the cross-basis process, which was often used to study the lag and non-linear effects of exposure on response. Armstrong used DLNM in 2006 to research how temperature affects health. In this work, the incidence data of tuberculosis in Changde City, Hunan Province, from 2010 to 2021 and the meteorological and air quality data of the same period were used to screen for external factors that may affect the daily incidence of tuberculosis and analyze the correlation between the incidence of tuberculosis, meteorological factors, and air pollutants. The short-term hysteretic nonlinear effects of meteorological factors and air pollutants on pulmonary tuberculosis were investigated by the distributed lag non-linear model.
Study Site
Changde City, Hunan Province (28º~31ºN, 110º~113ºE), is located in northwest Hunan Province. It is an important node in the Yangtze River Economic Belt and an important part of the Dongting Lake Ecological Economic Zone. According to the seventh national census, Changde City has a total area of 18,200 square kilometers and covers 9 districts, counties, and 5 administrative districts, with a resident population of 527,910.000 [16].
Data Collection
Pulmonary Tuberculosis Epidemic Information
Data for this study were obtained from the Changde City CDC-Disease Surveillance Information Reporting Management System in Changde, Hunan Province, during the period from January 1, 2010, to December 31, 2021. Cases are presented on a case-by-case basis, and the main information includes the patient’s gender, age, type of occupation, date of diagnosis, current address and diagnosis, etc. All privacy-related information is confidential. The case report registration information form is filled out by district and county CDC professionals and entered into the Infectious Disease Information Reporting Management System, which is reported within 24 hours.
Meteorological Data
From the National Climate Data Sharing Center (http://data.cma.cn), meteorological data can be obtained. Meteorological factors include daily mean temperature (ºC), daily maximum temperature (ºC), daily minimum temperature (ºC), daily relative humidity (%), daily mean air pressure (kPa), daily precipitation (mm), daily mean wind speed (m/s), and sunshine hours. The sunshine hours employed in this study are the peak sunshine hours, which are the total daily solar irradiance adjusted to the length of the standard test conditions (irradiance 1000 w/m2) in hours.
Air Pollutant Information
Air pollutants were downloaded from the Department of Ecology and Environment of Hunan Province (http://sthjt.hunan.gov.cn/ (accessed on 20 May 2022)). The air quality factors involved included particulate matter with an aerodynamic diameter of less than 2.5 µm (PM2.5, µg/m3), particulate matter with an aerodynamic diameter of less than 10 µm (PM10, µg/m3), ozone (O3, µg/m3), sulfur dioxide (SO2, µg/m3), nitrogen dioxide (NO2, µg/m3), and carbon monoxide (CO, mg/m3).
Statistical Analysis
The degree and direction of the association between variables can be expressed using the correlation coefficient. According to the data characteristics of the variables, Pearson product difference correlation analysis or Spearman rank correlation analysis can be used to determine the correlation coefficient between bivariate variables. Cohen first proposed that a correlation coefficient r, taking the absolute value after the size of 0-0.09, indicates no connection, 0.1-0.3 indicates a weak correlation, 0.3-0.5 indicates a moderate correlation and 0.5-1.0 indicates a strong correlation [17]. Additionally, the two variables are thought to be significantly correlated and possibly co-collinear when |r|>0.7 [18]. The correlation coefficient was statistically tested, and P<0.05 was deemed statistically significant. In this study, the characteristics of pulmonary tuberculosis incidence data and meteorological and air pollutants data were studied by pre-analysis, and the relationship between pulmonary tuberculosis incidence and meteorological factors and air pollutants was investigated by Pearson correlation analysis or Spearman rank correlation analysis.
Epidemiologically, due to the incubation period of many diseases, the health effects of exposure may not occur at the same time, and this is particularly evident concerning meteorological and air quality effects on health. Exposure (to atmospheric factors and air pollutants) and its consequences may have a time lag; this lag is referred to as the lag time, and the delayed impact of the exposure on the general public’s health is referred to as the lag effect of the exposure. Previous studies have used generalized linear models, sliding mean methods, and exponential smoothing models to evaluate the lagged effects of exposure factors, but they are all based on the linear relationship between exposure and response; however, most exposure-response relationships in real-world studies are non-linear, especially in the health effects of meteorology and air quality. In 2010, Gasparin, Armstrong, et al. introduced the implementation of the distributed lag non-linear models using DLNM in the R programming language after further elaborating on it based on the generalized additive models and generalized linear model [19].
The basic structure of the model is:
where μ = E(Y), the dependent variable Y can be a variety of probability distributions, such as the normal distribution, Poisson distribution, gamma distribution, etc.; g is the link function, and the Poisson distribution function is usually used. In environmental health effects studies, the dependent variable yt is usually the daily count of an indicator in the population (e.g., number of daily morbidities), and the independent variable xj is usually an environmental factor (e.g., mean daily temperature, relative humidity, etc.) over the same period. The relationship between the independent variables xj and g is represented by fj (u). uk stands for the linear effect of other confounding factors such as seasonality or a long-term trend; βj and γk are the corresponding coefficients. ɑ is a constant term.
In this study, the daily reported incidence of pulmonary tuberculosis in Changde City for 12 years was used as the dependent variable y, meteorological and air pollutant factors were used as independent variables x, “week” and “holiday” variables were added to control for the weekend and holiday effects, and a distributed lag non-linear model was used to explore the lagged nonlinear effects of meteorological factors and air pollutants on the incidence of pulmonary tuberculosis. Because of the strong correlation between some meteorological factors and air pollutants, the Poisson function is used for the link function of the model to control the data overdispersion, and the variables with correlation coefficients greater than 0.7 [18] in the Spearman rank correlation analysis were excluded to prevent multicollinearity. Because the distributed lag non-linear model is often used to study the short-term distributed-lag effect of the independent variables, the maximum lag time was chosen to be 30 days based on the data characteristics of this study and previous studies [20], and the modified Akaike Bayesian Information Criterion (QAIC) [13] was used to determine the degree of freedom of each variable in the model.
Construction of DLNM: R 4.1.3. The statistical test level ɑ is taken as 0.05.
Results and Discussion
Basic Information
The distribution of pulmonary tuberculosis incidence by gender, age, and occupation in Changde from 2010 to 2021 is shown in Table 1. In Changde City, 61,018 new cases of tuberculosis were reported between 2010 and 2021; however, more male cases than female cases were recorded, with a total of 43,720 male cases making up 71.7% of the total number of cases and 17,298 female cases making up 28.3% of the total number of cases. The working age range of 16 to 59 years old had the highest annual incidence across all age groups, with a cumulative incidence of 53.6% of all cases. According to the type of occupation, the occupational group that accounted for the newest cases of tuberculosis in Changde from 2010-2021 was farmers (80.3%), followed by people waiting for employment (5.2%), and the occupational group that accounted for the least number of nursery governesses, with a total of 4 people.
Table 1.
Basic information on the number of pulmonary tuberculosis incidences in Changde City in 2010-2021.
Characterization of Meteorological Factors and Air Pollutants
Table 2 presents the fundamental characteristics of the eight meteorological parameters and six ambient air contaminants that were chosen for this investigation. In 2010-2021, the mean daily temperature in Changde City was 17.47ºC, the mean daily maximum temperature was 21.38ºC, the mean daily minimum temperature was 13.78ºC, the mean daily relative humidity was 74.83%, the mean daily precipitation was 4.19 mm, the mean daily pressure was 100.03 kpa, the mean daily wind speed was 2.37 m/s, and the mean daily sunshine hours were 3.67 h. The daily mean concentration of ambient air pollutants PM2.5 is 67.16 μg/m3, the daily mean PM10 is 92.81 μg/m3, the daily mean SO2 is 15.56 μg/ m3, the daily mean concentration of NO2 is 19.23 μg/m3, the daily mean concentration of CO is 0.71 mg/m3, and the daily maximum 8-hour mean O3 is 61.35 μg/m3. According to GB3095- 2012 Ambient Air Quality Standards, the above daily mean concentrations of ambient air pollutants did not exceed the 24-hour mean secondary concentration limits.
Correlation Analysis
Since the daily incidence of tuberculosis in Changde from 2010 to 2021 did not follow a normal distribution (K-S test value = 0.068, P = 0.000), the correlation between the daily incidence of tuberculosis and weather conditions and air pollutants during the same time was examined. The correlation coefficient matrix is displayed in Table 3. The frequency of daily cases of tuberculosis in Changde City between 2010 and 2021 was positively linked (P<0.05) with the mean air temperature, maximum air temperature, minimum air temperature, sunshine hours, PM2.5, PM10, and O3 levels. There was no statistically significant link (P>0.05) between mean wind speed and NO2, although there was a negative correlation (r = -0.119) with mean air pressure, precipitation, relative humidity, CO, and SO2. Strong correlations (|r|>0.7, p<0.05) were found between mean temperature and mean air pressure, maximum temperature, and minimum temperature, and between PM2.5 and PM10 for the same period.
Distributed lag Non-Linear Relationship between Meteorological Factors, Air Pollutants, and Pulmonary Tuberculosis Incidence
Distributed lag non-linear models are now widely used to analyze the relationship of exposure-response between meteorological factors, air pollutants, and infectious diseases. The correlation between the above meteorological factors and air pollution and the incidence of pulmonary tuberculosis was analyzed, and the absolute values of correlation coefficients between mean air temperature, maximum air temperature, minimum air temperature, and mean air pressure were all greater than 0.7, and the absolute values of correlation coefficients between PM2.5 and PM10 were greater than 0.7, suggesting strong multicollinearity between variables. According to the correlation size between each variable and the number of incidences, we chose to retain the mean temperature and PM10, and the maximum temperature, minimum temperature, mean air pressure, and PM2.5 were excluded. The final selection of mean temperature, sunshine hours, precipitation, relative humidity, PM10, O3, CO, and SO2 was included in the distributed lag non-linear models to analyze the relationship between exposure-response and PTB incidences. Taking the mean temperature as an example, the mean temperature is constructed as a cross-sectional basis function, the remaining variables (sunshine hours, precipitation, relative humidity, PM10, O3, CO, and SO2) are included as covariates, the “time” variable is included to control the temporal trend, the degrees of freedom is set to the usual (7~8)×12 years [21, 22], and the “week” variable (weekend = 0, midweek = 1) is included to control the period fluctuations. The “holiday” variable (holiday = 0, non-holiday = 1) controls the holiday effect, and the natural cubic spline is chosen as the penalty function. The median latency period for pulmonary tuberculosis can be up to 1.26 years [23]. Based on the data characteristics of this study and the purpose of the proposed exploration of the short-term lag effect of meteorological and air pollutants on pulmonary tuberculosis, and combined with previous studies, the maximum lag time was selected as 30 days. Finally, the degrees of freedom of each covariate and the time variable are selected according to the principle of minimum QAIC. The formula is as follows: log[E(yt)] = ɑ + β1cb.temp + ns(time, 7*12) + ns(pr, df = 3) + ns(rh, df = 3) + ns(sh, df = 3) + ns(PM10, df = 3) + ns(O3, df = 3) + ns(CO, df = 3) + ns(SO2,
Table 2.
Basic description of daily mean meteorological factors and air pollutants in Changde City, 2010-2021.
log[E(yt)] = ɑ + β1cb.temp + ns(time, 7*12) + ns(pr, df = 3) + ns(rh, df = 3) + ns(sh, df = 3) + ns(PM10, df = 3) + ns(O3, df = 3) + ns(CO, df = 3) + ns(SO2, df = 3) + as.factor(week) + as.factor(holiday)
yt: the actual number of PTB cases reported on day t; α:constant term; β1: coefficient; cb.temp:cross-basis of mean daily temperature and time; ns(): penalty function; df: degree of freedom; time: time variables to control for seasonal and long-term trends; pr: precipitation; rh: relative humidity; sh: sunshine hours.
Mean Temperature and Pulmonary Tuberculosis
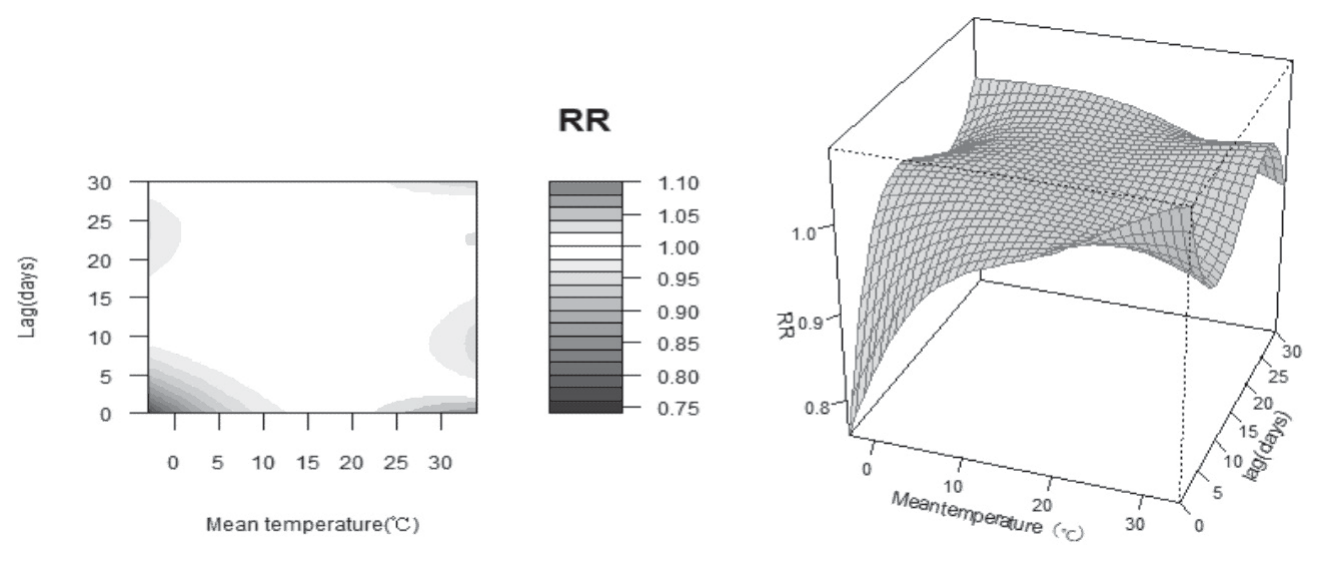
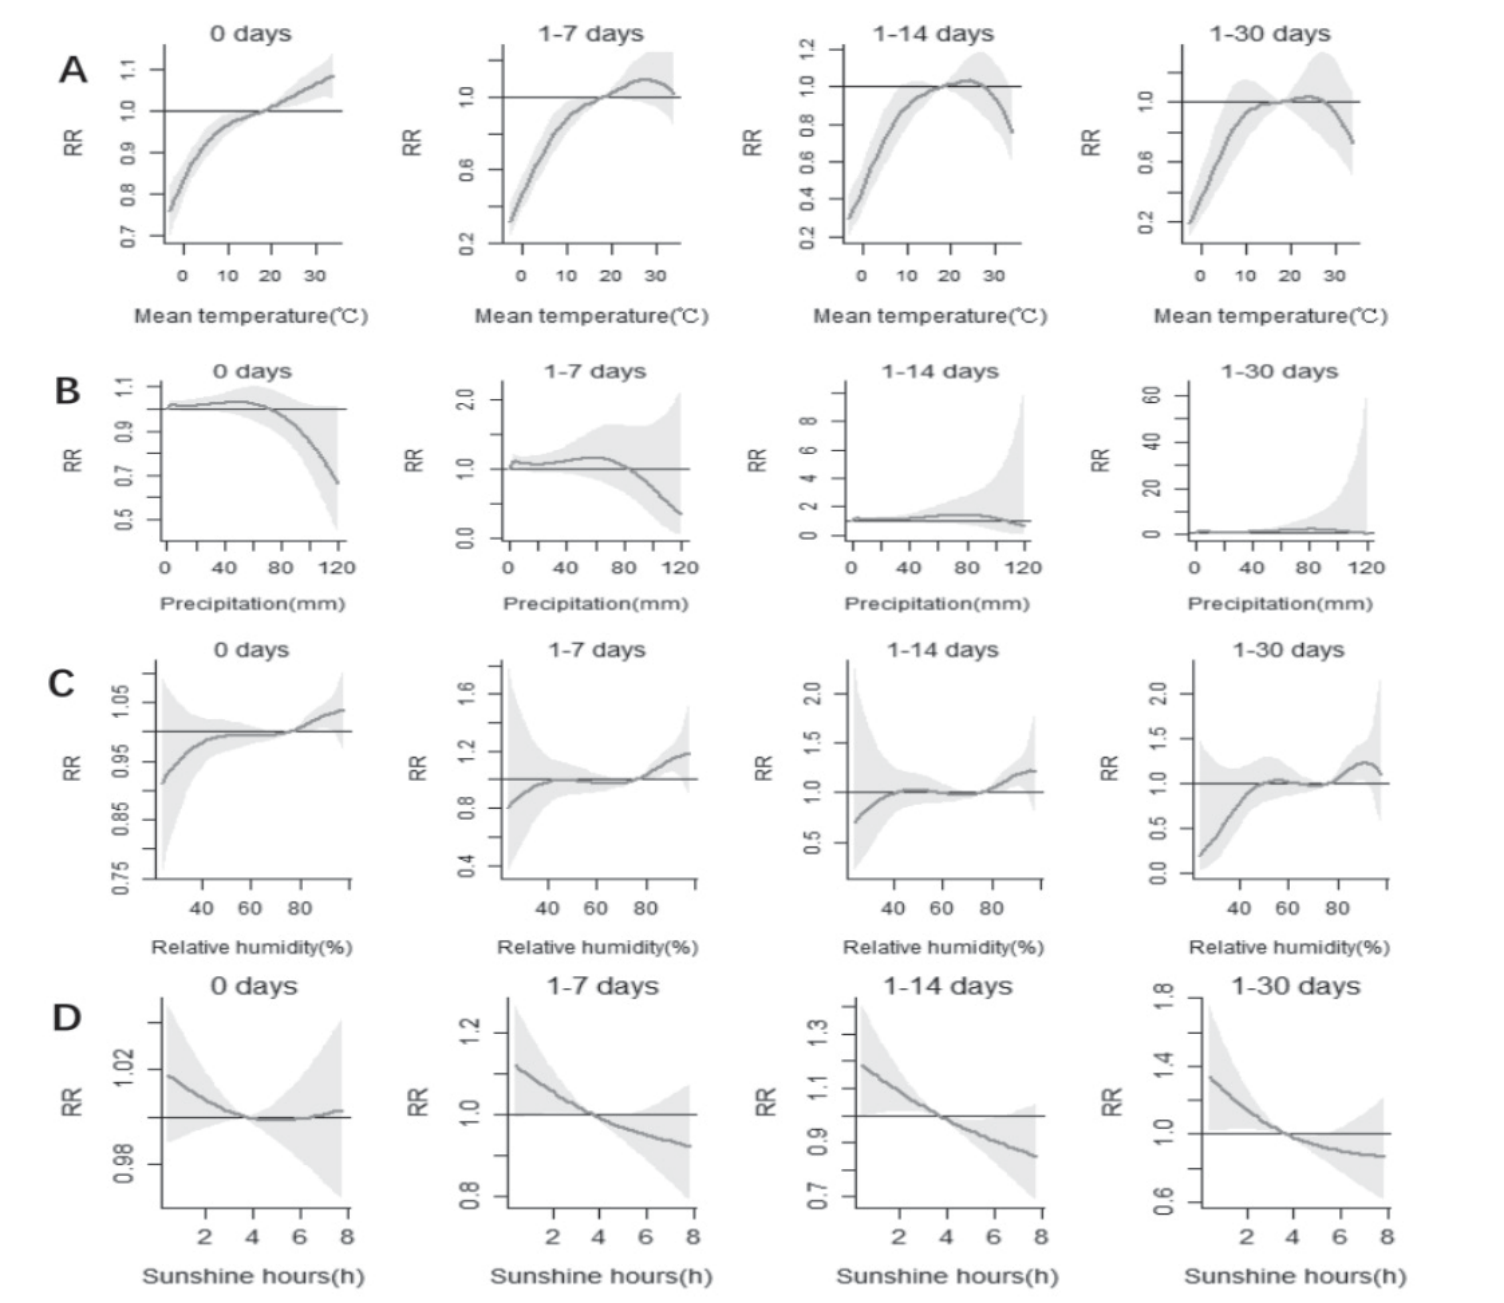
Fig. 1 shows the relationship between mean temperature and the risk of tuberculosis development at different lag times, using the median mean temperature (18ºC) as the reference value, divided into low and high-temperature segments. According to the results, on the lag of 0-30 days, the relative risk in the low-temperature period first increased and then decreased with the extension of the lag time, presenting an inverted “V” shape, but the RR values were all less than 1, suggesting that the risk effect of low temperature on the incidence of tuberculosis was not significant. With the lengthening of the lag time, the relative risk in the stage of high temperature displayed a wavy variation. The mean temperature and the pulmonary tuberculosis incidence had a roughly positive correlation during a lag of 0-5 days. The relative risk grew as the temperature rose, reaching its peak value at 34ºC with a lag of 0 days (RR: 1.083,95% CI: 1.027-1.142).
Fig. 5a) shows the cumulative effect of mean temperature with different lag times on PTB incidence, with a cumulative RR value for the red curve and a confidence interval for the gray-shaded portion. The graph shows that throughout the 0-day lag period, the cumulative risk of PTB incidence rises with rising temperature and reaches a maximum of 34ºC (RR: 1.083,95% CI: 1.027-1.142). The cumulative effect of temperature on the risk of pulmonary tuberculosis incidence increased with increasing lag time in the low-temperature segment, while it decreased in the high-temperature segment. The maximum RR value was reached at 34ºC and lag 3 days (RR: 1.164, 95% CI: 1.003-1.350), with no cumulative risk of tuberculosis incidence in the high-temperature segment after the 4th day of lag time statistically significant. The above results suggest that the mean daily temperature of 34 degrees Celsius can cause an 8.3% increase in pulmonary tuberculosis risk for the population on that day and a cumulative 16.4% increase in pulmonary tuberculosis risk for the population over 3 days.
Table 3.
Daily incidence of pulmonary tuberculosis and Spearman correlation coefficient matrix of meteorological factors and air pollutants.
Precipitation and Pulmonary Tuberculosis
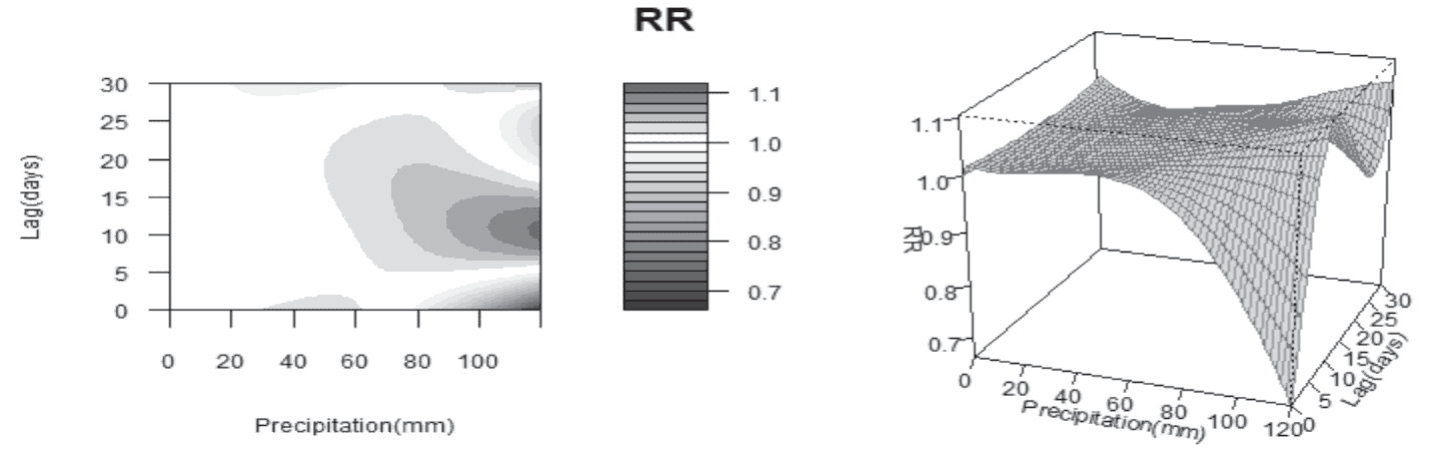
Using the median precipitation (0.00 mm) as a baseline, Fig. 2 depicts the association between precipitation and the risk of pulmonary tuberculosis at various lag times. According to the findings, during the short-term lag time of 0–5 days, the relative risk of pulmonary tuberculosis incidence showed a declining trend with increasing precipitation. Within a lag time of 5-20 days, the higher the precipitation, the higher the relative risk of pulmonary tuberculosis. When the precipitation was 120 mm, the maximum relative risk was found around 11 days after the precipitation (RR: 1.106, 95% CI: 0.897-1.365), but there was no statistical significance.
Fig. 5b) shows the cumulative effect of precipitation at different lag times on the relative risk of pulmonary tuberculosis incidence. As shown in the figure, the cumulative effect of 2-6 mm of precipitation on the incidence of tuberculosis occurred during the lag period of 1-30 days, after which the cumulative risk of pulmonary tuberculosis incidence was not statistically significant with increasing precipitation, and the cumulative risk of incidence was highest at 2 mm on the lag of 30 days (RR: 1.396, 95% CI: 1.140-1.709). According to the findings, precipitation of 2 mm has a cumulative risk for the incidence of pulmonary tuberculosis during a 30-day lag period but has no discernible influence on the incidence of the disease on the same day.
Relative Humidity and Pulmonary Tuberculosis
Fig. 3 shows the relationship between relative humidity and the risk of pulmonary tuberculosis incidence at different lag times, with the median relative humidity (76%) as the reference value divided into low and high humidity bands. It is evident from the graph that the low humidity segment has little impact on tuberculosis incidence, either as a variable dimension or the lagged dimension, while the high humidity segment increases pulmonary tuberculosis incidence with increasing humidity. From the contour plot, the humidity was only over 80%, demonstrating a risk effect on PTB incidence at a lag of 1 to 5 days, but as the lag period rose, this effect vanished. The relative risk was statistically significant and peaked at 90% relative humidity with a latency of 0 days (RR: 1.027, 95% CI: 1.008-1.048).
Fig. 3.
Contour and three-dimensional maps of the relative risk of pulmonary tuberculosis incidence with relative humidity and hysteresis.
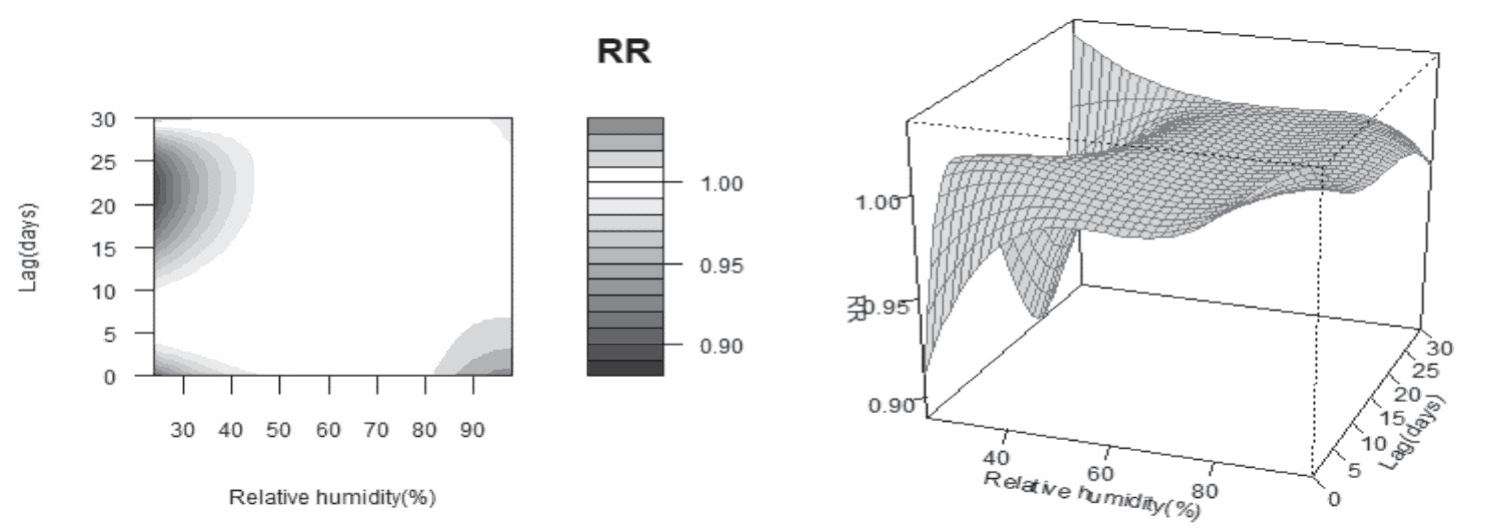
Fig. 4.
Contour and three-dimensional maps of the relative risk of pulmonary tuberculosis incidence with sunshine hours and lagged changes.
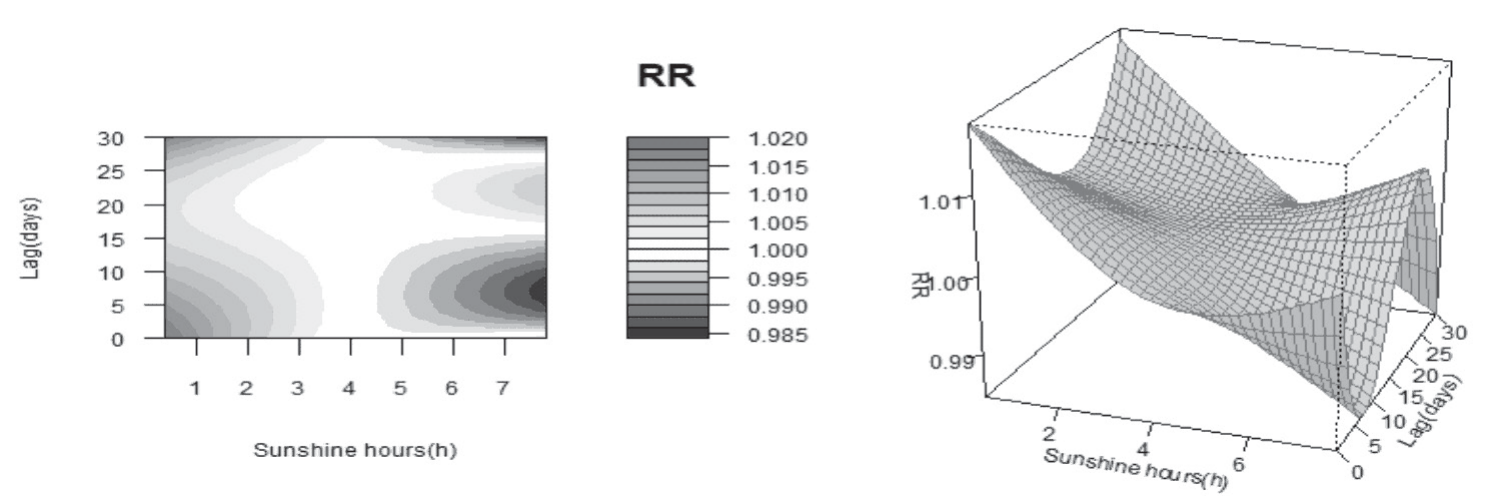
Fig. 5c) shows the cumulative effect of relative humidity over different lags on the relative risk of PTB incidence. As shown in the figure, with increasing lag time, none of the low relative humidity segments had a significant effect on the cumulative risk of PTB incidence, while the high humidity segments had an increased risk of PTB incidence with increasing humidity, and the risk effect lasted up to 30 days. On the lag of 22 days, the cumulative risk was highest at 90% relative humidity (RR: 1.223, 95% CI: 1.076- 1.391), which resulted in a cumulative increase in the probability of PTB incidence in the population of 22.3%. Notably, at relative humidity levels of more than 92%, none of the risk factors for the emergence of pulmonary tuberculosis were statistically significant.
Sunshine Hours and Pulmonary Tuberculosis
Fig. 4 shows the relationship between the number of sunshine hours with different lags and PTB incidence. The median number of sunshine hours (3.68 h) is used as a reference value and is divided into short and long days. As can be seen from the graph, the shorter the sunshine hours, the higher the risk of pulmonary tuberculosis incidence and the long sunshine hours period has no significant risk effect on pulmonary tuberculosis incidence. Short sunshine hours decreased and then increased the risk of PTB incidence in the lag dimension, revealing a “V”-shaped pattern, with the highest relative risk at 0.4 hours, lag 0 days (RR: 1.019, 95% CI: 0.989-1.049); however, it was not statistically significant. The risk of tuberculosis decreased, then increased, and finally decreased during the lag time of 0-30 days for the long sunshine hours period. The relative risk of PTB incidence decreased with increasing sunshine hours on the lag of 0-15 days and increased with increasing hours of sunlight on the lag of 15-25 days. The relative risk was highest at 7.8-h lag of 22 days (RR: 1.008, 95% CI: 0.992-1.024), which was also not statistically significant.
Fig. 5d) shows the cumulative effect of sunshine hours with different lag times on the relative risk of PTB incidence. As can be seen from the figure, the cumulative risk of PTB incidence decreases with increasing sunshine hours during the lag time of 0-30 days. On the lag 0 days, sunshine hours had no statistical significance on the risk of tuberculosis; that is, sunshine hours had no significant effect on the risk of tuberculosis on the day. The cumulative effect of short sunshine hours on the risk of PTB incidence within a 30-day lag time was statistically significant, and the cumulative risk of PTB incidence increased with increasing lag time, with the greatest risk at a 0.4 h lag of 30 days (RR: 1.364,95% CI: 1.031-1.804); i.e., the mean daily peak sunshine hours at 0.4 h caused a 30-day cumulative increase in the risk of PTB incidence in the population 36.4% cumulative increase in the risk of TB incidence in the population. Throughout the lag period, there was no significant effect of prolonged spells of sunshine on the chance of PTB incidence.
PM10 and Pulmonary Tuberculosis
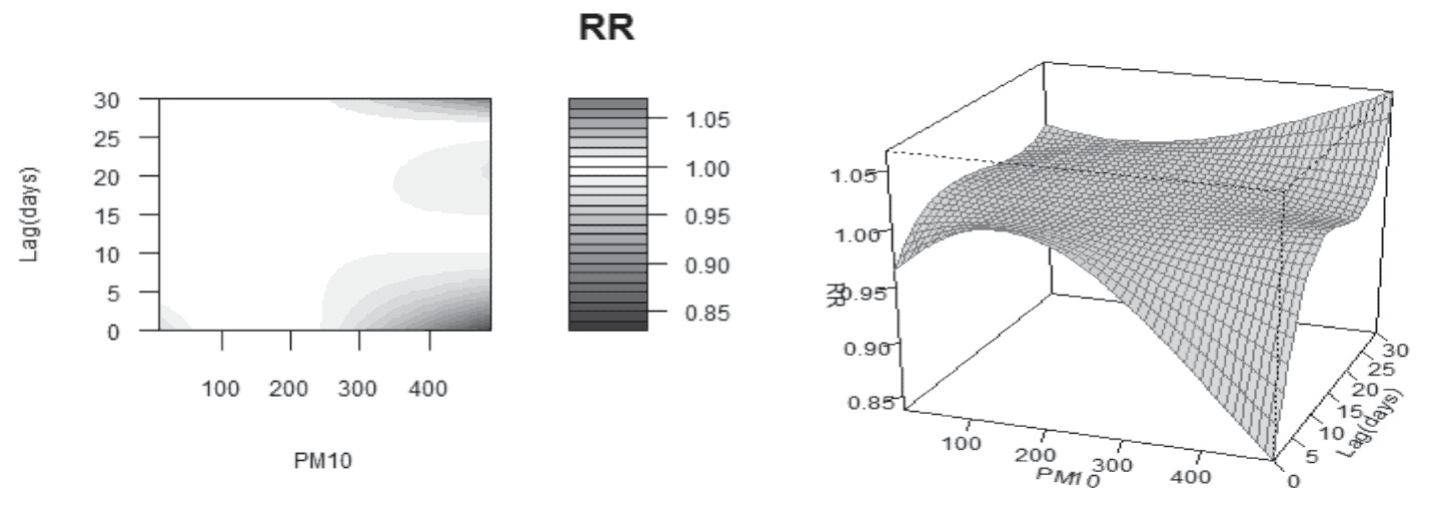
To evaluate the impact of each air pollutant, we utilize the median of each air pollutant as a reference value to evaluate the impact of high and low concentrations. The median can be used to depict a concentrated tendency in a group of skewed distribution data. In Fig. 6, the connection between PM10 and the risk of PTB incidence at various lag times is depicted using the median PM10 concentration (84.41 μg/m3) as the reference value. As can be seen from the figure, the risk of PTB incidence decreases as the concentration of PM10 increases, and the concentration bands below the median do not show any effect on PTB incidence during the 0-30 day lag period. Concentrations above 300 μg/m3 show a high-risk effect after a lag of 26 days, and the higher the concentration, the greater the relative risk, with the RR being greatest at PM10 of 490 μg/m3 on the lag of 30 days (RR: 1.066, 95% CI: 0.888,1.279), but this was not statistically significant.
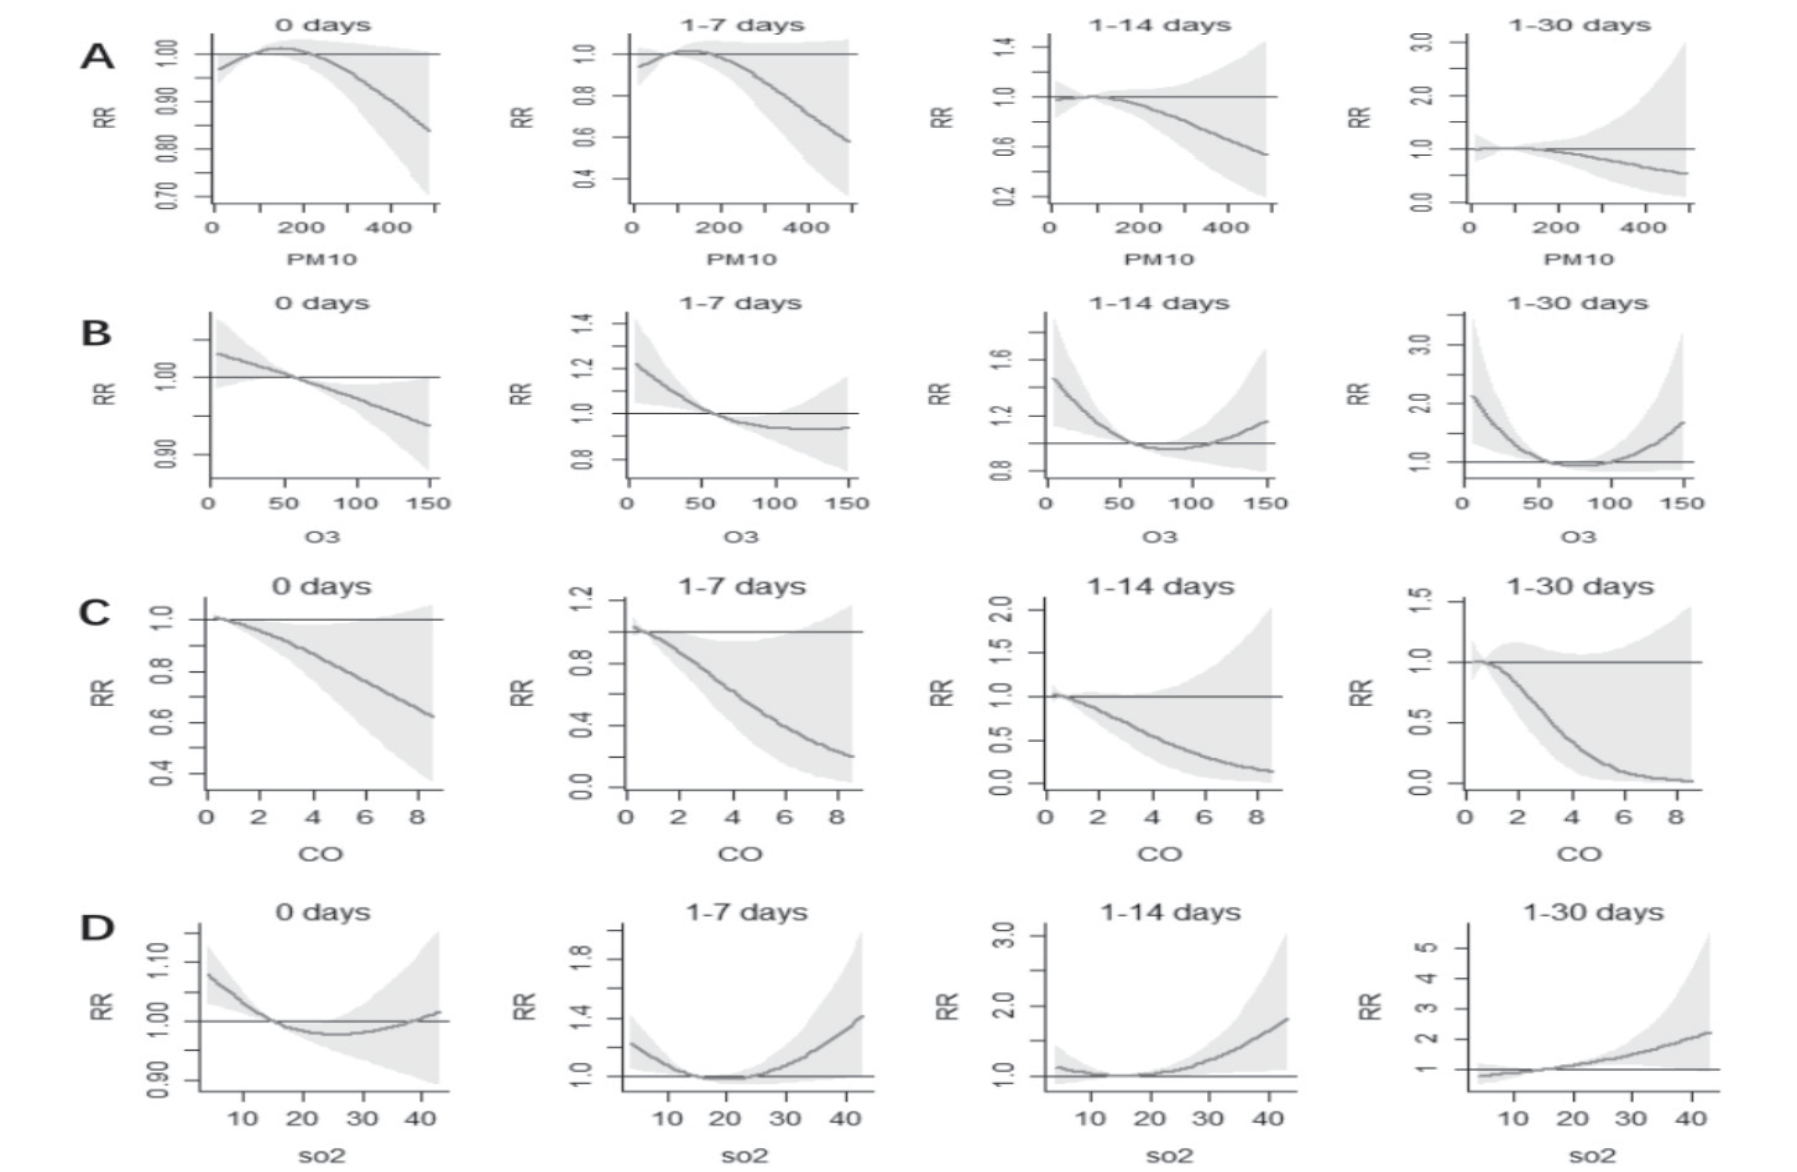
Fig. 10a) shows the cumulative effect of PM10 on the relative risk of PTB incidence at different lag times. The graph demonstrates that only during the 0-day lag period was the low concentration band’s impact on the PTB incidence statistically significant in comparison to the median concentration. For each of the remaining concentrations at a lag time of 1-30 days, the effect of PM10 on the cumulative risk of PTB incidence was not statistically significant, indicating that there was no significant cumulative effect of PM10 on PTB incidence across the whole lag period.
O3 and Pulmonary Tuberculosis
Using a median daily maximum mean concentration of O3 (58.46 μg/m3) over 8 hours as a reference value, divided into high and low concentrations, Fig. 7 shows the relationship between O3 with different lag times and the risk of PTB incidence. As can be seen from the figure, the relative risk of PTB incidence declined with increasing O3 concentration over the lag period of 0-5 days, peaking at 5 μg/m3 and lag 0 days (RR: 1.031, 95% CI: 0.986-1.078); however, this relative risk was not statistically significant. The risk of disease in low-concentration zones decreases with increasing lag time, while in high-concentration zones the risk is distributed in an “N” type distribution with increasing lag time, with the relative risk peaking at 150 μg/m3 on the lag of 13 days (RR: 1.034, 95% CI: 1.005-1.064).
Fig. 10b) shows the cumulative effect of different lag times of O3 on the relative risk of PTB incidence. In the figure, it is depicted that there was no significant risk effect of O3 concentration on the incidence of tuberculosis during the lag time of 0 days, but that there was a significant cumulative risk of O3 on the incidence of tuberculosis in the low concentration section during the lag time of 1 to 30 days. The cumulative relative risk increased as the lag time was prolonged, peaking at 5 μg/m3 on the lag of 30 days (RR: 2.206, 95% CI: 1.350-3.604). During the 30-day lag period, the cumulative risk of PTB incidence in the high-concentration zones of O3 increased with increasing concentration, and the longer the lag time, the higher the cumulative risk, but none of them was statistically significant. The above results suggest that, in comparison to the median concentration (58.46 μg/m3), a daily maximum 8-hour mean concentration of O3 of 150 μg/m3 would result in a 3.4% increase in the population’s risk of contracting tuberculosis on the lag of 13 days, while a concentration of 5 μg/m3 would result in a cumulative increase of 120.6% at 30 days.
CO and Pulmonary Tuberculosis
Using the median 24-hour mean concentration of CO (0.65 mg/m3) as a reference value and dividing the high and low concentration zones, Fig. 8 shows the relationship between CO and PTB incidence over time. As can be seen from the figure, CO in the low-concentration group has no significant effect on the incidence of pulmonary tuberculosis within the lag time of 0-30 days. In the high-concentration zones, the relative risk of pulmonary tuberculosis decreased with the increase in CO concentration, presenting an inverted “V” shape in the dimension of lag time. However, neither the variable dimension nor the lag dimension indicated that CO had a large risk effect on the incidence of PTB relative to the median concentration.
Fig. 7.
Contour and three-dimensional maps of the relative risk of tuberculosis development with O3 and lagged changes.
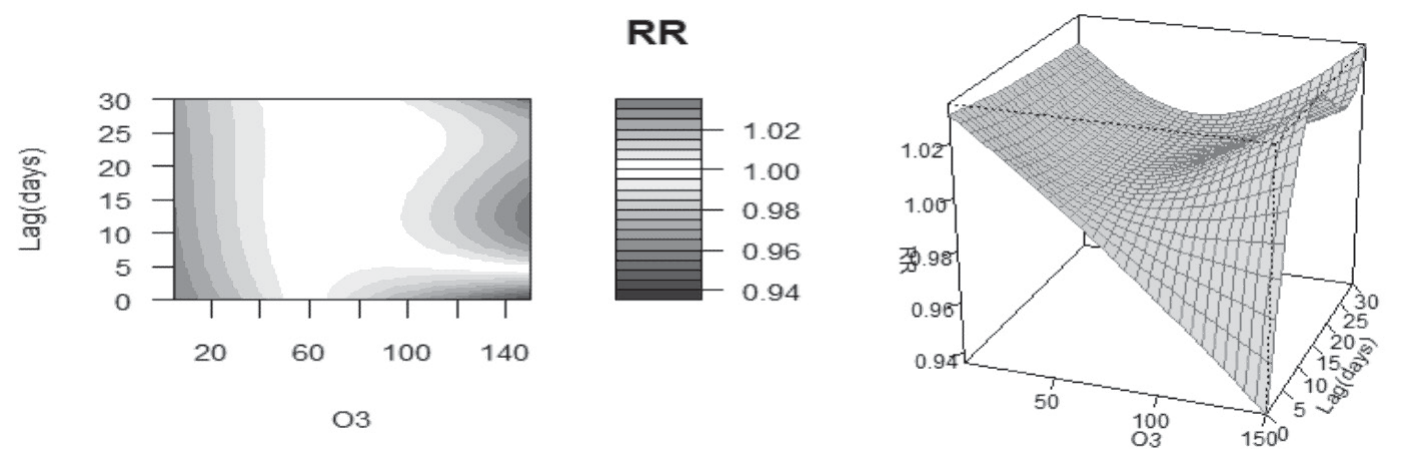
Fig. 8.
Contour and three-dimensional maps of the relative risk of pulmonary tuberculosis incidence with CO and lagged changes.
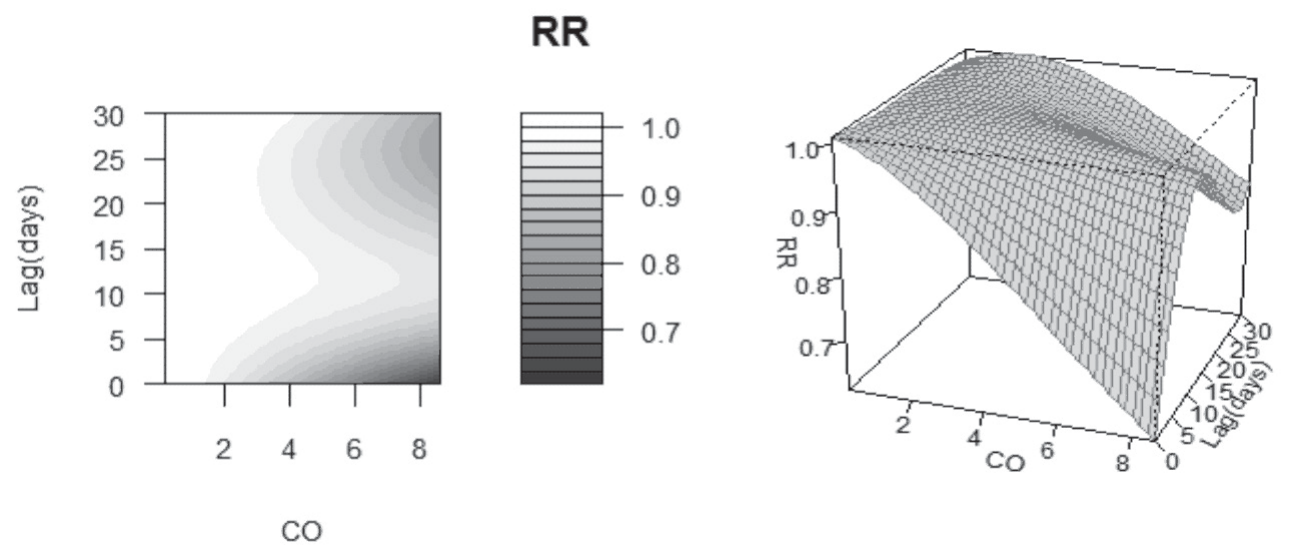
Fig. 10c) shows the cumulative effect of different lag times of CO on the relative risk of PTB incidence. As shown in the figure, there was no significant cumulative effect on TB incidence throughout the lag period in the low-concentration zones, while in the high-concentration zones, the cumulative relative risk of PTB decreased as the lag time increased and the concentration of CO increased. All the above suggests that CO has no single risk effect or cumulative risk for PTB incidence during a 30-day lag period.
SO2 and Pulmonary Tuberculosis
The median 24-hour mean concentration of SO2 (15.17 μg/m3) was used as the reference value and then divided into low-concentration and high-concentration zones according to this reference value. Fig. 9 shows the relationship between SO2 and the risk of PTB incidence at different lag times. As can be seen from the figure, low concentrations of SO2 present a high-risk effect on PTB incidence, and the relative risk decreases as the concentration increases. From the dimension of lag time, the risk of morbidity decreases with increasing lag time in the low-concentration zones. The risk of incidence was greatest on the lag 0 days at 4 μg/m3 (RR: 1.079, 95% CI: 1.032-1.129), that is, a 24-hour mean SO2 concentration of 4 μg/m3 could cause a 7.9% increase in the risk of PTB incidence in the population on that day. In the high concentration zones, the risk of morbidity was wavy with increasing lag time, with the greatest risk of morbidity on the lag 30 days at 43 μg/m3 (RR: 1.113, 95% CI: 0.975-1.270), but was not statistically significant.
Fig. 10d) shows the cumulative effect of SO2 at different lag times on the relative risk of PTB incidence. As shown in the figure, the cumulative effect of the low-concentration zones on the risk of PTB incidence during the 7-day lag period decreased with increasing concentration, and thereafter, the cumulative risk of incidence was not statistically significant with increasing lag time. The cumulative relative risk was greatest at 4 μg/m3 with a 7-day lag (RR: 1.321, 95% CI: 1.095-1.593), i.e., a 24-hour mean SO2 concentration of 4 μg/m3 caused a 32.1% cumulative increase in the risk of TB incidence in the 7-day population. The cumulative relative risk was greatest at 4 μg/m3 with a 7-day lag (RR: 1.321, 95% CI: 1.095-1.593), that is, a 24-hour mean SO2 concentration of 4 μg/m3 caused a 32.1% cumulative increase in the risk of PTB incidence in the population. In the high-concentration zones, the cumulative risk of PTB incidence increased with increasing concentration at a 7-day lag time, but the result was not statistically significant. Thereafter, the cumulative relative risk of morbidity increases with increasing concentrations as the lag time increases. The relative risk was greatest at 43 μg/m3 with a lag time of 0 days 16 days (RR: 1.864, 95% CI: 1.045-3.327), i.e., a 24-hour mean SO2 concentration of 43 μg/m3 could cause an 86.4% cumulative increase in the risk of PTB incidence in the population.
Meteorological factors and air pollutants have been considered by researchers when exploring the exogenous factors affecting the development of infectious diseases. To analyze the relationship between eight meteorological factors, six air pollutants and the incidence of pulmonary tuberculosis, correlation analysis was used in this study. A distributed lag non-linear model was then used to further evaluate the impacts. Spearman’s rank correlation analysis showed that the daily incidence of pulmonary tuberculosis was positively correlated with daily mean temperature, maximum air temperature, minimum air temperature, sunshine hours, mean daily PM2.5 concentration, mean daily PM10 concentration, and mean daily 8-hour O3 concentration, and negatively correlated with mean daily air pressure, precipitation, relative humidity, mean daily CO concentration, and mean daily SO2 concentration. This varies compared to the results of studies in different regions. For instance, a study conducted in Lanzhou City by Li Jinjuan [24] found that the daily incidence of pulmonary tuberculosis was positively correlated with the mean daily air pressure and negatively correlated with the mean daily temperature and precipitation. A study by Liang Da [25] in Qinghai province found a positive correlation between precipitation and relative humidity and PTB incidence and a negative correlation between air pressure, air temperature, and sunshine hours and PTB incidence. There are differences in the degree of adaptation and responsiveness of people to the weather and air quality in their regions, as well as differences in the climatic conditions of their respective regions, due to the vastness of China, which may explain the differences in the magnitude and direction of the effects of meteorological factors and air pollutants on the development of tuberculosis in different regions.
Fig. 9.
Contour and three-dimensional maps of relative risk of SO2 and hysteresis changes in the incidence of pulmonary tuberculosis.
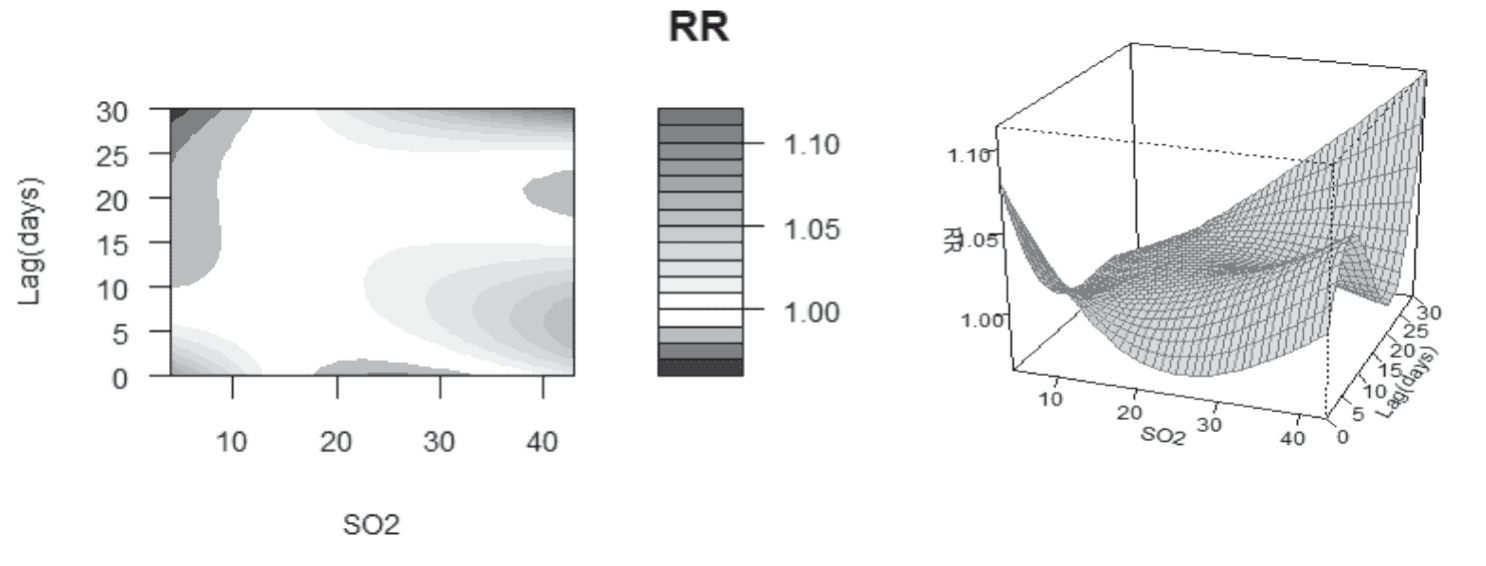
Fig. 10.
Cumulative effect of air pollutants at different lag times on the relative risk of tuberculosis development. a: PM10, b: O3, c: CO, d: SO2.
The results of the distributed lag non-linear models showed that meteorological factor: the risk of pulmonary tuberculosis incidence was highest when the mean daily temperature was 34ºC and the lag was 0 days, the relative humidity was 90%, and the lag time was 0 days. The cumulative effect on PTB incidence was highest when the mean daily temperature was 34ºC and lag of 3 days, the precipitation was 2 mm and lag of 30 days, the relative humidity was 90% and lag of 22 days, and the sunshine hours were 0.4 h and lag of 30 days. This is similar to the findings of Jiayuguan [26], Urumqi [27], and Hong Kong [28]. Higher temperatures may be associated with long sunshine hours. A systematic review shows that high temperatures are usually associated with high airflow. Under comfortable temperature conditions, people are more willing to go outdoors and thus more likely to meet pathogens, providing a favorable environment for the spread of tuberculosis, while the pathogens are more active in spreading and replicating at higher temperatures [29]. Droplet nuclei containing pathogens can float and stay in the air for a long time when the relative humidity is high, and prolonged high humidity makes it easier for pathogens to spread, thus increasing the risk of developing tuberculosis. Air pollutants: The risk of PTB incidence was highest when the concentration of O3 was 50 μg/mm3 on the lag of 13 days and the concentration of SO2 was 4 μg/mm3 on the lag of 0 days. The cumulative effect of PTB incidence was highest when the concentration of O3 was 5 μg/mm3 with a lag of time of 30 days and SO2 was 43 μg/mm3 with a lag of time of 16 days. The results were similar to those in Hefei [30], Wuhan [31], Chengdu [32], and Fuyang [33]. Previous studies have also shown that chronic exposure to air pollution leads to an increase in the number of pulmonary tuberculosis cases [34, 35]. Because SO2 is very soluble in water, breathing it in can easily harm the upper respiratory tract’s mucosa. Additionally, if there are particles dispersed in the air, the substance may adhere to the surface of the particles and enter the deep respiratory tract. O3 can induce airway inflammation, impair lung function, and affect pulmonary ventilation [36], and damage to both the respiratory tract and lungs from these pollutants may contribute to the invasion of Mycobacterium tuberculosis into the body. It is worth mentioning that the present study has not found a distributed lag effect of PM10 on the incidence of pulmonary tuberculosis, which is different from the results in Shijiazhuang [37]. Although it has been suggested that PM10 is associated with tuberculosis of the sputum culture-positive and that the severity of pulmonary lesions increases with increasing PM10 levels [38], this study did not yield similar results. The possible reasons for this are the differences in the level of factors and data dimensions between the different regions studied and the geographic, environmental, and human differences between the regions that may cause the environmental health effects to vary between regions. PM2.5 and PM10, as solid particulate matter, can alter key components of the immune reaction of the Mycobacterium host [39], inhibit the natural defense barrier of the respiratory tract, cause oxidative stress in lung cells, and increase the pro-inflammatory response [40], thus reducing the immunity of the organism to Mycobacterium tuberculosis. This is its pathological effect on humans, but the epidemiological effect on the population may be regionally heterogeneous and depends on multicenter and multidimensional investigation studies. In summary, the results of this study show that meteorology and air pollutants have certain effects on the incidence of pulmonary tuberculosis, and the impact will also have a lag effect, suggesting that the relevant departments can issue early warnings based on meteorological changes and air quality monitoring, timely control of environmental pollution, and improve the protection awareness of residents. Distributed lag nonlinear models usually rely on the estimation of parameters, and there are uncertainties in the process of parameter estimation, which may come from the randomness of samples, the choice of model structure, and the error of parameter estimation methods [41]. When establishing a distributed hysteresis nonlinear model, it is usually necessary to choose the structure of the model, such as determining the hysteresis order and the form of the nonlinear function [42]. Different model structure choices may lead to different model results, thus introducing uncertainty. The uncertainty of prediction results may be caused by model error, data noise, and the randomness of future development [43, 44].
The study still has some limitations. First, the number of daily notifications of pulmonary tuberculosis is reported and consolidated by the designated institutions through the network, which may lead to late reporting and missing insurance coverage of tuberculosis cases, which will affect the accuracy of the study to a certain extent. Second, because the onset date of cases is inferred by clinicians based on the information provided by patients, this study used the date of diagnosis rather than the onset date to calculate the number of cases.
Conclusions
The daily incidence of tuberculosis was positively correlated with daily mean air temperature, maximum air temperature, minimum air temperature, sunshine duration, PM2.5, PM10, and O3, and negatively correlated with daily mean air pressure, relative humidity, precipitation, CO, and SO2, but not significantly correlated with mean wind speed and NO2. The daily mean temperature, relative humidity, precipitation, sunshine hours, O3, and SO2 had distributed lag nonlinear effects on the daily incidence of pulmonary tuberculosis. The parameters of the distributed hysteresis nonlinear model have some uncertainties.

