

Introduction
Human survival and development are intricately linked to the ecological environment and directly impact the sustainable development of local economies and societies [1]. However, in recent years, rapid urbanization in China has resulted in a series of ecological and environmental issues, significantly constraining regional sustainability [2]. Therefore, the objective and timely monitoring and assessment of the quality of the ecological environment and its dynamic changes are important for achieving the cogovernance and sustainable development of regional ecological environments [3, 4]. With the rapid development of Earth observation technologies, satellite remote sensing technology, characterized by its high timeliness, rapid acquisition cycle, and periodic, repetitive observation advantages, has become a mainstream and effective research tool in regional ecological studies [5]. Various remote sensing indices/indicators, such as the impervious surface ratio, land surface temperature, and vegetation index, have been widely applied in the monitoring and quantitative evaluation of ecosystems and various environments, such as cities [6, 7], forests [8, 9], grasslands [10, 11], and wetlands [12]. However, for complex ecosystems, especially urban‒rural composite ecosystems, it is challenging to measure and quantify ecological quality using a single ecological index/indicator that reflects only one aspect of the ecosystem [13].
In this regard, Xu [13] proposed the remote sensing-based ecological index (RSEI). Based on principal component analysis (PCA), the RSEI using the first principal component of four factors, namely, greenness, wetness, dryness, and heat, is a comprehensive indicator reflecting ecological quality. The RSEI facilitates the quantitative assessment of ecological quality changes at a regional scale. The main advantage of this method is that the four factors share the same remote sensing data source, thereby avoiding changes or errors in weight definition due to individual characteristics [14]. However, with the widespread application of the RSEI model, some issues have gradually emerged, and an opposing model was developed from the original model. Some scholars have calculated the RSEI based on the original model, while others directly use PC1 as the regional ecological quality index instead of “1-PC1”, which is mainly attributed to the uncertainty in the direction of feature vectors in PCA; in this case, the model yields different results, making it challenging to adapt to long-term sequences and batch operations when using large-scale remote sensing data [15]. Scholars [15, 16] have improved the RSEI model, and modifications have been tailored for different users; these improved RSEI models can support long-term, objective, and comprehensive evaluations of regional ecological quality.
The GEE (Google Earth Engine) is a cloud computing platform that efficiently stores a vast repository of historical images and geographic databases [17]. This platform facilitates the rapid batch processing of remote-sensing images and other large datasets. Furthermore, given the immense computational capabilities of GEE, it is well-suited for analyzing and addressing various environmental and societal issues [18]. In comparison to traditional remote sensing methods, the GEE platform offers a wealth of remote sensing images and streamlines operational procedures. GEE data are well suited for calculating large-scale, long-term remote sensing-based ecological indices (RSEIs) and performing ecological quality assessments.
Previous studies provided essential tools and methods for monitoring and evaluating the ecological environment, offering profound insights into the pressures imposed on the environment by human activities, ecological variations, and climate change. Chengdu, the capital of Sichuan Province and the largest city in western China, has undergone rapid development due to its advantageous geographical location. Such development includes the expansion of urban areas, an upsurge in motor vehicles, and accelerated industrial production. As a pioneer of urbanization in Midwest China, Chengdu has experienced rapid economic growth, attracting a substantial population from various regions and resulting in consistent increases in total population and land use [19]. However, persistent resource consumption has led to concerns regarding future sustainable development amid prominent urbanization. Socioeconomic factors, such as population growth, policy guidance, and economic development, act as the primary driving forces leading to the depletion of ecological assets in Chengdu. The rapid development of Chengdu has simultaneously placed significant pressure on its ecological environment. Therefore, monitoring spatiotemporal changes in the ecological environment is necessary to provide a scientific foundation for decision-making regarding future sustainable development [20].
Considering these concerns, this study outlines three main objectives:
1) Construct an improved RSEI by integrating various remote sensing indicators based on the Google Earth Engine (GEE) platform;
2) Monitor the spatiotemporal changes in the quality of the ecological environment of Chengdu from 2013 to 2022;
3) Explore the spatial differentiation characteristics of the quality of the ecological environment in Chengdu and its future development trends. This research introduces a practical and cost-effective approach for assessing spatiotemporal changes in eco-environmental quality by leveraging the RSEI and GEE.
Materials and Methods
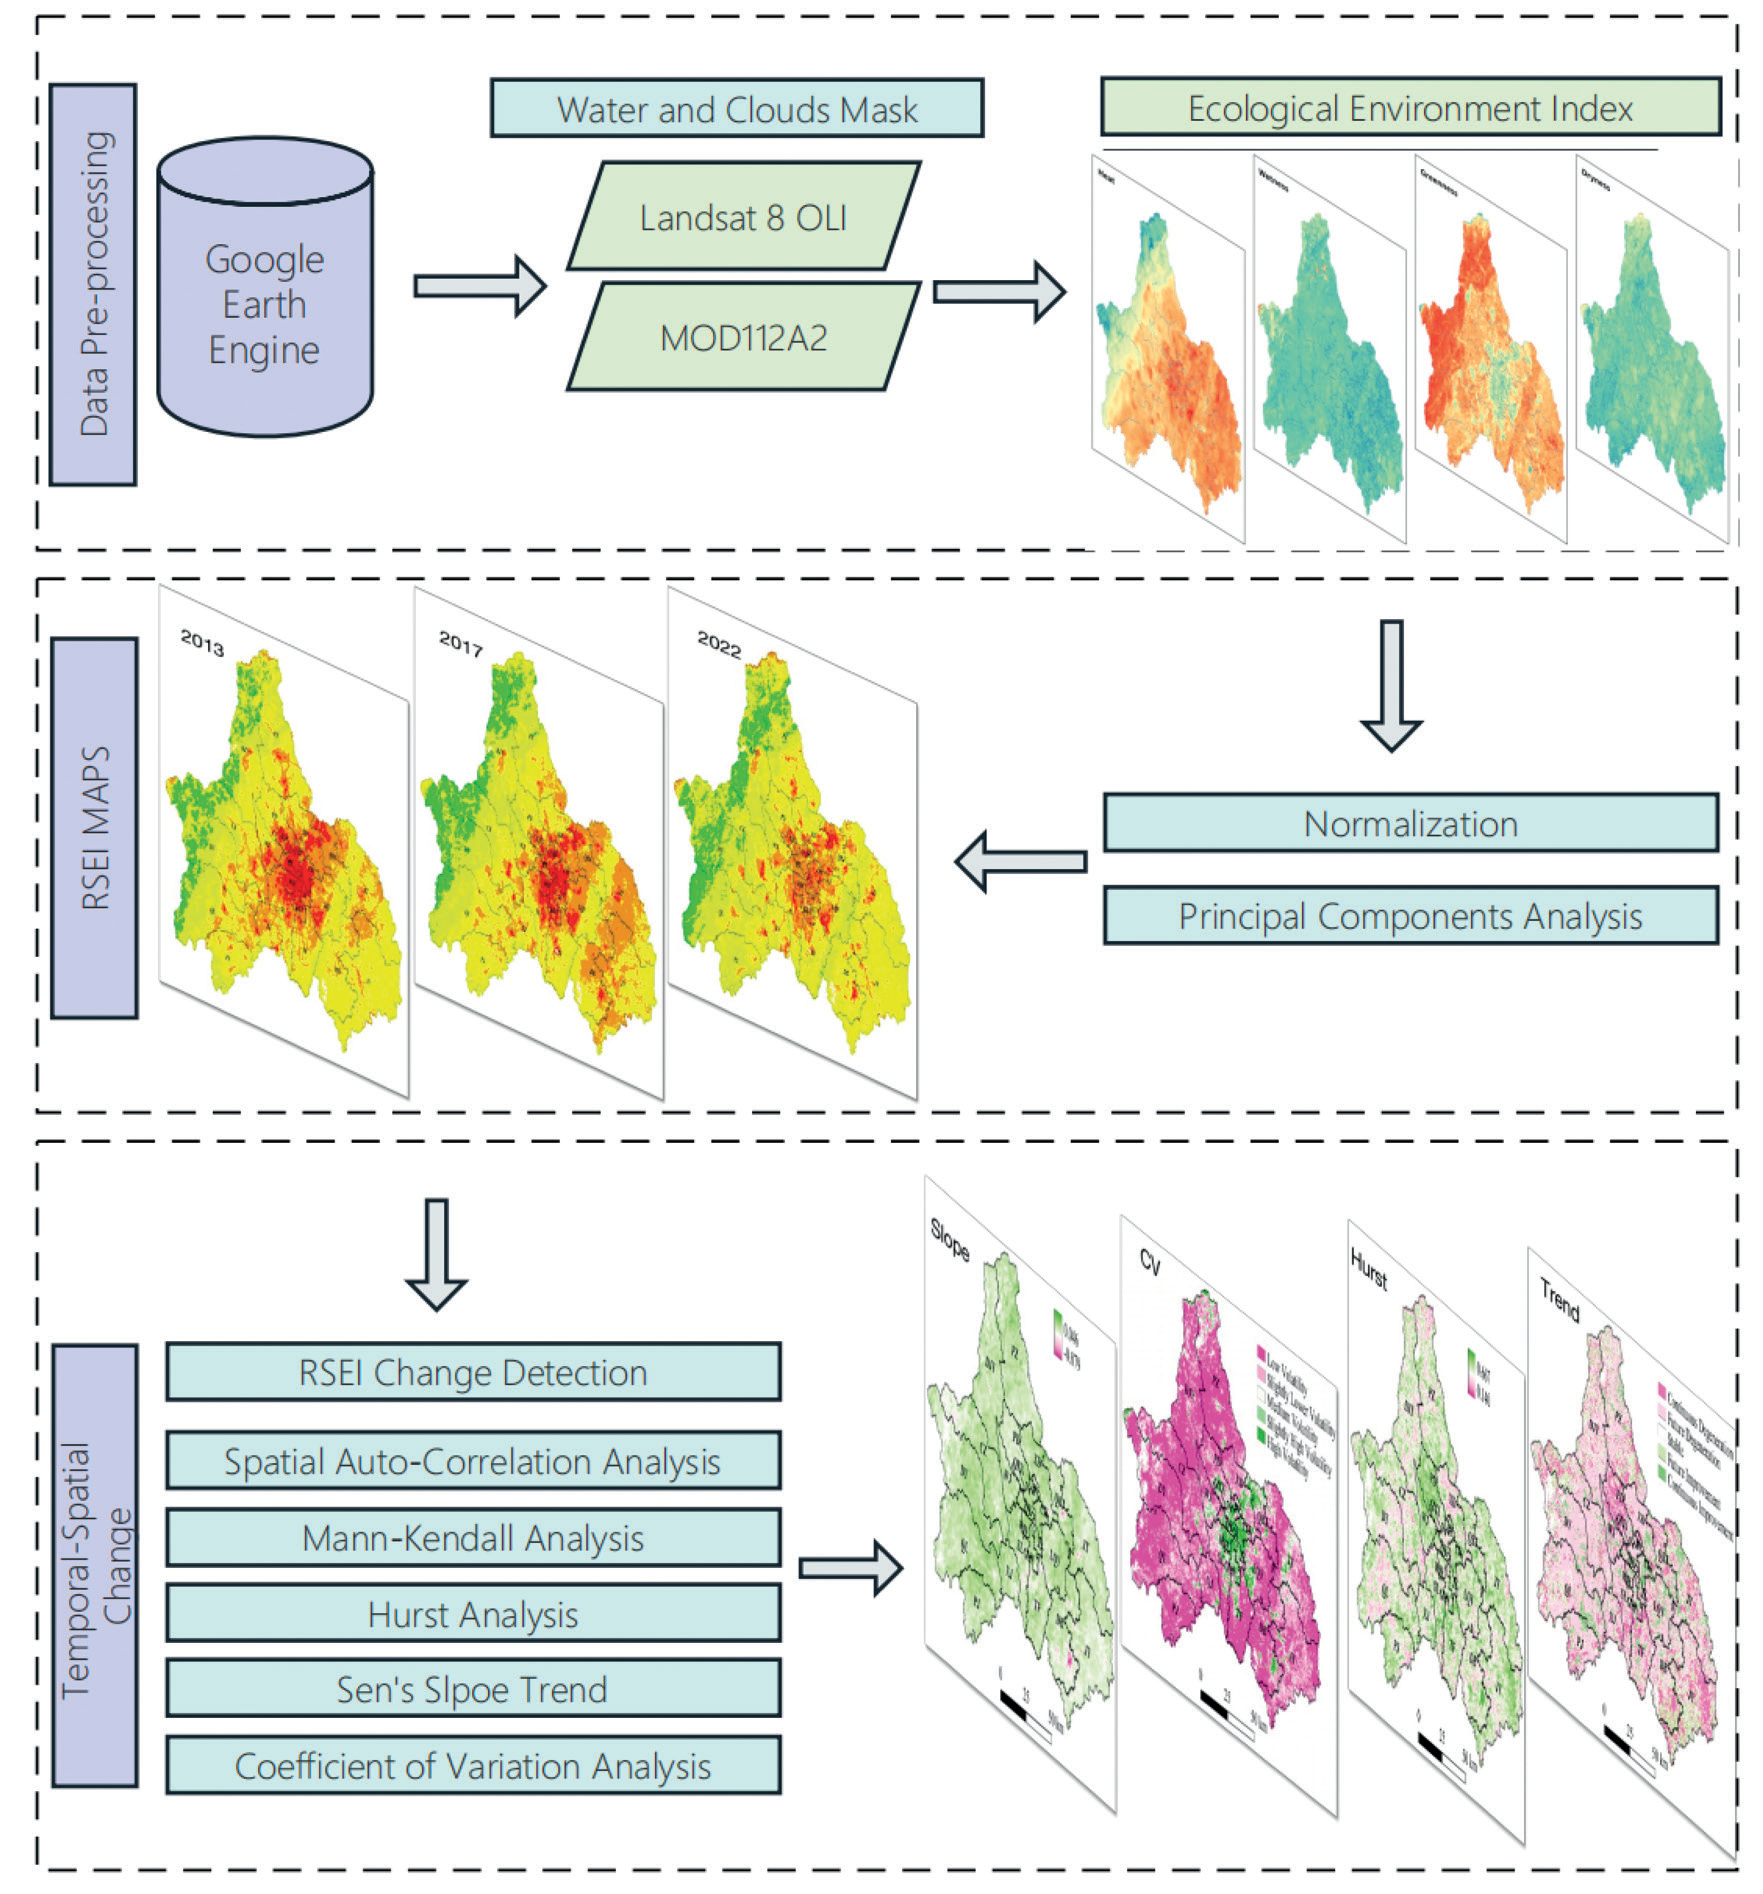
The technical workflow of this study comprises three main parts (Fig. 1). In the first part, four basic ecological evaluation indicators from the GEE platform are established. The second part focuses on index selection, normalization, data reconstruction, and PCA, and RSEI maps from 2013 to 2022 are constructed. The third part focuses on assessing the quality of the ecological environment by employing a transition matrix to evaluate the ecological dynamics in the study area from 2013 to 2022. In the first part, the selection of suitable ecological indices is critical for capturing the key environmental variables that influence the ecological environment. Indices such as vegetation greenness, surface temperature, humidity, and dryness provide valuable information for assessing the overall ecological conditions. Subsequently, PCA is employed to extract the essential information from multidimensional data and construct the RSEI, which integrates multiple ecological indicators into a comprehensive index for evaluating the ecological environment. Next, ecological quality assessment is performed based on the transition matrix approach. This approach allows for quantifying and characterizing changes in ecological conditions over time. Specifically, comparing the RSEI maps for different years allows for the identification of spatial and temporal variations in the quality of the ecological environment of Chengdu. The transition matrix quantitatively represents shifts in ecological states, indicating whether the ecological environment has deteriorated, improved, or remained stable over the study period. Finally, the future RSEI trend in Chengdu is evaluated.
Study Area
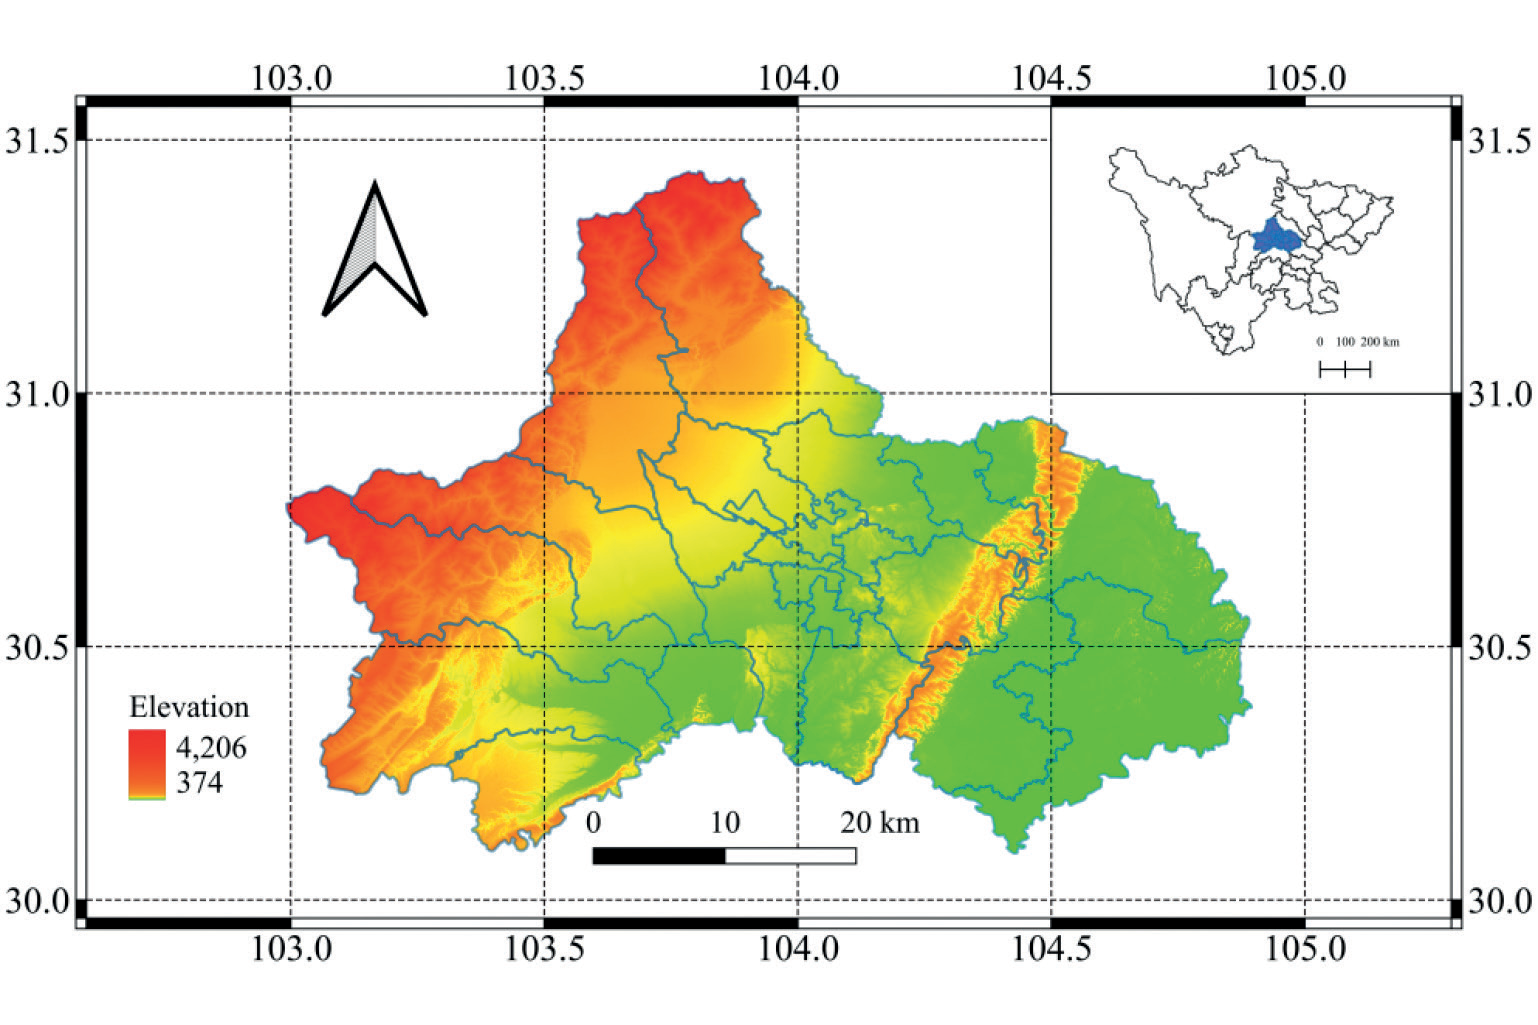
Chengdu city (102.540–104.530°E, 30.050–31.260°N; approximately 14,335 km2), located in the Sichuan Basin, is the largest city in western China. Chengdu is characterized by a pleasant climate, an advantageous geographical position, and a rich cultural history. It serves as the center of politics, culture, business, and external exchanges in Sichuan Province (Fig. 2). The terrain is low in the center of the basin and high in the surrounding areas. Chengdu covers a built-up area of 2,176 km2. It occupies the western part of the Sichuan Basin, which is surrounded by the Tibetan Plateau to the west, the Yunnan-Kweichou Plateau to the south, and the Qin Mountain range to the north. Chengdu is relatively isolated from external influences due to its topography. Chengdu has a subtropical monsoon climate characterized by frequent calm winds, with mean annual precipitation ranging from 798.3 to 1541.0 mm and a mean annual temperature of 16°C [19].
With contemporary globalization, Chengdu is emerging as a global city recognized by the Globalization and World Cities Research Network. In the wake of the 19th National Congress of the Communist Party of China (CPC), Chengdu’s government has unveiled a visionary roadmap for its future development, known as the Three-Step Strategy (TSS). The first phase, spanning from 2016 to 2020, is dedicated to achieving the national goal of establishing a prosperous society with high standards. During the second phase, from 2020 to 2035, Chengdu is committed to transforming into a livable and high-quality city, serving as an international gateway within urban China. During the third phase, spanning from 2035 to 2050, Chengdu will focus on sustainable pathways, aspiring to become a modern and competitive global city. This journey involves addressing challenges related to natural conditions, population dynamics, and industrial structures, all within the framework of the new strategic vision [21].
Data Sources and Preprocessing
The RSEI integrates four key indices: the normalized difference vegetation index (NDVI) [22], wetness (tasseled capacity wetness index, WET) [23], heat (land surface temperature, LST) [24], and dryness (normalized difference bare soil index, NDBSI) [25]. Three indices, the NDVI, WET, and NDBSI, are calculated using Landsat 8/OLI data provided by the U.S. Geological Survey (USGS) (https://www.usgs.gov). The LST is calculated using data from the Moderate Resolution Imaging Spectroradiometer (MODIS, MOD11A2), a primary sensor on the Terra and Aqua satellites (https://developers.google.com/earth-engine/datasets). On the GEE platform, the Landsat cloud mask algorithm is utilized to remove cloud pixels from the input image dataset based on the specified period and spatial range. The minimum cloud cover image is then synthesized using the median value of the cloud-free pixels. Additionally, to enhance the accuracy of the humidity index in representing ground humidity conditions and to mitigate the influence of large water bodies on the load distribution of principal components, the modified normalized difference water index (MNDWI) is used to mask water body information [13]. The elevation data, sourced from the Shuttle Radar Topography Mission (SRTM) dataset (USGS_SRTMGL1_003), are obtained from the USGS. Administrative division data are obtained from the National Basic Geographic Database of the Chinese National Geographic Information Resource Directory Service System (https://www.webmap.cn). All the data are processed uniformly to a resolution of 500 m.
Methods
Construction of the RSEI
The RSEI is a remote sensing index that can be used to rapidly detect and assess the ecological environment [26, 27]. The RSEI considers the factors influencing the ecological environment and encompasses four interconnected components: greenness, wetness, dryness, and heat [28]. Among the commonly used vegetation indices [29, 30], the NDVI [31] has been found to be effective in reflecting the physical characteristics of vegetation, such as growth and coverage. This index has been broadly used in vegetation remote sensing research. In this study, the normalized NDVI was used as the greenness index. Additionally, soil moisture is crucial in climate [32], environmental, and ecological research and applications. The soil moisture level serves as an indicator of the regional ecological-environmental quality and is vital for monitoring surface environment conditions [33]. In remote sensing, the tasseled cap transformation [34] has proven valuable for estimating soil moisture and efficiently reducing data redundancy. The humidity index in this study was derived from the humidity component obtained through the tasseled cap transformation [35]. In ecological-environmental monitoring and evaluation, the dryness index is a crucial indicator. Typically, the dryness index is calculated by combining the soil index (SI) [36] and the index-based built-up index (IBI) [37]. Surface temperature serves as a heat index, and its estimation is achieved using the atmospheric correction method in the single-channel algorithm [38]. The specific formulas for the four indicators are provided in Table 1. These four remote sensing indices are integrated through PCA. The RSEI, obtained through PCA considering covariance, is derived from objective data, thereby mitigating the impact of subjective factors on the contribution of each considered index to the RSEI [39]. The RSEI value is primarily determined from the first principal component.
Table 1.
Methods used for calculating the indicators.
Normalization processing is performed on the GEE platform before principal component analysis to ensure uniformity among dimensions and units and address comparability issues among diverse data types and indicators. The four indicators are standardized within the range of [0, 1]. Principal component 1 (PC1) is calculated using the PCA algorithm [40]. PC1 represents RSEI0, and the RSEI is obtained by subtracting RSEI0 from PC1 [41]. To calculate the initial remote sensing ecological index (RSEI0), PC1 is used, as follows:
(1)
Where VGreenness and VHumidity represent the eigenvectors of greenness and humidity, respectively. To facilitate measurement and comparison, RSEI0 is further normalized using the following formula:
RSEI0min and RESI0max are the minimum and maximum values of RESI0 in the target year, respectively, and RSEI is the final remote-sensing-based ecological index.
To precisely assess the spatial and temporal variations in ecosystem quality, the ecological quality of Chengdu is classified into five distinct categories based on the RSEI values. These categories are explicitly delineated as follows: excellent (0.8 < RSEI ≤ 1), indicating the highest ecological quality; good (0.6 < RSEI ≤ 0.8), representing a high-quality environment with minor areas for improvement; moderate (0.4 < RSEI ≤ 0.6), indicating a satisfactory environment with room for enhancement; fair (0.2 < RSEI ≤ 0.4), with areas of concern where improvements are needed; and poor (0 < RSEI ≤ 0.2), indicating the lowest ecological quality and the urgent need for remediation measures [42].
Geoscience Information Map Analysis
The application of the geoscience information mapping theory primarily focuses on tracking changes in spatial information. This theory serves as a valuable tool for intuitively representing the progression of process information, spatial data, and attribute information [43]. In this paper, we introduce the theory of geoscience information mapping to analyze changes in ecological quality grades. Using QGIS 3.22 software, ecological quality grades are assigned numerical codes (1, 2, 3, 4, and 5) corresponding to different levels: poor, fair, moderate, good, and excellent. The ecological quality grade of the previous period is represented as a 10-digit number, and a single digit denotes the quality grade. These codes are synthesized through algebraic operations [44] as follows:
In the formula, N represents the newly generated map code, indicating the change in ecological quality from Grade A in the starting year to Grade B in the ending year. For instance, code 14 indicates a change in the ecological grade from 1 to 4, indicating a transition from poor to good quality. Changes in ecological quality encompass shifts from low-level to high-level ecological quality, and vice versa. During the research process, the initial and final data are superimposed to extract spatial change information corresponding to the ecological level.
Spatial Autocorrelation Analysis
The primary aim of spatial autocorrelation analysis [45] is to ascertain whether a variable exhibits spatial correlation. This type of analysis reveals the correlation between the quality of the ecological environment at a central pixel point and that at neighboring spatial points based on remote sensing, characterizing the homogeneity of the spatial distribution. Both the global Moran’s I index and the local Moran’s I index are used to assess the spatial correlation of the RSEI [46]. The global Moran’s I index provides an overview of the average correlation degree among the spatial units in the region and the surrounding units. However, the attribute value in the formula is contingent upon the research objective [47]. Details of the formula and the corresponding explanation can be found in [14].
Coefficient of Variation
The coefficient of variation (CV) is primarily used to reflect the degree of discreteness of data. A large CV indicates a discrete data distribution and high data fluctuations [48]. Conversely, when the data distribution is concentrated, the data fluctuations are small, indicating a stable time series. The CV is calculated based on the RSEI values of the pixels and reflects the stability of the ecological quality in Chengdu. The calculation method is as follows:
In the formula, n represents the number of years, i represents the i-th year, RSEIi denotes the RSEI in the i-th year, STDRSEI represents the standard deviation of the regional average of the RSEI year by year, RSEImean represents the average annual RSEI of the region, and CV is the coefficient of variation. A large CV indicates a high degree of variation and low stability, while a small CV indicates a low degree of variation and high stability. The hierarchical breaks in cluster analysis are determined based on the natural arrangement and distribution of the data, rather than artificial settings. Therefore, the CV is divided into five levels according to the cluster analysis method [49]: low fluctuation (CV ≤ 0.15), low to moderate fluctuation (0.15 < CV ≤ 0.20), moderate fluctuation (0.20 < CV ≤ 0.25), slightly high fluctuation (0.25 < CV ≤ 0.31), and high fluctuation (CV > 0.31).
Mann‒Kendall and Sen’s Slope Tests
The Mann‒Kendall (M‒K) test is a nonparametric statistical approach designed for the significance testing of nonnormally distributed sequence trends, effectively revealing the trend characteristics in time series data. The detailed formula for this method can be found in the literature [50]. The significance of the change in RSEI is assessed at a confidence level of α=0.05. If the absolute value of Z is greater than 1.96, the change is deemed significant, and if the absolute value of Z is less than 1.96, the change is considered insignificant.
Sen’s trend degree indicates the magnitude and direction of a change in trend. The corresponding formula is as follows:
In the formula, β represents the trend degree of the RSEI sequence, Median denotes the median, RSEIi represents the RSEI pixel value of the RSEI sequence, and i and j are the i-th and j-th positions of the time series, with RSEIi and RSEIj representing the i-th and j-th RSEI pixel values, respectively. When β > 0, the sequence shows an upward trend, and when β = 0, the sequence displays no change in trend, indicating a flat sequence. When β < 0, the sequence exhibits a decreasing trend. The greater the absolute value of β is, the greater the degree of the upward or downward trend.
Hurst Index
The Hurst index can be used to quantitatively characterize the persistence or long-term correlation of changes in time series data. The method most commonly used is the R/S analysis method [51], and the formula is as follows:
In the formula, R represents the range of RSEI values, S represents the standard deviation of RSEI values, and c is a constant. The observation values are divided into n subsequences of RSEIi, where i = 1, 2..., n. m is any positive integer, and 0 < m < n. H represents the Hurst index, and the formula for determining the range R(m) is as follows:
In the formula, X(t) is the cumulative dispersion, which is obtained as follows:
In the formula, 1 < t < m. The formula for the standard deviation S(m) is as follows:
Through computations, multiple average rescaled range values are derived. Taking the logarithm of both sides of equation (6) and employing the least squares method for linear fitting yields a slope, which is directly used to obtain the Hurst index (H). H ranges from 0 to 1. A value of H = 0.5 signifies that the time series data demonstrate independent randomness with no discernible patterns. When 0.5 > H > 0, the time series exhibits evident antipersistence, indicating that the future trend opposes the past trend. Conversely, when 1 > H > 0.5, the time series reflects a state of continuous development, signifying that the future trend aligns with the past trend.
Results and Discussion
RSEI Model Building
The four indicators above were integrated through PCA, specifically focusing on PC1 to compute the RSEI in Chengdu. PC1, known to account for more than 55% of the total variation in the dataset, was employed to mitigate potential biases stemming from subjective weighting during the calculation process (refer to Table 2 for detailed information).
The utilization of PC1 effectively amalgamated the predominant characteristics of the four individual ecological indicators. Positive loading values for the humidity and greenness indices in PC1 across the period of 2013-2022 suggest their favorable impact on the regional ecological environment. Conversely, negative loading values for the dryness and heat indices indicate adverse effects in the observed scenario. In general, elevated values of the NDVI and WET correspond to increased vegetation coverage and surface humidity, indicative of enhanced ecological conditions. Conversely, heightened values of the NDBSI and LST imply intensified soil hardening, increased surface temperature, and a decrease in the quality of the ecological environment.
Given its effective integration of information from all four indicators and alignment with observed conditions, PC1 is ideal for establishing a comprehensive ecological index and analyzing changes in the ecological environment in the study area. From 2013 to 2022, the average RSEI in Chengdu increased from 0.482 to 0.557, reflecting a 15.56% improvement and indicating a gradual enhancement in the city’s ecological situation over the past decade. Notably, greenness emerges as the primary contributor to improved ecological quality, and LST is the primary driver of degradation in the study area.
Spatiotemporal Changes in the Ecological Quality in Chengdu
Fig. 3 shows the average RSEI and its distribution in Chengdu over ten years, from 2013 to 2022. These findings indicate a positive trend in the overall quality of the ecological environment in Chengdu. Specifically, the average RSEI increased from 0.482 in 2013 to 0.557 in 2022, reflecting a notable increase of 15.56%. Notably, the highest average RSEI was observed in 2022 at 0.5183, while the lowest RSEI occurred in 2019 at 0.462. This discernible improvement in ecological quality over the study period can be attributed to concerted governmental efforts and policy initiatives. During this timeframe, the Chinese government sequentially released the National Ecological Protection and Construction Plan (2013-2020) and the Overall Plan for the Reform of the Ecological Civilization System. These policy frameworks were foundational elements that guided the vigorous pursuit of ecological protection and governance in Chengdu. Consequently, the region experienced a gradual enhancement in the quality of its ecological environment.
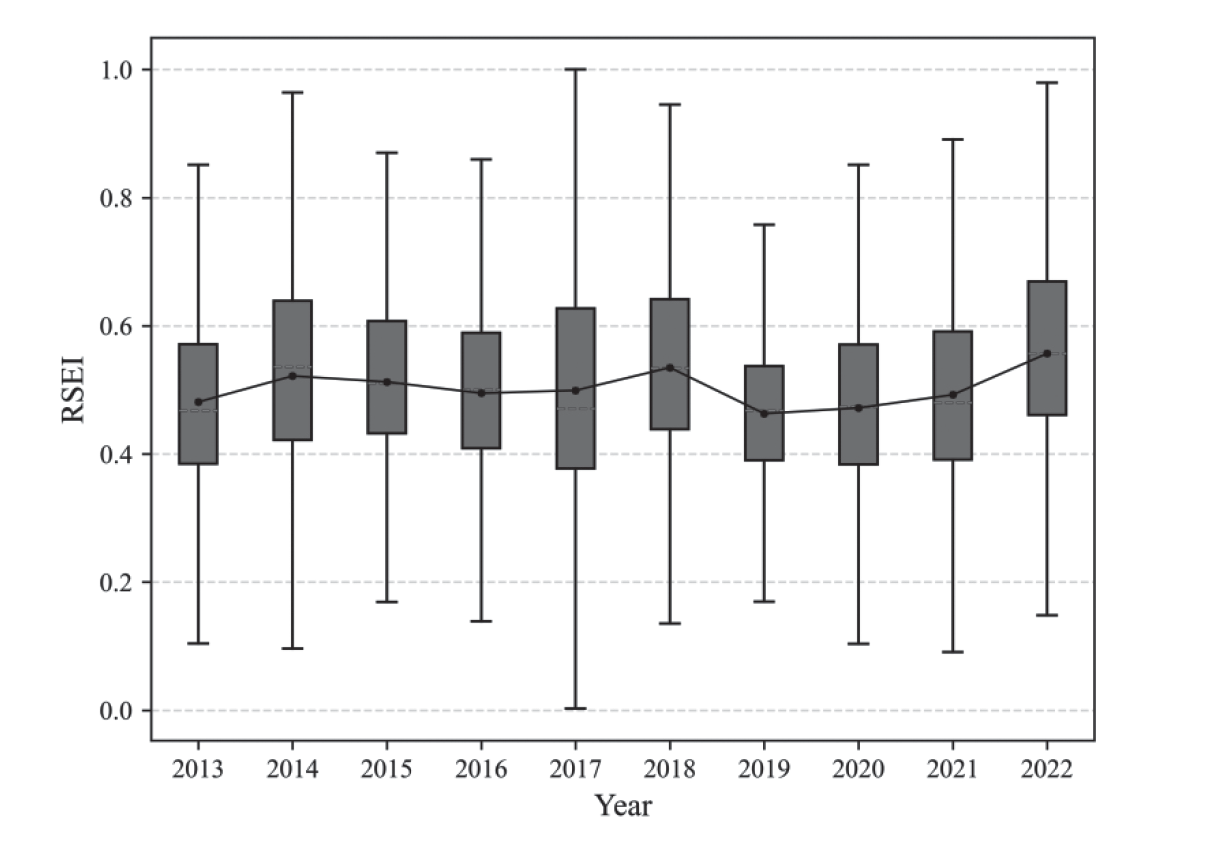
Table 2.
Contributions and loadings of the four indices to the first principal component (PC1).
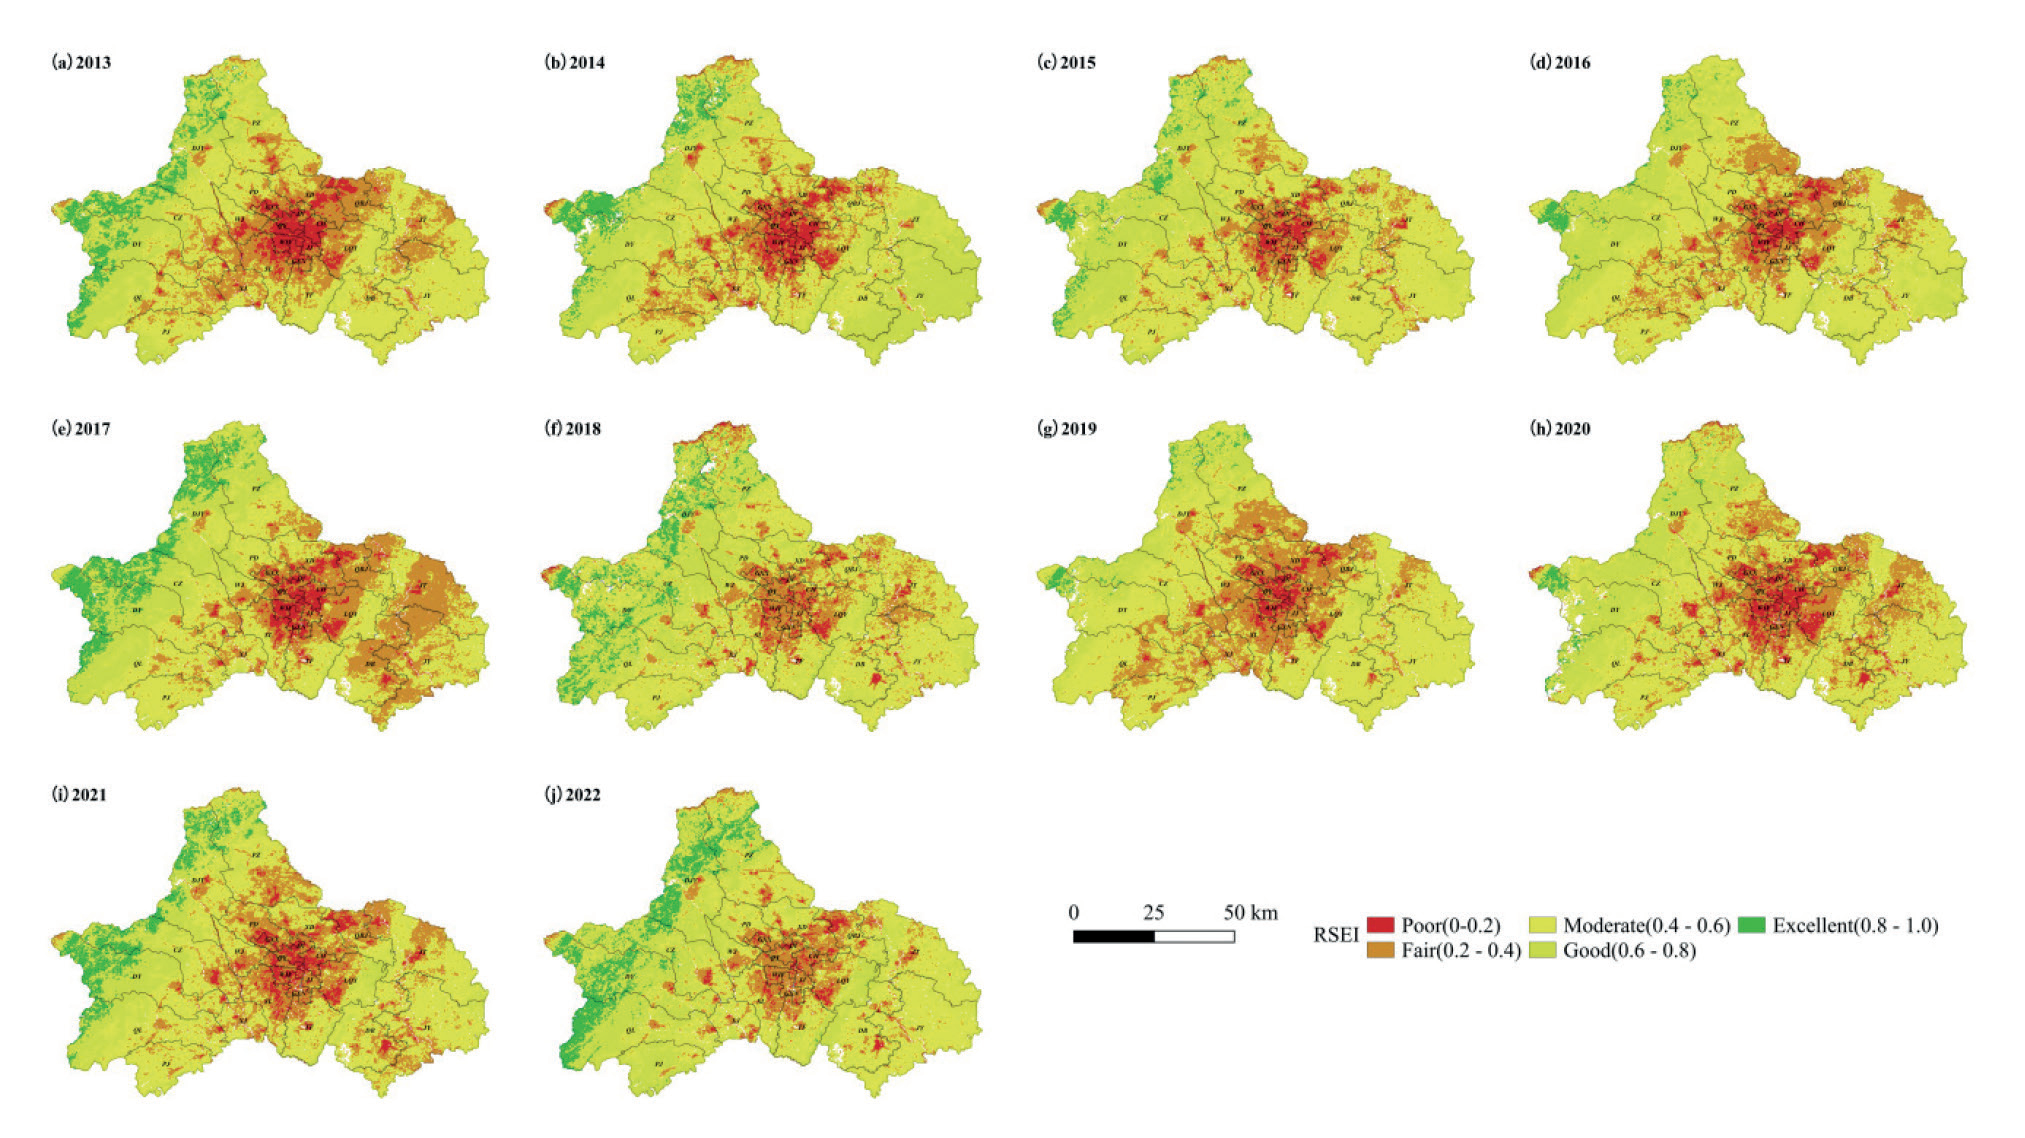
Fig. 4 illustrates the spatial dynamics of the ecological quality of Chengdu spanning from 2013 to 2022. Generally, western Chengdu exhibited greater ecological quality than did the central and eastern regions. Areas of excellent quality are predominantly clustered within the three-circle vicinity of Chengdu. In these areas, high vegetation coverage, limited human activity, and robust ecological carrying capacity contribute to the superior ecological quality. Conversely, regions exhibiting an average ecological level are concentrated primarily in the second-circle vicinity, representing a transitional zone from urban to natural conditions. Areas characterized by poor and fair ecological environments are primarily within the highly urbanized central area of Chengdu. The expansion of construction land in these regions has encroached upon the original ecological landscape, leading to diminished vegetation, reduced green spaces, and an augmented urban heat island effect.
In the last decade, the rapid development in Southwest China has significantly impacted the region’s infrastructure and environment. The Southwest airline base, centered around Shuangliu Airport, has seen a notable decline in passenger capacity due to increasing demand. This has necessitated the establishment of a second international airport to support Chengdu’s continued growth. Consequently, the construction of Tianfu International Airport in the Dongbu New District (DB) since 2017 has led to a decrease in RSEI in the vicinity, reflecting a decline in ecological quality.
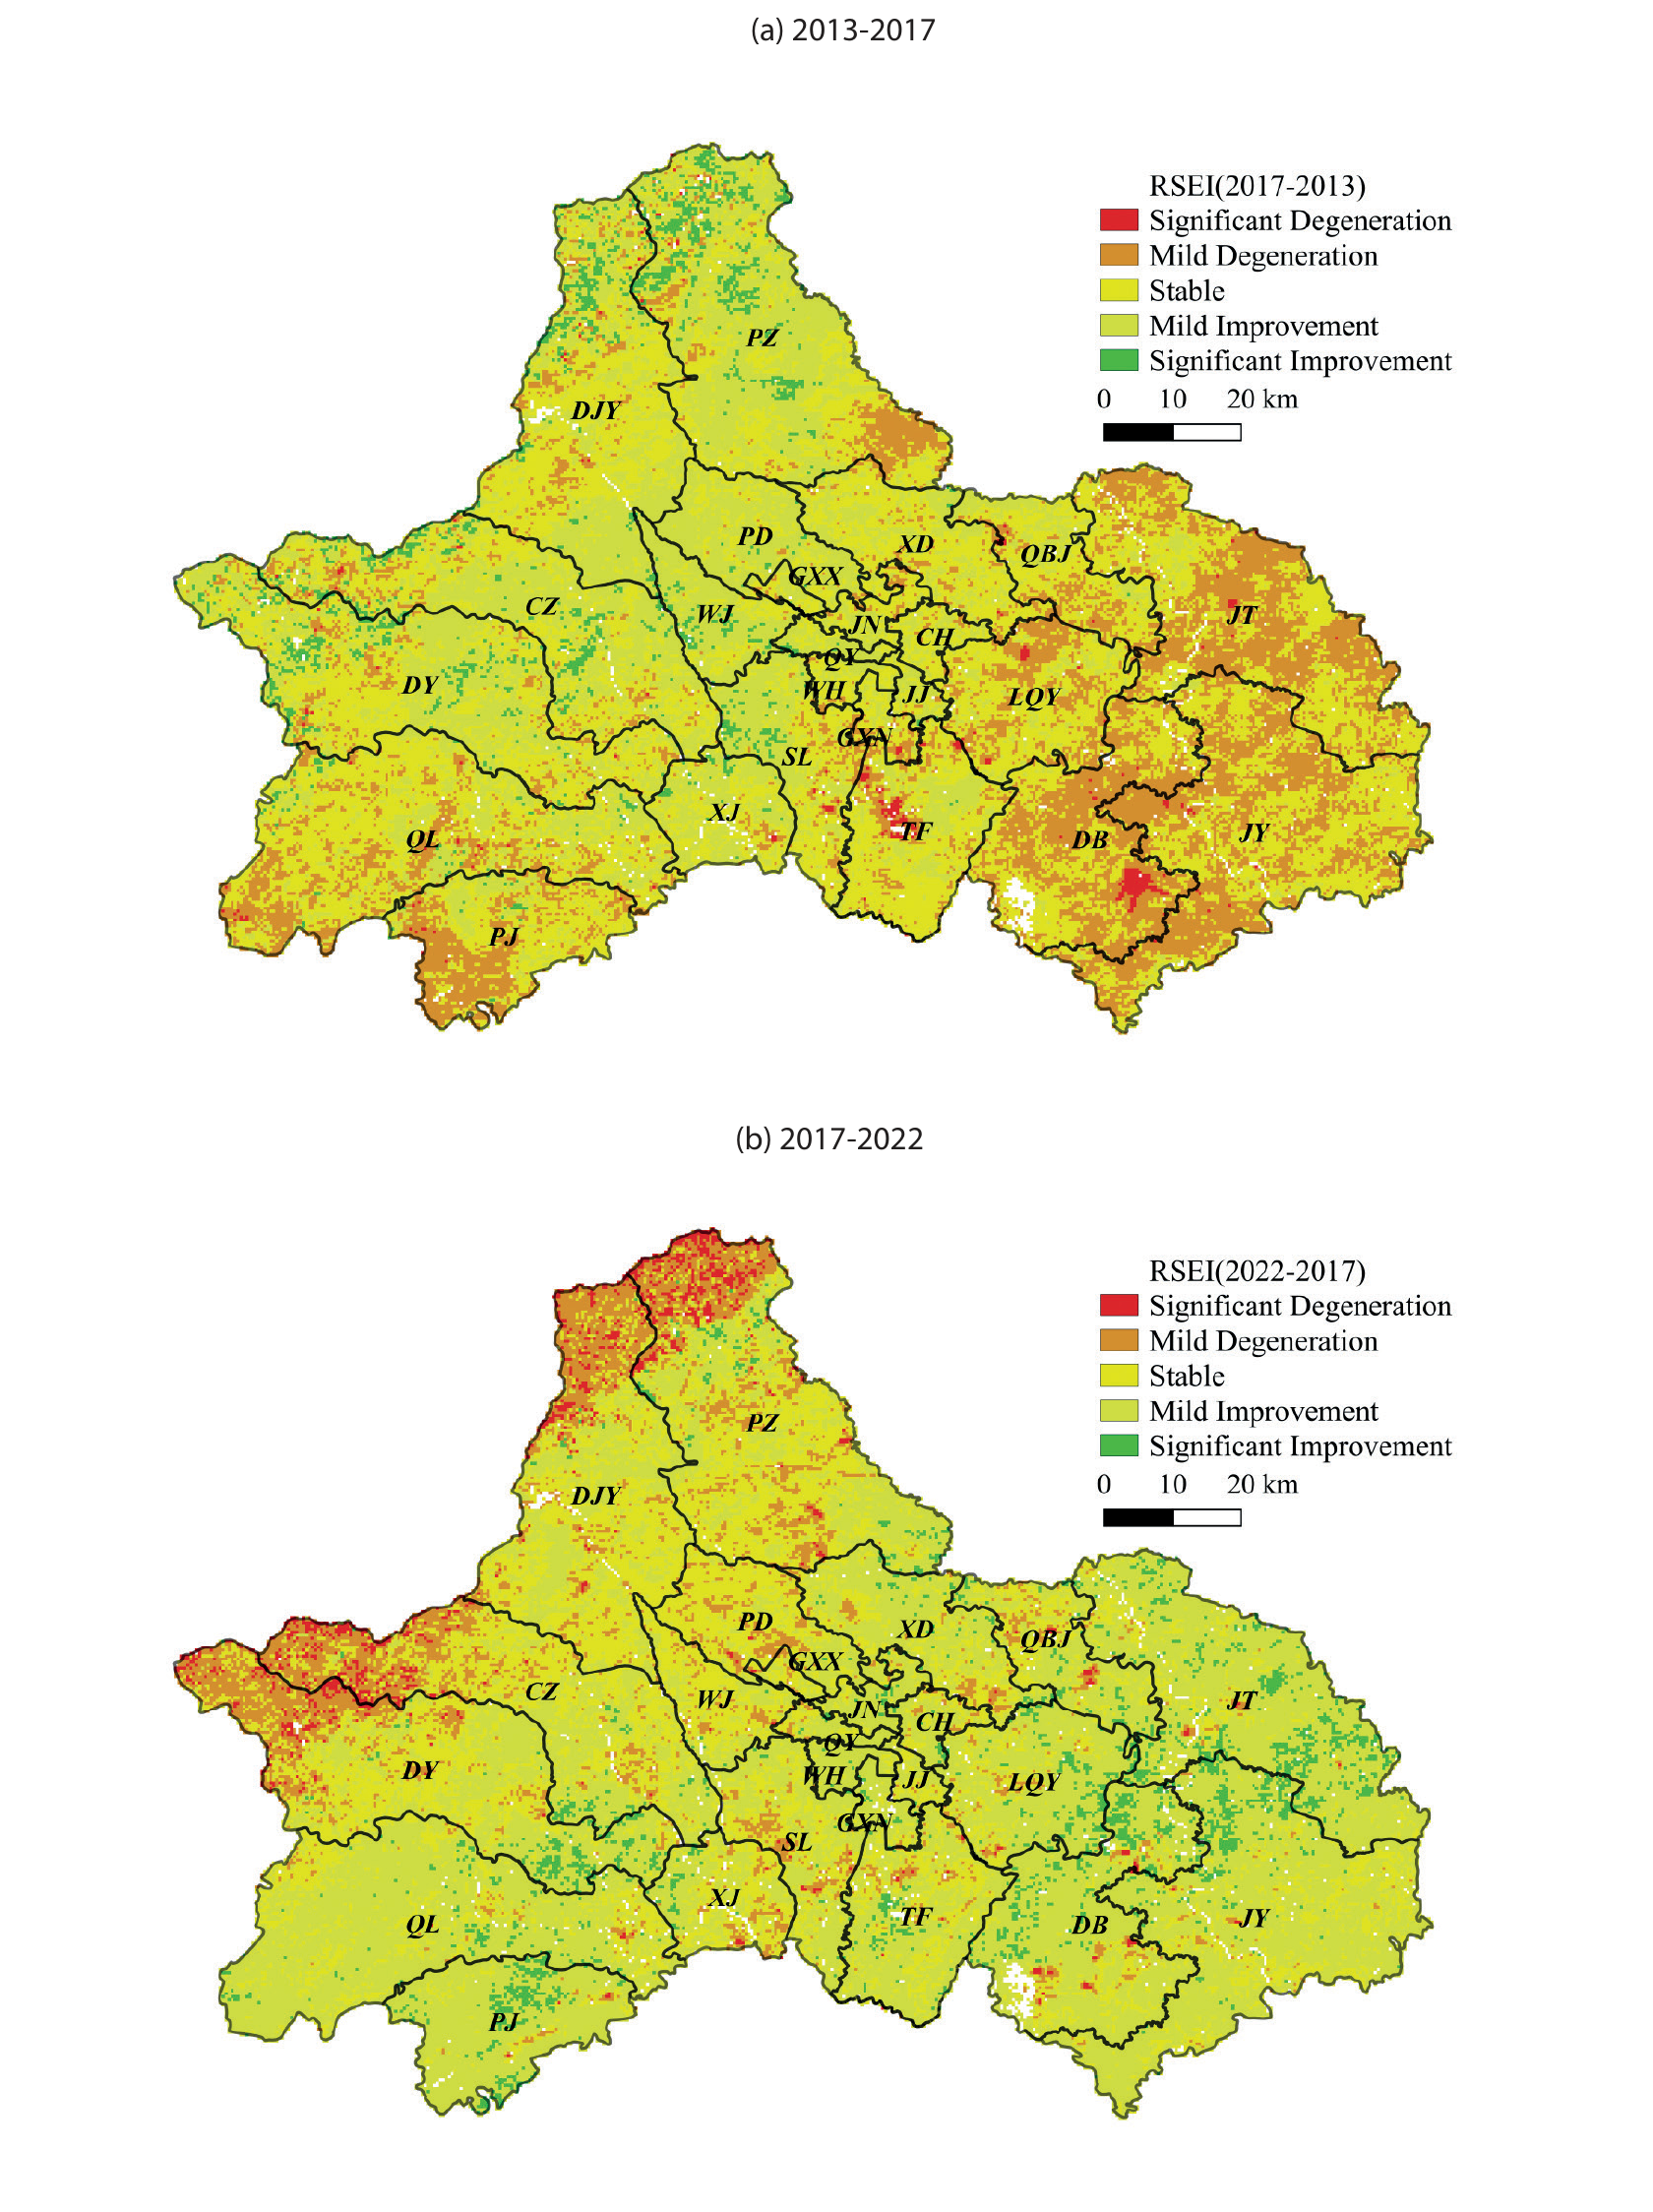
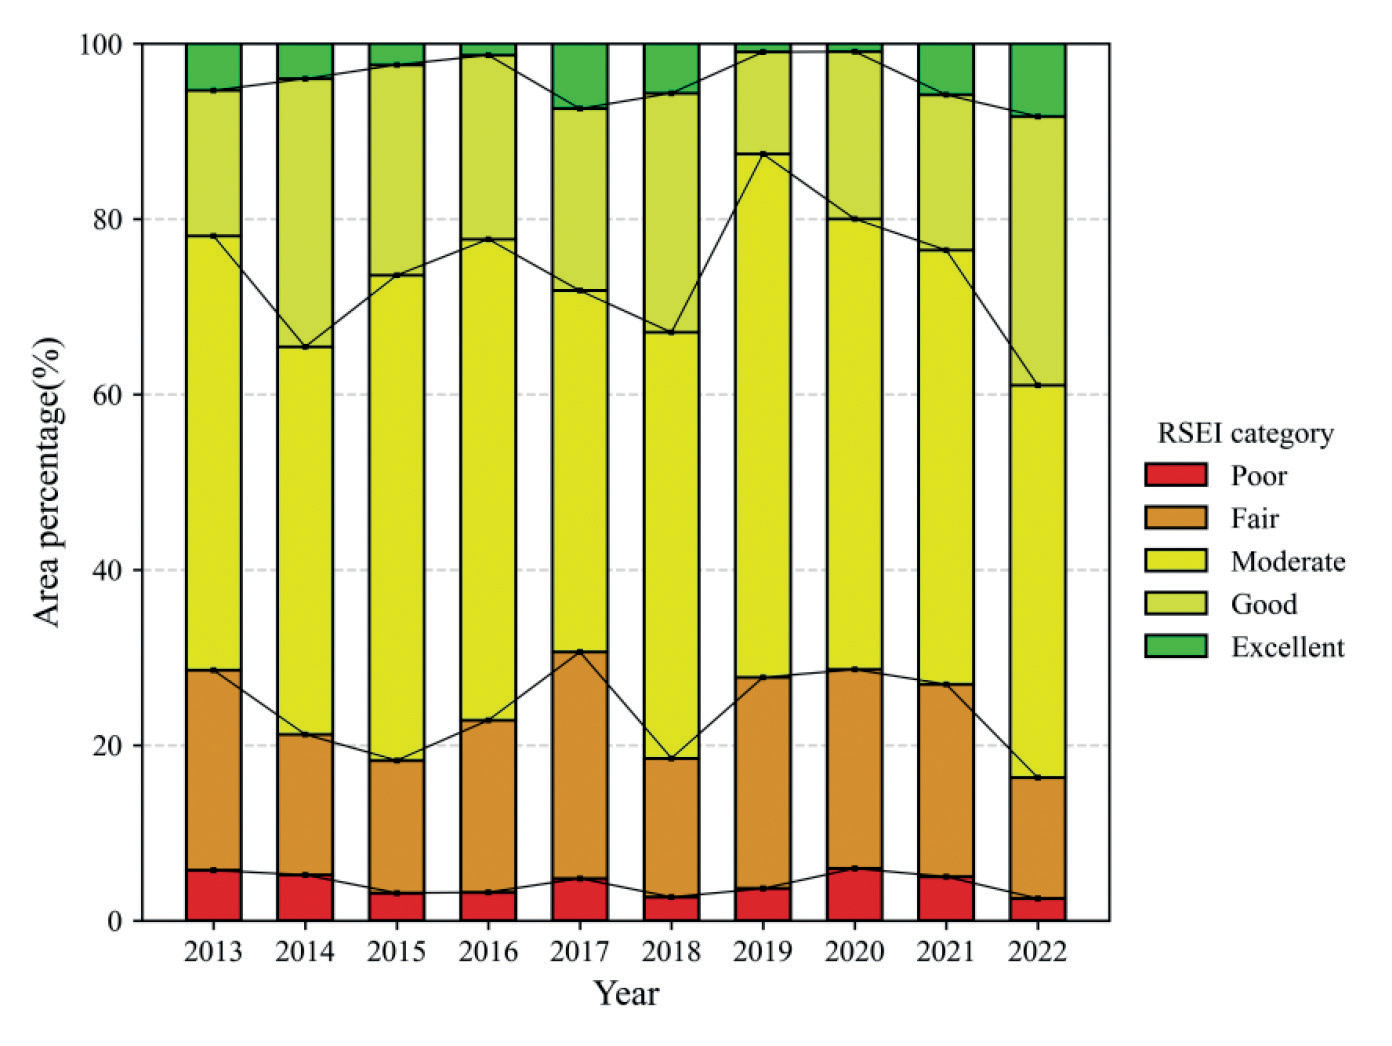
Fig. 5 illustrates the proportional distribution of the quality of the ecological environment in Chengdu from 2013 to 2022. The overall proportions of excellent and good RSEI values in Chengdu exhibited fluctuations, trending upward at the decadal scale, while the proportions of poor and fair RSEI values showed a decreasing trend. The proportion of areas classified as having moderate ecological quality showed modest variations. The average RSEI value initially decreased from 2013 to 2017, followed by a gradual increase from 2018 to 2022. As a result, the overall ecological quality of Chengdu gradually improved over the past decade.
RSEI Transfer Analysis
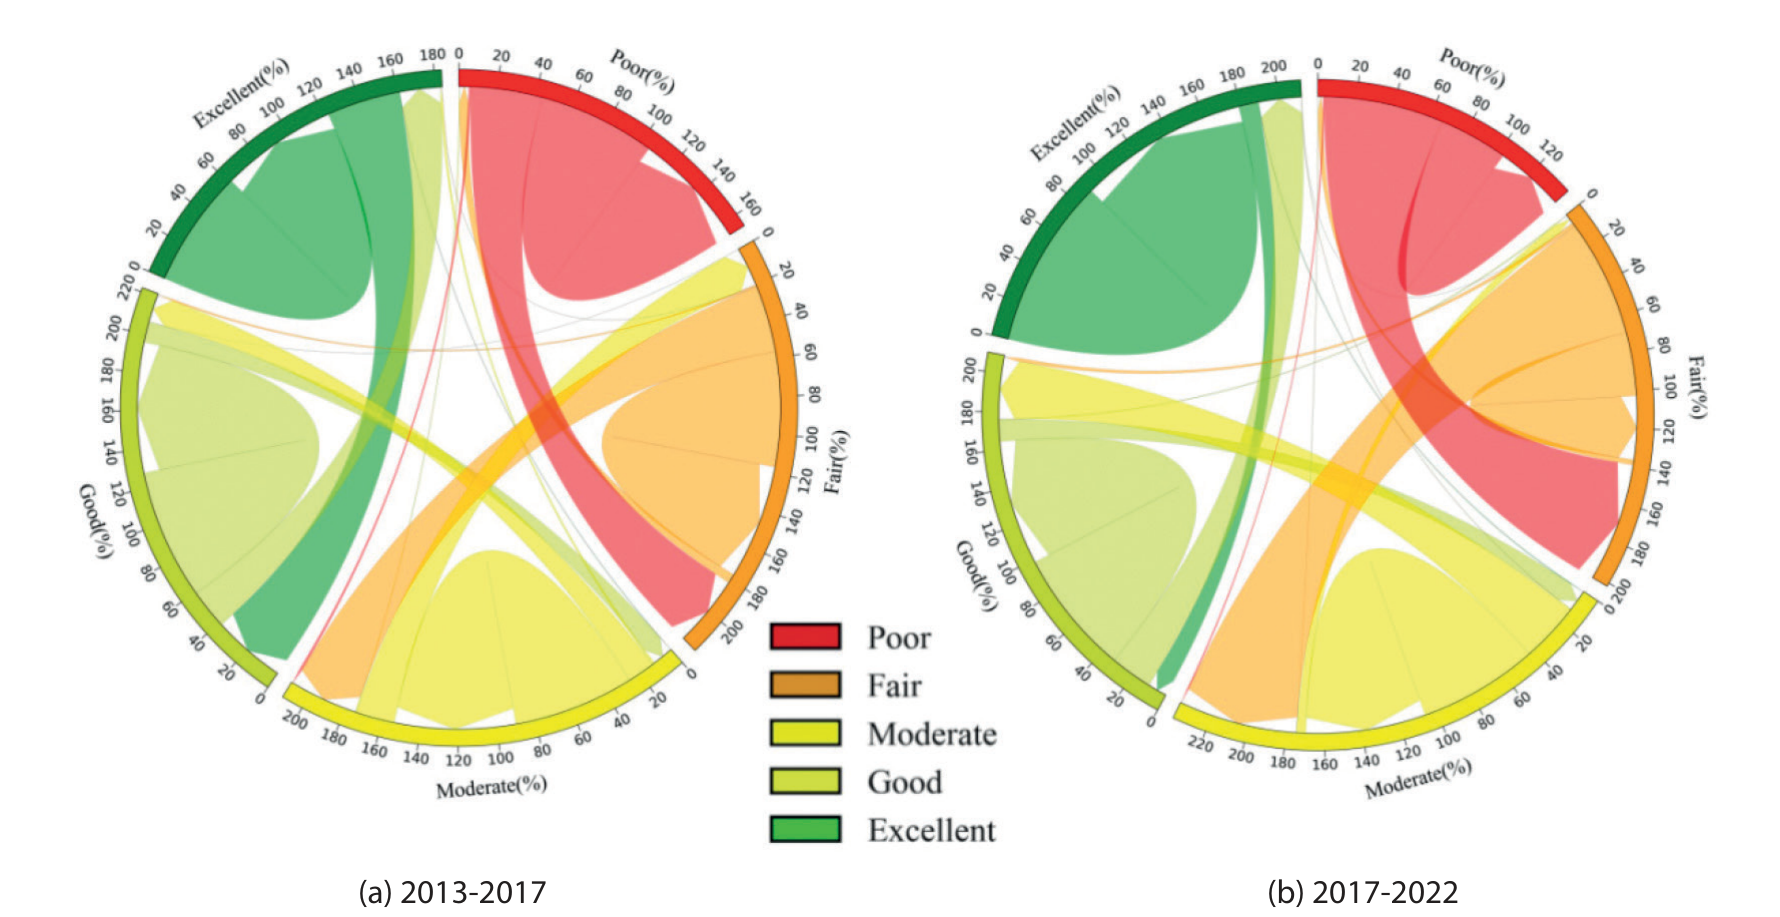
Fig. 6 and Fig. 7 delineate the variations in distinct levels of environmental quality in Chengdu from 2013 to 2022. There were notable decreases in the proportions of poor and fair grades, accompanied by increases in the proportions of moderate, good, and excellent grades. From 2013 to 2017, the areas transitioning from poor to fair and moderate grades covered 356.5 and 12.25 Km2, respectively, representing 37.24% and 1.28% of the initial poor-grade area. Furthermore, approximately 20% of the initial areas with good RSEI grades evolved to areas with excellent grades, covering approximately 584.5 Km2. From 2017 to 2022, the proportion of areas categorized as good and excellent grades continued to increase, while those designated as poor and fair decreased. The moderate-grade area remained relatively stable and represented the dominant category. Notably, an area of approximately 501 Km2 transitioned from poor to higher grades, with fair grades primarily becoming moderate (approximately 2671.5 Km2) and fair grades (114.25 Km2). During this period, the expansion of good-grade areas primarily occurred via the conversion of moderate-grade (2,181.5 Km2), poor-grade (83.75 Km2), and excellent-grade (65.6 Km2) areas. Simultaneously, a segment of the excellent-grade area transitioned to a moderate grade, indicating a reduction in ecological quality in the corresponding areas.
A comparative analysis of RSEI transitions between 2013 and 2017 and between 2017 and 2022 shows that the regions experiencing improvement outweigh those undergoing degradation. The enhanced areas are predominantly situated in the eastern sector of the study area. These areas encompass locales such as Longquanyi District (LQY), Jintang County (JT), Jianyang (JY), Dongbu New District (DB), and Pujiang County (PJ). Conversely, the degradation areas (areas experiencing a decline in ecological quality) are primarily located in the western mountainous regions. The areas with no change are mainly in the downtown area of Chengdu. This phenomenon is attributed to the mature and stable development of these central urban zones.
Spatial Autocorrelation Analysis of Ecological Quality
To maintain the integrity of information, considering the scale and the accuracy of quantitative evaluation and the internal characteristics of the study area, the images are resampled using a 1 km×1 km grid based on the landscape pattern and ecosystem characteristics in the study area. In this paper, we select 13974 sample points from each RSEI dataset (2013, 2017, and 2022) to account for spatial dependence. Then, we determine whether variables are spatially correlated and to what extent.
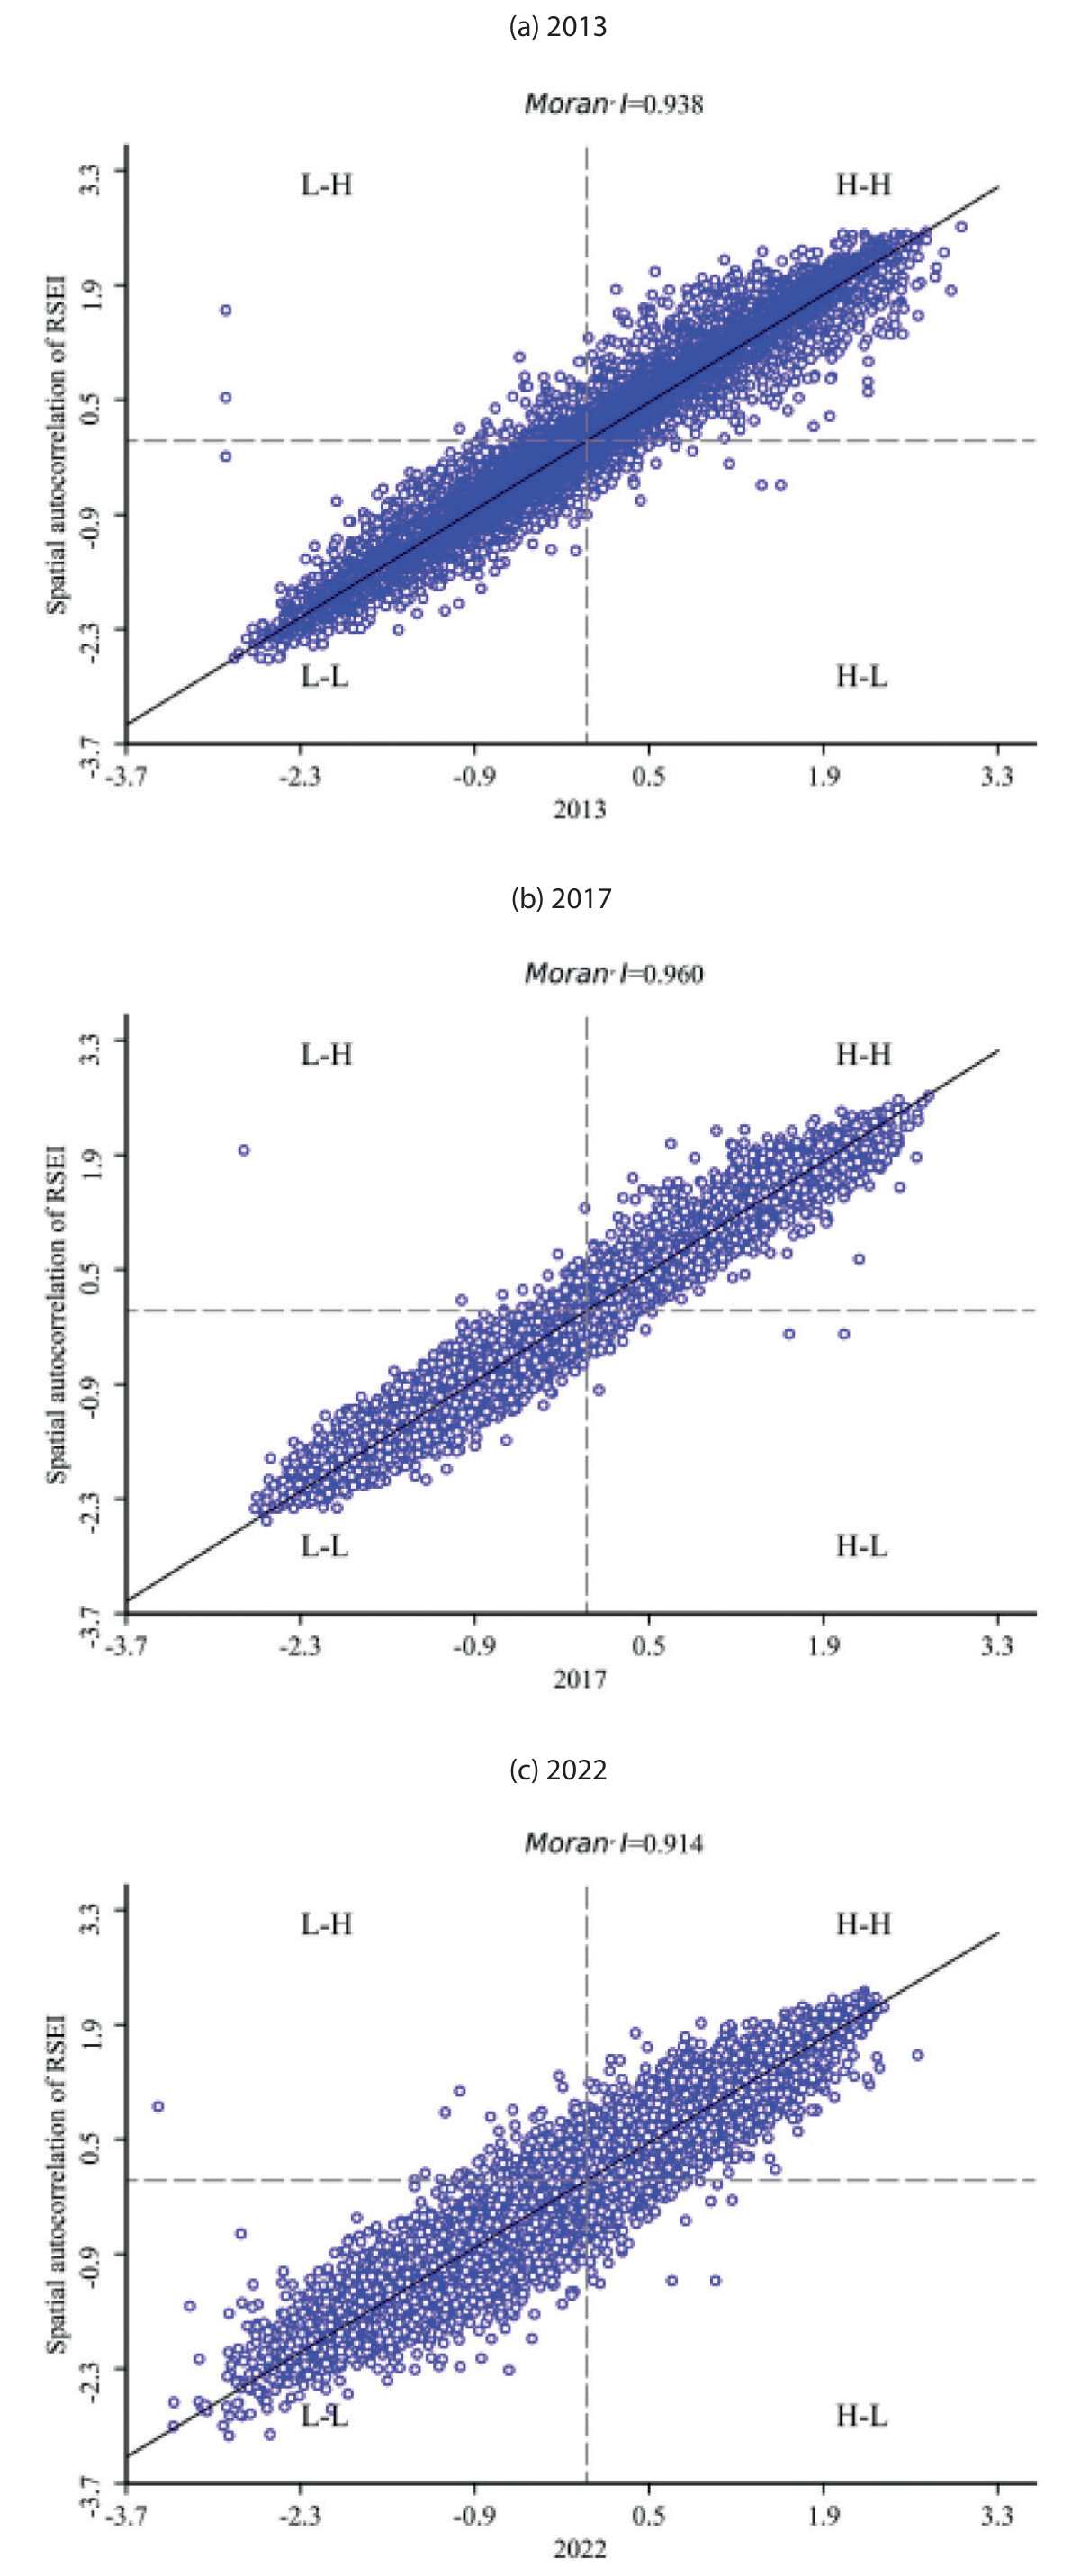
Based on the 13,974 resampling points described above, Moran’s I index and LISA are used to conduct a spatial autocorrelation analysis of the RSEI in Chengdu. Fig. 8 shows the Moran’s I scatter plot of the RSEI. The scatter points in each year are mainly distributed in the first and third quadrants, indicating that the ecological quality of the study area has a strong positive spatial correlation. The Moran I indices in 2013, 2017, and 2022 are 0.938, 0.960, and 0.914, respectively. These values indicate that the spatial distribution of the ecological quality over time is strongly aggregated, rather than random. The positive spatial correlation was the strongest in Chengdu in 2017. Moreover, Moran’s I first displays an upward trend from 2013 to 2017, and then a downward trend from 2017 to 2022.
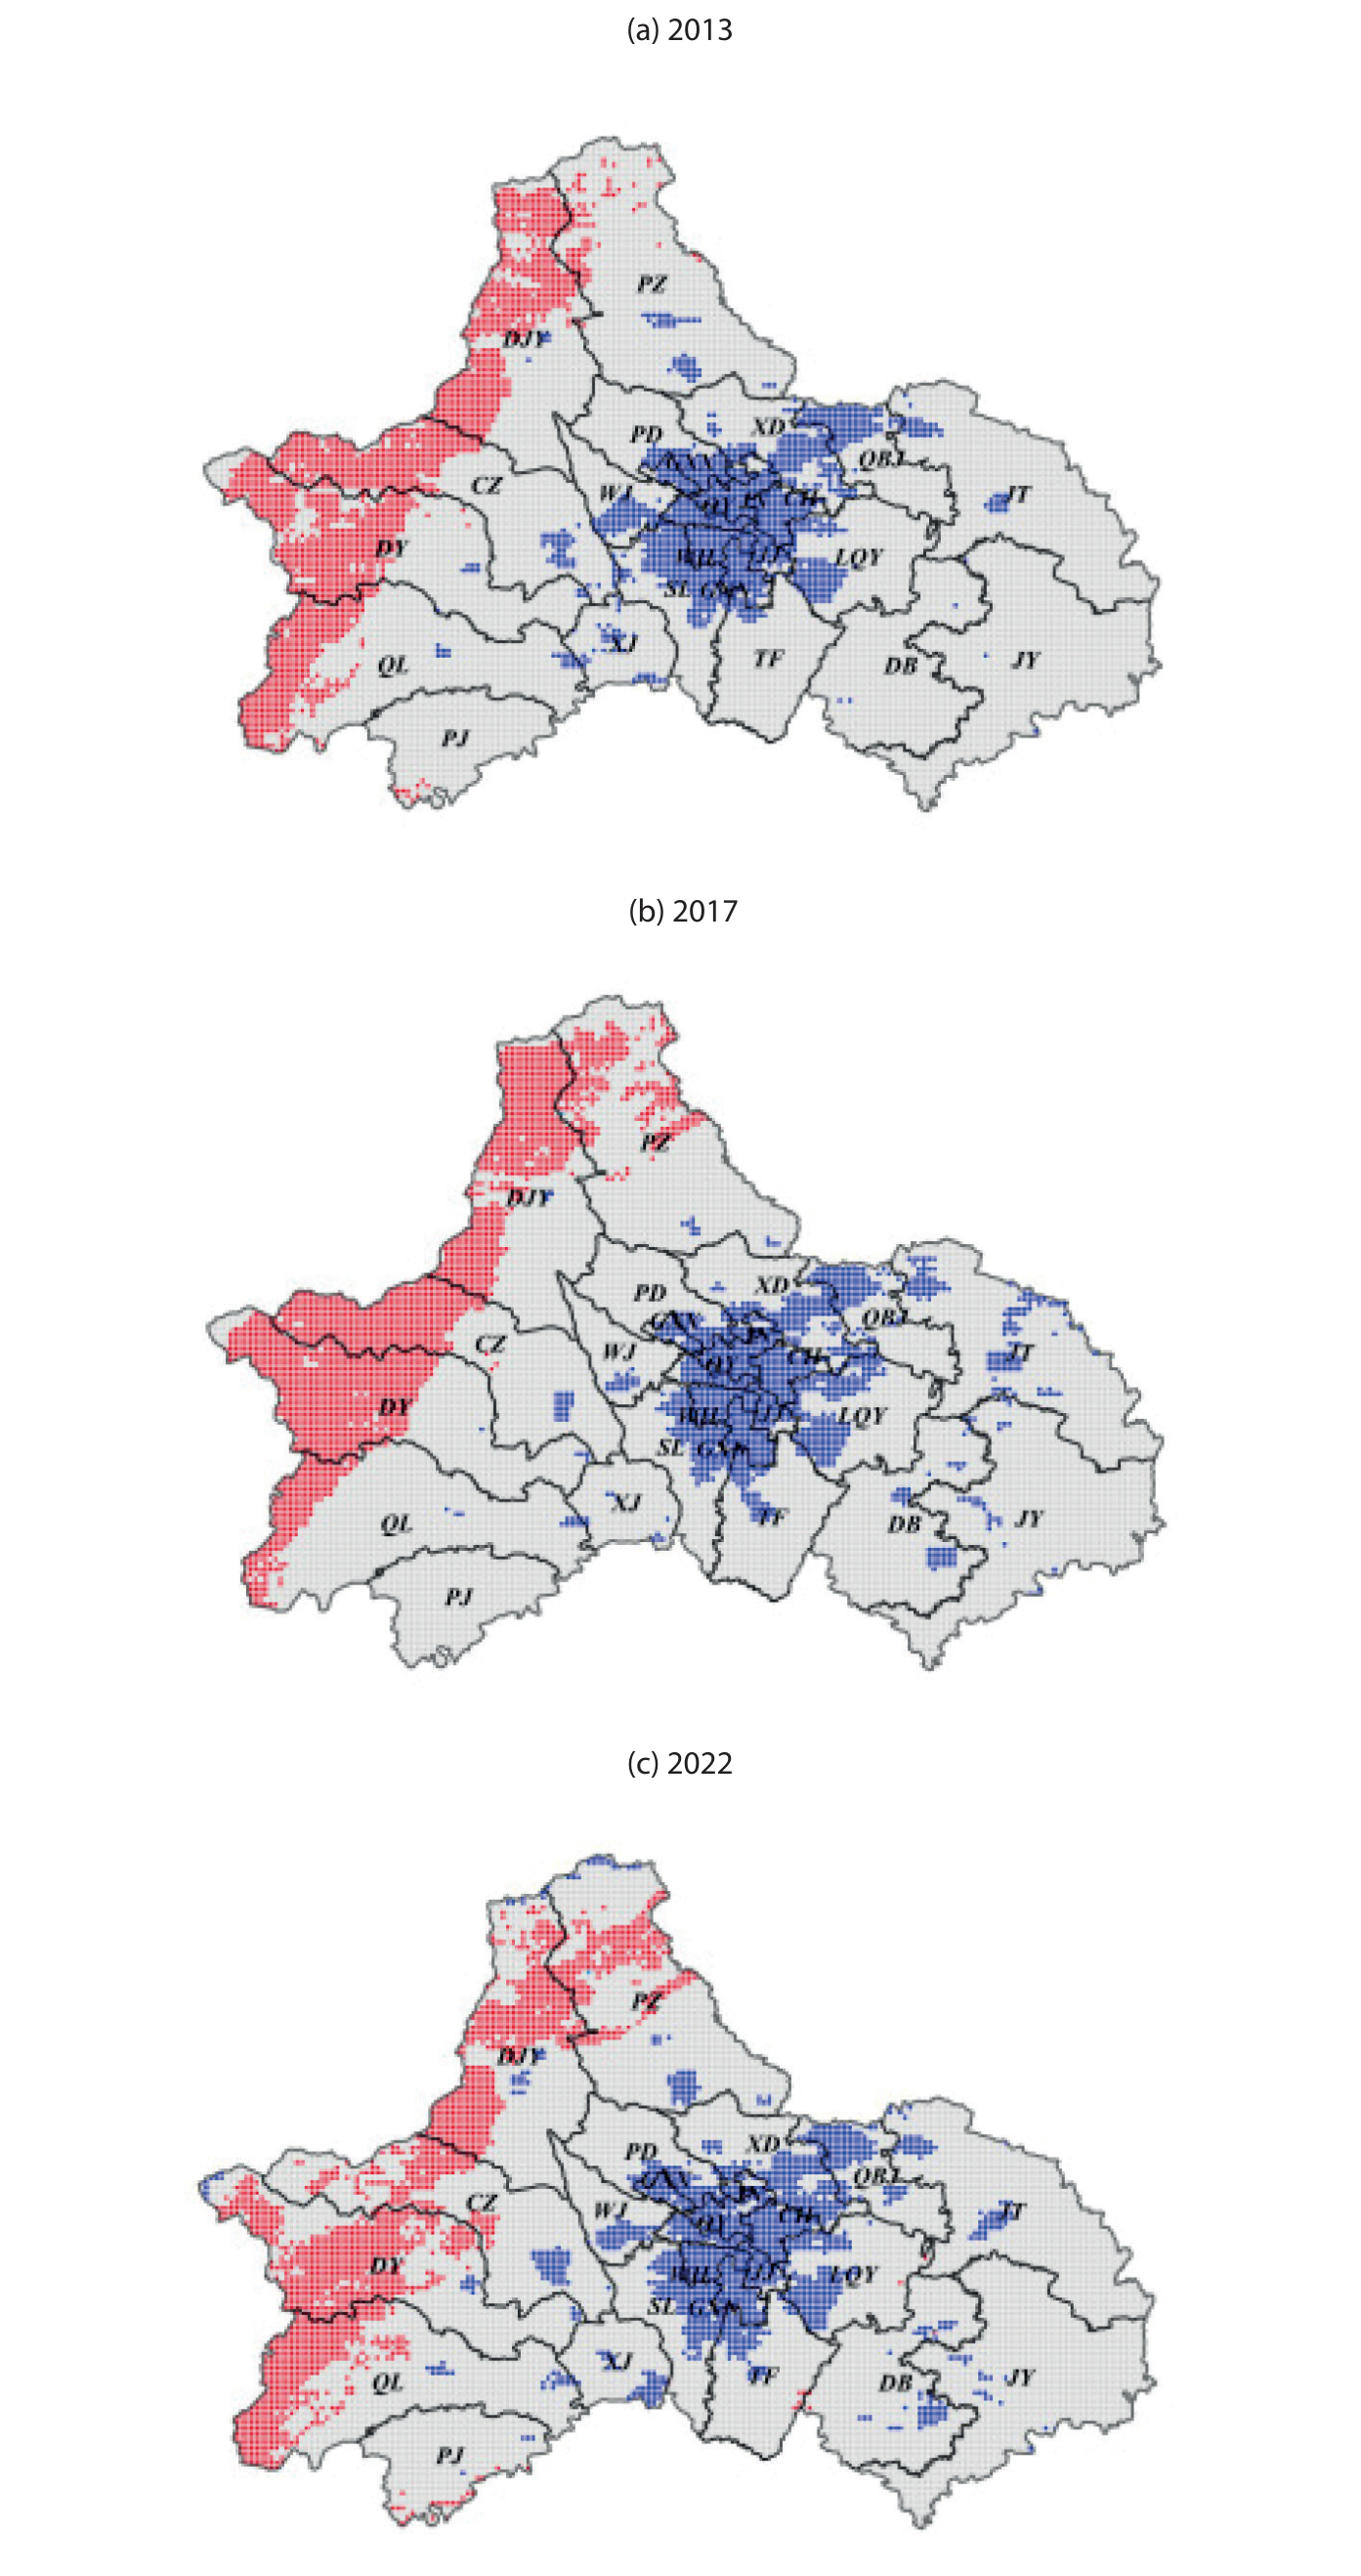
The LISA cluster diagram analysis provides valuable insights into the spatiotemporal distribution of ecological quality, categorizing areas into distinct patterns such as low-low (L-L) and high-high (H-H) spatial clusters, high-low (H-L) and low-high (L-H) spatial outliers, and regions with no significant correlation.
As shown in Fig. 9, regions designated as ‘No Significant Correlation’ are predominantly found in Chengdu’s second-and third-circle areas. Conversely, H-H cluster areas are concentrated in the western alpine region, with increased concentration from 2013 to 2017, indicating an overall improvement in the quality of the ecological environment, which is consistent with high RSEI values. L-L clusters, on the other hand, are mainly located in central urban areas characterized by dense populations, significant infrastructure, and stable development. However, these clusters are gradually expanding, particularly toward the east and south, such as in TF, LQY, and DB. This expansion is attributed to Chengdu’s urbanization strategy, which has led to a decline in ecological quality in these areas. These results demonstrate the importance of considering spatial dynamics in urban planning and development to achieve an ecological balance and sustainability while accommodating urban growth.
Changes in Ecological Quality
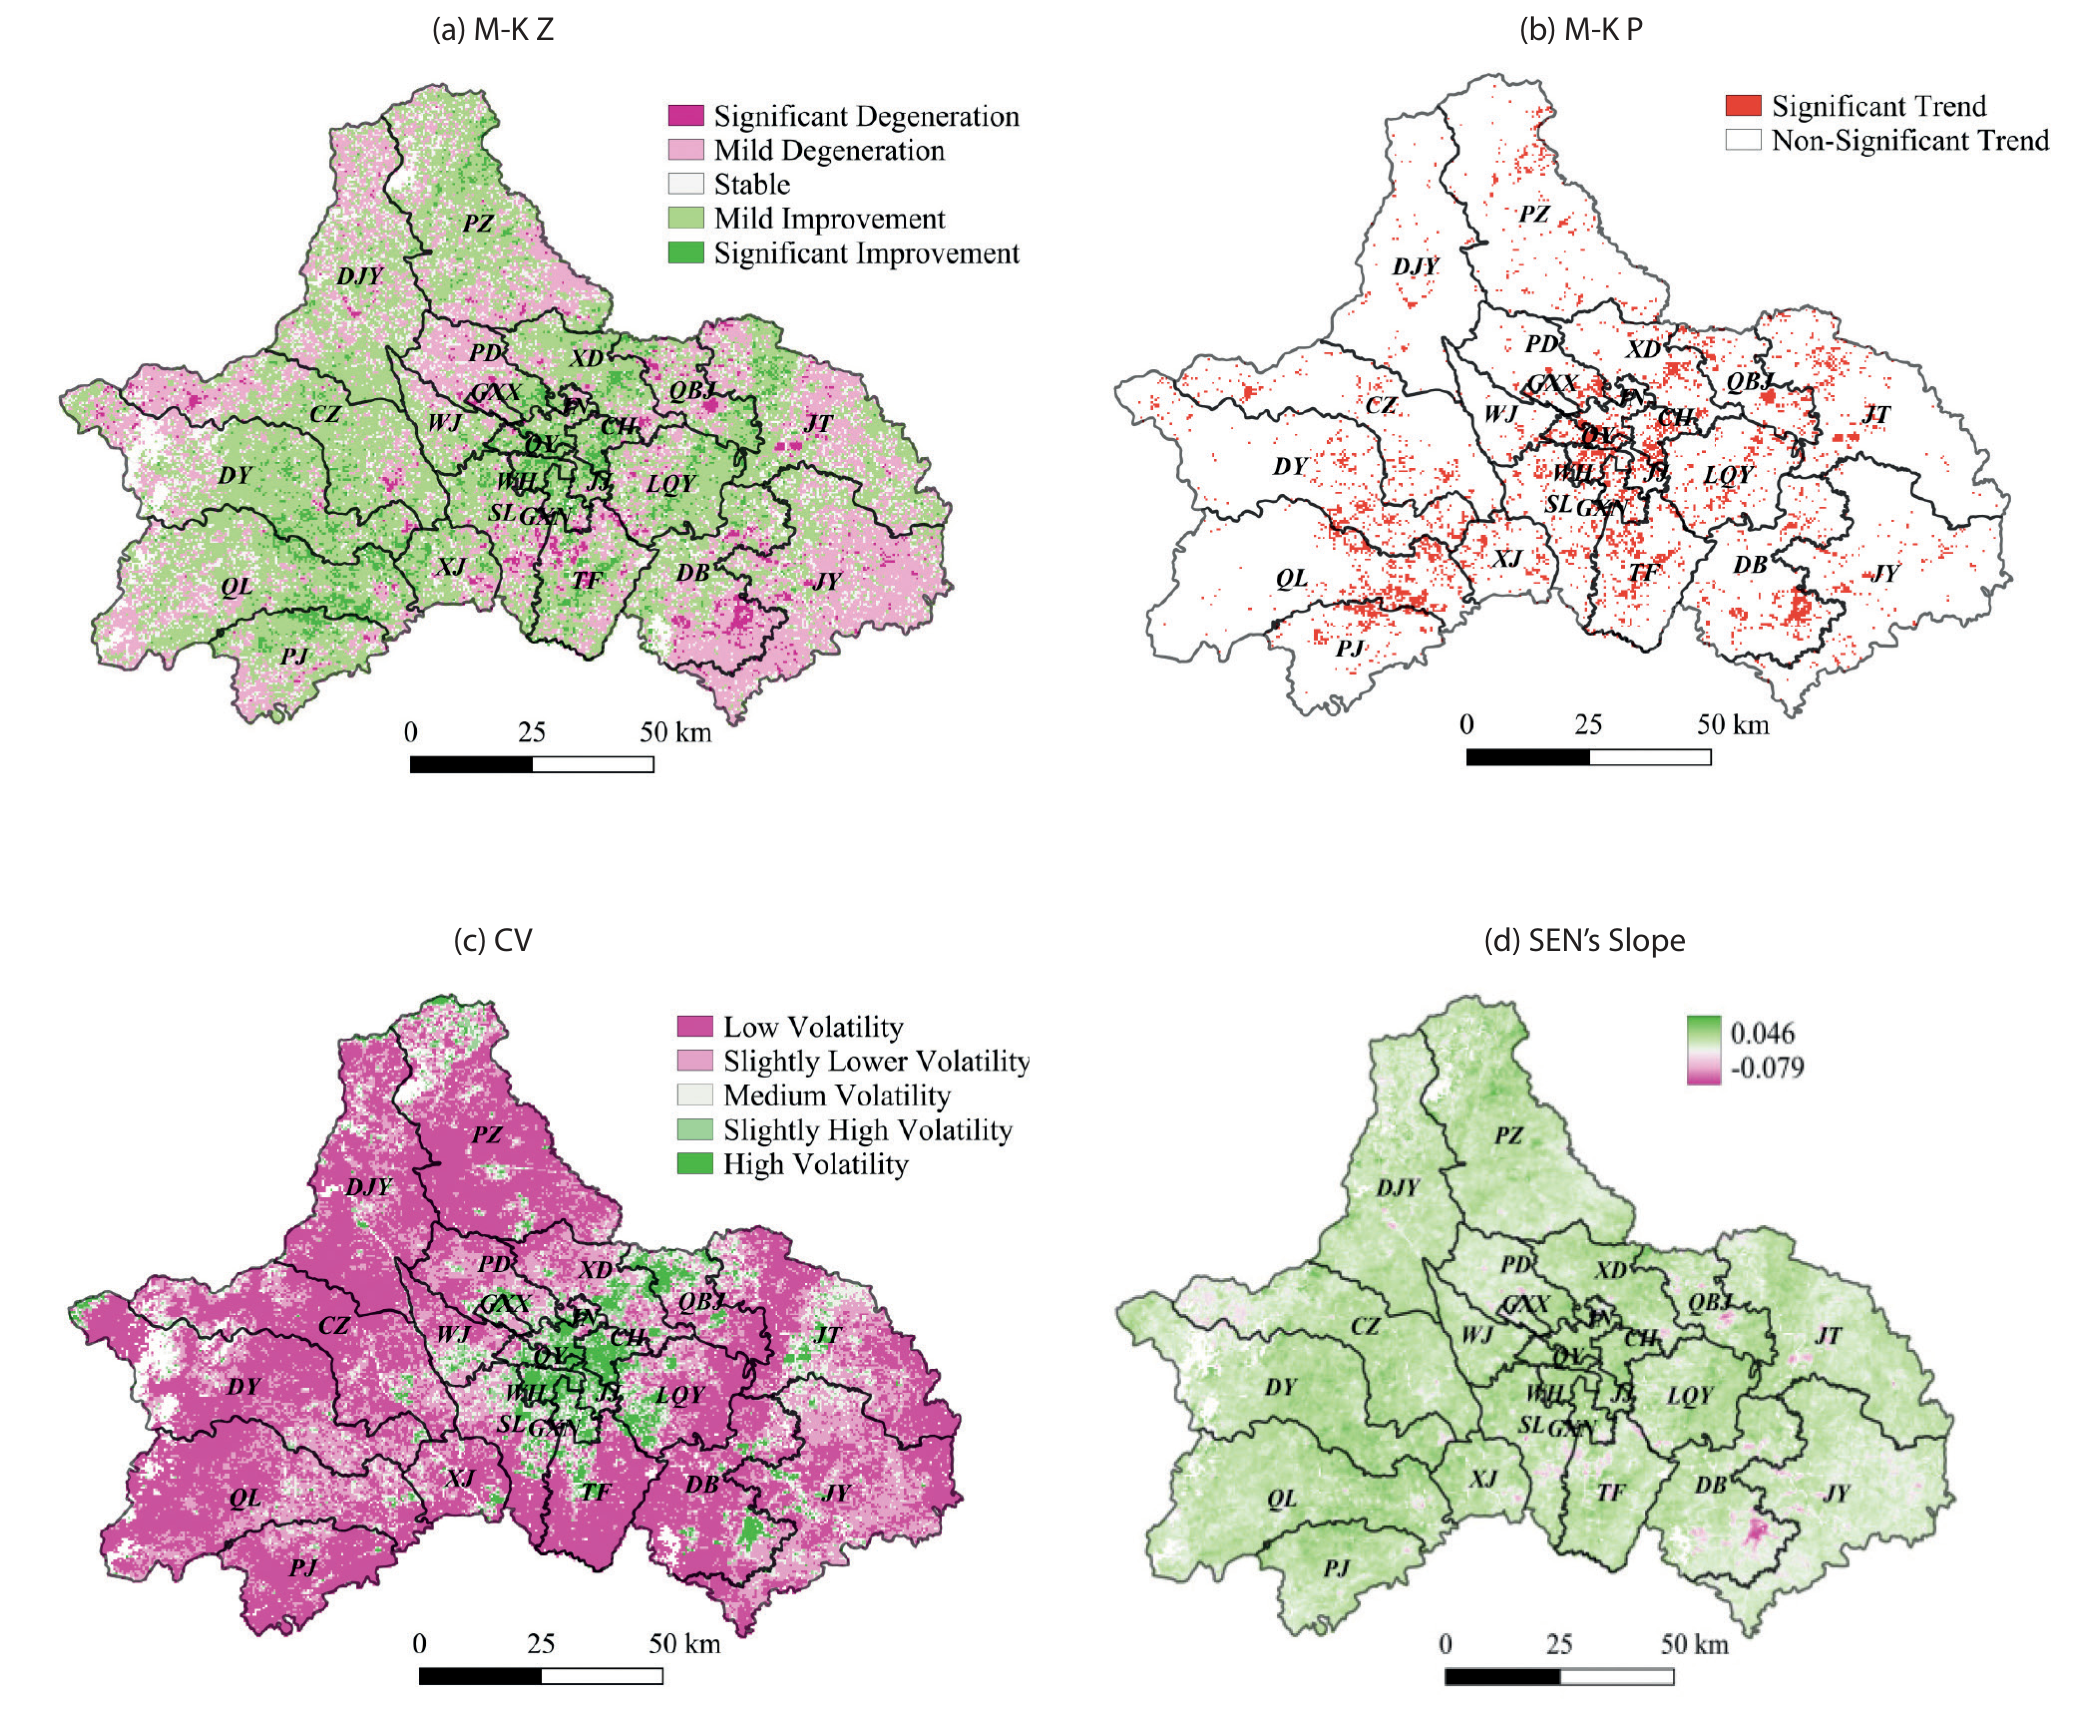
The RSEI is utilized to calculate the CV (Fig. 10c)) of the ecological quality of Chengdu, employing pixel-scale spatial measurements and temporal stability simulations. The resulting CV values range from 0.017 to 2.030, with an average of 0.162. Impressively, more than 90% of these values fall within the range of 0 to 0.31, indicating a predominantly low level of volatility across the city. Based on established grading principles, the spatial distribution of fluctuation levels is determined. Analysis reveals a temporal trend in the fluctuation frequency from 2013 to 2022, ranging from high to low volatility, with the order being low volatility, slightly low volatility, high volatility, slightly high volatility, and moderate volatility. Overall, although high volatility is uncommon, other levels of volatility predominate. Regions with notably high CVs are primarily concentrated in the central urban area of Chengdu and around Chengdu Tianfu International Airport. Urban surface types, particularly buildings and other man-made structures, play a significant role in shaping the local climate and are highly susceptible to human activities. One of the most notable consequences of this interaction is the urban heat island (UHI) effect [51, 52]. This phenomenon occurs when urban areas experience higher temperatures than their rural surroundings, primarily due to the concentration of buildings, roads, and other infrastructure that absorbs and retains heat. In contrast, areas with small CVs, signifying high stability, are concentrated in regions distant from urban development. These areas demonstrate relatively stable vegetation coverage and experience less human interference than other areas. Moderate fluctuation areas are evenly dispersed within transitional zones. This assessment underscores the nuanced dynamics of ecological quality across Chengdu over time, emphasizing the need for comprehensive monitoring and adaptive management strategies to sustainably address fluctuations and ensure environmental well-being.
The M-K test and Sen’s slope estimation results, with a confidence level of α=0.05, are presented in Fig. 10a) and 10b). The results in the Z-value image are classified into five levels: significantly increasing (Z > 1.96), increasing (0.001 < Z < 1.96), no trend (-0.001 < Z < 0.001), decreasing (-1.96 < Z < -0.001), and significantly decreasing (Z < -1.96). Areas of improvement in the ecological environment accounted for 28.5% of the total area of Chengdu. Of these areas, those with significant improvements account for 10.6%, while approximately 42.8% exhibit no significant change. Conversely, areas experiencing a decline in ecological quality cover 28.4% of the total area, with significant decreases accounting for 4.8%. While the areas of improved and decreased ecological quality in Chengdu are nearly equivalent, the overall quality trend displays an upward trajectory. This indicates that Chengdu has successfully balanced the development of the urban environment and ecological quality over the past decade.
According to Sen’s slope estimation (Fig. 10d)), areas of Chengdu that experienced a significant decline in ecological quality over the past ten years are predominantly located in the eastern and southern regions, such as DB, Qingbaijiang District (QBJ), and TF. The evident decline in ecological quality in urban areas is primarily driven by the rapid expansion of cities and the concentrated development of industrial zones. This urban sprawl and industrial concentration lead to several key issues that adversely affect the ecological health of districts and counties. Conversely, areas exhibiting a significant increase are relatively dispersed and lack a distinct agglomeration pattern.
Sustainability Analysis
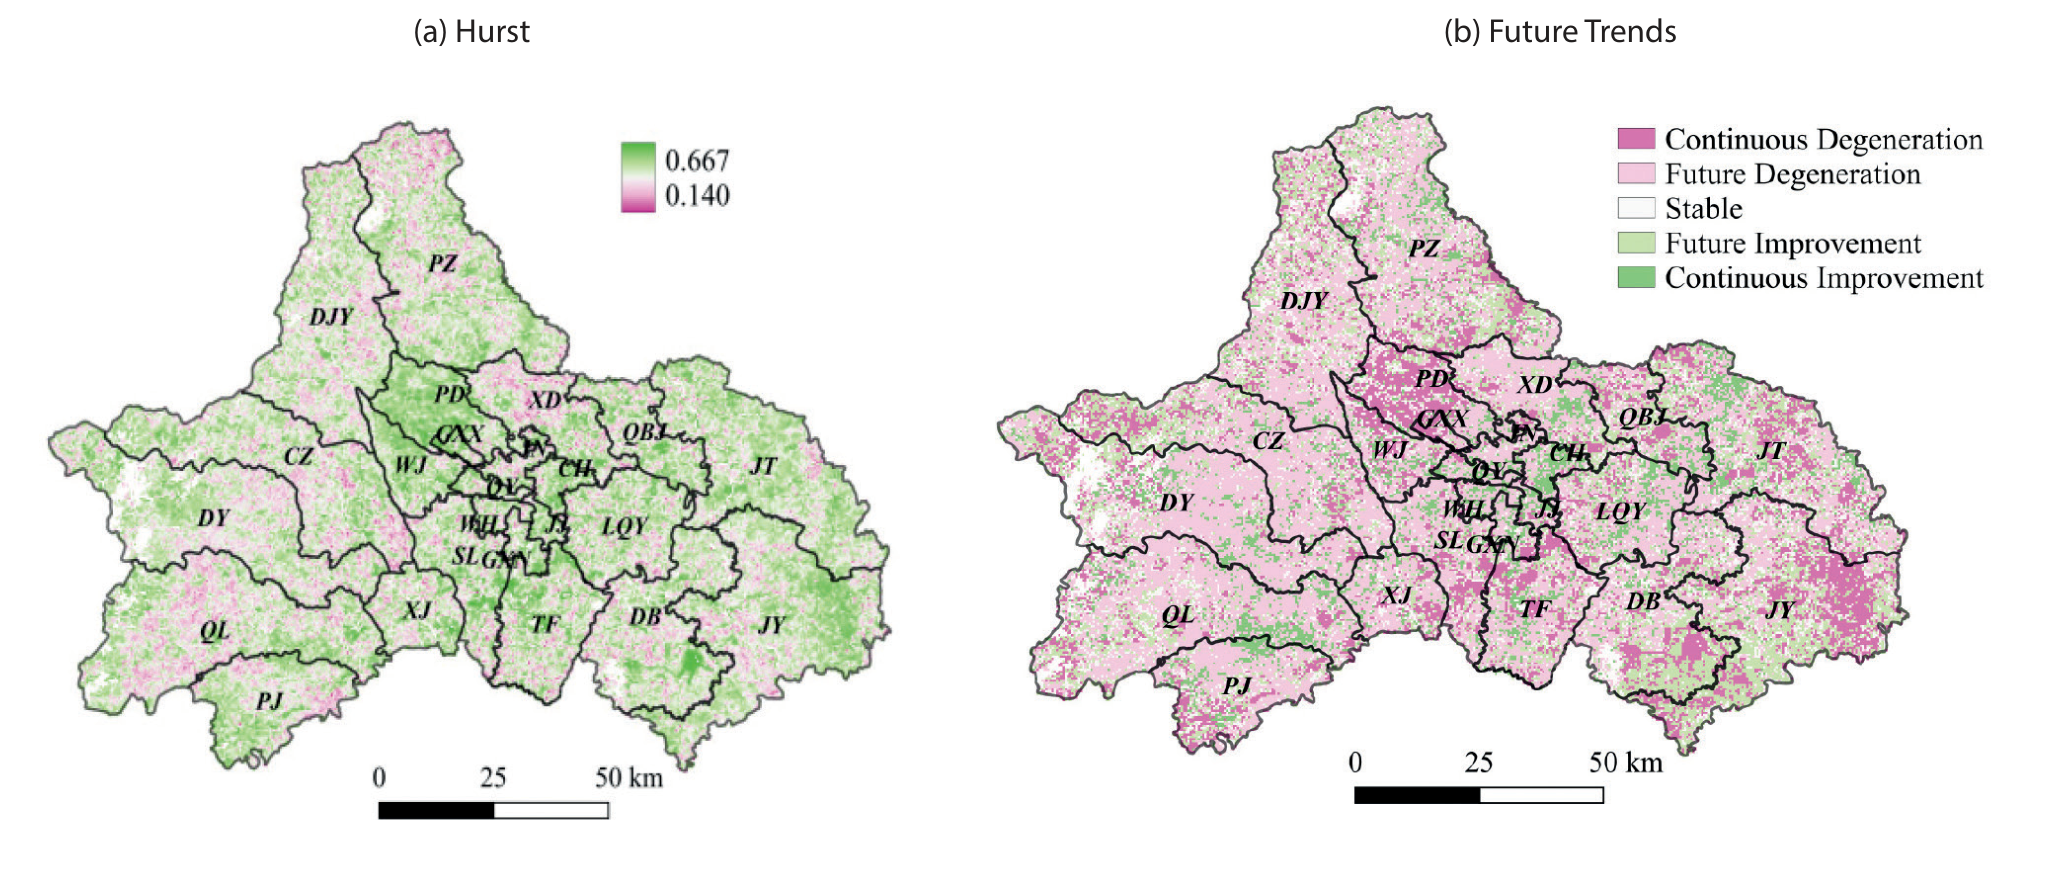
The Hurst index, widely used to evaluate changes in the trends of time series, is applied in a pixel-by-pixel analysis to the RSEI dataset for Chengdu, spanning 2013 to 2022. The results of the analysis, depicted in Fig. 11a), reveal an average Hurst index of 0.45. Interestingly, only 12.8% of the pixels display weak antisustainability (0.25 H < 0.5), with the majority (87%) exhibiting H ≥ 0.5. Of these, 19.3% of the pixels with H ≥ 0.5 display weak sustainability (0.5 < H ≤ 0.75). The remaining 67.7% exhibit strong sustainability (0.75 < H ≤ 1). Additionally, areas demonstrating strong sustainability are primarily concentrated in urban built-up areas and western high-mountain regions in Chengdu.
The Hurst index results are integrated with previous trend test results to assess the sustainability of changes in ecological quality in Chengdu from 2013 to 2022, as depicted in Fig. 11b), which includes five categories: continuous degradation, future degradation, stable, future improvement, and continuous improvement. Regions undergoing continuous degradation are predominantly located in Pidu District (PD), DB, JY, and the northern part of TF; these areas require urgent and significant improvements. Areas anticipated to face degradation in the future are scattered, particularly within the urban built-up areas of each region, emphasizing the importance of ongoing monitoring and corresponding actions to prevent degradation and sustain the current level of ecological quality.
Conversely, regions displaying continuous improvement are primarily distributed in Chenghua District (CH), Qionglai (QL), and the Longquan Mountain region, indicating strong continuity in the future trend of RSEI in Chengdu from 2013 to 2022. The results reflect the continued enhancement of Chengdu’s overall ecological environment.
Limitations and Improvements
Although this study focused on the ecological quality of Chengdu, certain city-specific ecological factors, such as the nighttime light index, population density, and economic indicators, which could significantly impact the urban ecological environment, were ignored. Thus, future studies will aim to enhance and refine the ecological evaluation index system to improve assessments of the quality of the ecological environment in the area. Notably, geographic detectors will be employed to detect and analyze ecological driving factors. The effects of different factors on the urban RSEI will be explored at various spatial scales through partial correlation analysis.
Using autocorrelated and resampled RSEI data at the 1 km scale in this study introduces potential complications due to scale differences. The choice of scale is critical in ecological and environmental studies because it can significantly influence the interpretation of data. In the future, the improved RSEI model for cities and spatial autocorrelation analysis at different resolutions can be used to study the spatial and temporal distributions of the quality in different natural and urban environments.
Conclusions
In this paper, the GEE platform and RSEI are used to analyze the changes in the quality of the ecological environment in Chengdu. Using spatiotemporal data, trend analysis and matrix transfer analysis, changes in ecological indicators in the Chengdu region from 2013 to 2022 are analyzed, and the following conclusions are drawn.
The results of this study show that the average RSEI in Chengdu is between 0.4 and 0.6. Overall, the ecological quality of Chengdu is moderate, and the ecological situation is gradually improving. The distribution characteristics of the RSEI are low in the central urban area and high in the surrounding areas. The area of improvement in the RSEI was larger than the area of degradation over the past decade. The improvement area is mainly located in the eastern part of the study area. The Moran’s I values in 2013, 2017, and 2022 were 0.938, 0.960, and 0.914, respectively. The results show that the ecological quality in Chengdu displays a positive spatial correlation, clustered characteristics, and low randomness. The degree of spatial aggregation first increases and then decreases. H-H clusters are mainly distributed in the western mountainous areas, mainly because these areas have a low urbanization rate and a good ecological environment. L-L clusters are mainly distributed in central urban areas with intensive social activities and industry. In the future, the quality of the ecological environment of Chengdu is projected to continue to improve. Improving the ecological environment is the most effective way to create a livable city. Therefore, Chengdu should continue to attach importance to ecological protection and high-quality economic development, which are important for urban development.

