

Introduction
The global warming and climate change crises have had severe impacts on human survival [1]. While traditional perspectives posit that the tourism industry has lower energy consumption and a minimal ecological footprint [2], recent years have witnessed rapid growth in tourism, making it the world’s largest industry. Consequently, the industry’s adverse effects on the ecological environment have become increasingly apparent [3]. According to the latest research by the United Nations World Tourism Organization (UNWTO) [4], the tourism sector contributes to 4.9% of global CO2 emissions, with a substantial 14% contribution to the global greenhouse effect [3-5]. Furthermore, the CO2 emissions from the world tourism industry are escalating at an annual average rate of 2.5%. In 2019, China recorded staggering numbers of 1.28 billion inbound tourists and 3.61 billion domestic tourists [6]. Such extensive tourism activities inevitably result in significant energy consumption and CO2 emissions, making environmental and climate change issues and their mitigation strategies a crucial concern for all [7, 8].
As early as the 1990s, with global efforts to address climate change and energy issues entering a new phase, the energy consumption and carbon emission issues of the tourism industry attracted attention from relevant organizations and scholars. Since the beginning of the 21st century, research in this domain has deepened. Becken et al. calculated the carbon emissions of the tourism industry in various countries or regions as a crucial aspect of achieving sustainable tourism development. Patterson and Khemiria conducted empirical analyses of energy efficiency and environmental effects in different sectors of the tourism industry [9, 10]. Joe et al., using conceptual frameworks and energy use models, estimated the energy consumption and CO2 emissions levels of the tourism industry in multiple countries and regions [11]. Existing studies have mainly focused on exploring methods or models for calculating energy consumption and carbon emissions in the tourism industry and its sectors, with a predominant emphasis on a specific country or tourist destination. Few scholars have delved into the factors influencing regional tourism carbon emissions at a micro level, such as Liu et al., who explored the impact of factors like energy intensity, tourist consumption levels, and industry scale on tourism carbon emissions in Chengdu, Sichuan Province, China [12]. However, the scope and time series of these studies on the driving forces of tourism carbon emissions are limited, hindering a comprehensive industry-wide examination of tourism carbon emissions and their influencing factors. Therefore, this study aims to primarily employ the Logarithmic Mean Divisia Index (LMDI) model to explore the trends and key influencing factors of China’s tourism carbon emissions from 2011 to 2021. The goal is to provide reliable data support and theoretical references for clarifying the goals and tasks of low-carbon development in China’s regional tourism industry and establishing targeted energy-saving and emission reduction measures.
Experimental
Research Methods
Calculation of CO2 Emissions From the Tourism Industry
The accounting methods for CO2 emissions in the tourism sector are primarily categorized into two major types: “bottom-up” and “top-down.” Considering the absence of a comprehensive tourism satellite account and greenhouse gas emission monitoring system in China, this study predominantly employs the “bottom-up” approach. Drawing insights from empirical studies conducted by Becken et al. and Patterson et al. [9, 10], we identify key areas contributing to CO2 emissions in the tourism industry, namely, tourism transportation, accommodation, activities, and food retail and telecommunications. Utilizing a decomposition and aggregation method, we measure CO2 emissions in the tourism industry through a “bottom-up” perspective. The specific calculation method is outlined as follows:
In the equations provided, Ct denotes the total CO2 emissions from the tourism industry in t year (g). Cjt represents the CO2 emissions from sector j in t year (g), where j can take values 1, 2, 3, or 4, corresponding to tourism transportation, accommodation, activities, and tourism-related food retail and telecommunications, respectively. Specifically, C1t signifies the CO2 emissions from tourism transportation in t year (g), C2t signifies the CO2 emissions from tourism accommodation in year t (g), C3t signifies the CO2 emissions from tourism activities in year t (g), and C4t signifies the CO2 emissions from tourism-related food retail and telecommunications in year t (g).
In the given equation, Cit1 represents the CO2 emissions from tourism transportation in region i for t year. Qitx denotes the passenger turnover of transportation mode x (road, civil aviation, railway, waterway) in region i for t year. measured in passenger-kilometers (pkm). fx signifies the proportion of tourists in the passenger turnover of transportation mode x. In this study, referencing previous research findings and considering expert opinions in the context of China, we determined the values of f for road, civil aviation, railway, and waterway as 13.8%, 64.7%, 31.6%, and 10.6%, respectively. Furthermore, αx represents the CO2 emission factor for transportation mode x. The CO2 emission factors for roads, civil aviation, railways, and waterways are determined as 133,137, 27, and 106 g·pkm-1, respectively.
In the equation, Cit2 represents the CO2 emissions from accommodation in region i in t year (g). Nit denotes the number of bed spaces in tourist hotels in region i during t year, and lit signifies the average occupancy rate of guest rooms in tourist hotels in region i for t year. The parameter β represents the CO2 emission factor per bed space per night, with a specific value of 2.458 g·bed-1·night-1.
In the formula, Cit3 represents the CO2 emissions from tourism activities in region i during year t (g). Cits denotes the number of tourists engaging in tourism activity type s in region i during year t. The parameter γs signifies the CO2 emission factor for tourism activity type s (g·person-1). The emission factors for sightseeing tourism, business tourism, leisure vacation tourism, family visiting tourism, and other types of tourism activities are 417, 786, 1670, 591, and 172 g·person-1, respectively.
In the equation provided, where i represents the type of energy source (coal, kerosene, gasoline, diesel, and fuel oil, totaling five kinds), Ei,j denotes the consumption of the ith type of tourism energy in the jth region. The parameter φ represents the unit standard coal carbon emissions, with a recommended value of φ = 0.67 according to the Energy Research Institute of the National Development and Reform Commission. Ui signifies the conversion coefficient of the ith energy source to standard coal. Ei,t stands for the consumption of the ith energy source in the tth industry, while Ri represents the tourism separation coefficient for the tth industry. O denotes the total economic consumption of the tourism industry in the specified sector, and G signifies the overall economic output of the industry.
LMDI Model
In 1989, Kaya proposed the Kaya Identity, which expresses the relationship between tourism carbon emissions and its influencing factors as a product of terms, enabling the decomposition of factors affecting carbon emissions in the tourism industry. The Logarithmic Mean Divisia Index (LMDI) method, grounded in the solution to the target variable, is a comprehensive index decomposition method that avoids residual generation. By comparing the magnitudes of influencing factors, this method determines the extent to which each factor affects the target variable. The calculation formula is outlined as follows:
In the equation, F represents the energy consumption of the tourism industry, E denotes the total energy consumption in the tourism sector, Y signifies the total tourism revenue, and P stands for the total number of visitors. Additionally, CE, EM, EI, CI, and PS represent the carbon emission coefficients, tourism energy structure, tourism energy intensity, tourism consumption level, and visitor scale, respectively, as decomposed by the model.
According to the LMDI model, the contribution value ΔX of each decomposition factor is:
where C0 is the total carbon emissions of the tourism industry in the base period, and Cn is the total carbon emissions of the tourism industry in the nth period.
The carbon emission effect of tourism is broken down into:
In the equation, ΔCE, ΔEM, ΔEI, ΔCI, and ΔPS respectively represent the carbon emission coefficient effect, tourism energy structure effect, tourism energy intensity effect, tourism consumption level effect, and tourist scale effect decomposed by the model. ΔCE reflects the changing relationship between carbon emissions and fossil energy consumption, highlighting the substitution relationship among fossil fuels. ΔEM indicates the relationship between fossil energy consumption and total tourism energy consumption, illustrating the proportion of various energy consumption patterns in the tourism industry and indicating the rationality of energy consumption structure. ΔEI reflects the relationship between energy consumption and tourism revenue, demonstrating the linkage between input and output. ΔCI represents the relationship between tourism revenue and the number of tourists, reflecting the per capita consumption level of tourists. ΔPS embodies the number of tourist arrivals, reflecting the scale and quantity of tourists.
Data Source
This study draws upon data spanning the years 2012 to 2022 from various reputable sources, including the “China Tourism Statistical Yearbook” and its supplements, the “China Domestic Tourism Sampling Survey,” the “Inbound Tourist Sampling Survey,” the “China Population and Employment Statistical Yearbook,” the “China Transport Yearbook,” the “China Energy Statistical Yearbook,” and the “Statistical Compilation of Sixty Years of New China,” as well as annual tourism industry statistical reports from provinces and regions. In instances where data was incomplete, linear interpolation was applied using adjacent years’ data. Specifically, tourism revenue is adjusted using 2011 as the base year for pricing, employing the price index from the “Third Industry Statistical Yearbook” for the years 2012 to 2022. This adjustment aims to eliminate the impact of inflationary factors, providing a more accurate representation of tourism income over the specified period.
Results and Discussion
Temporal Distribution of Carbon Emissions in China’s Tourism Industry
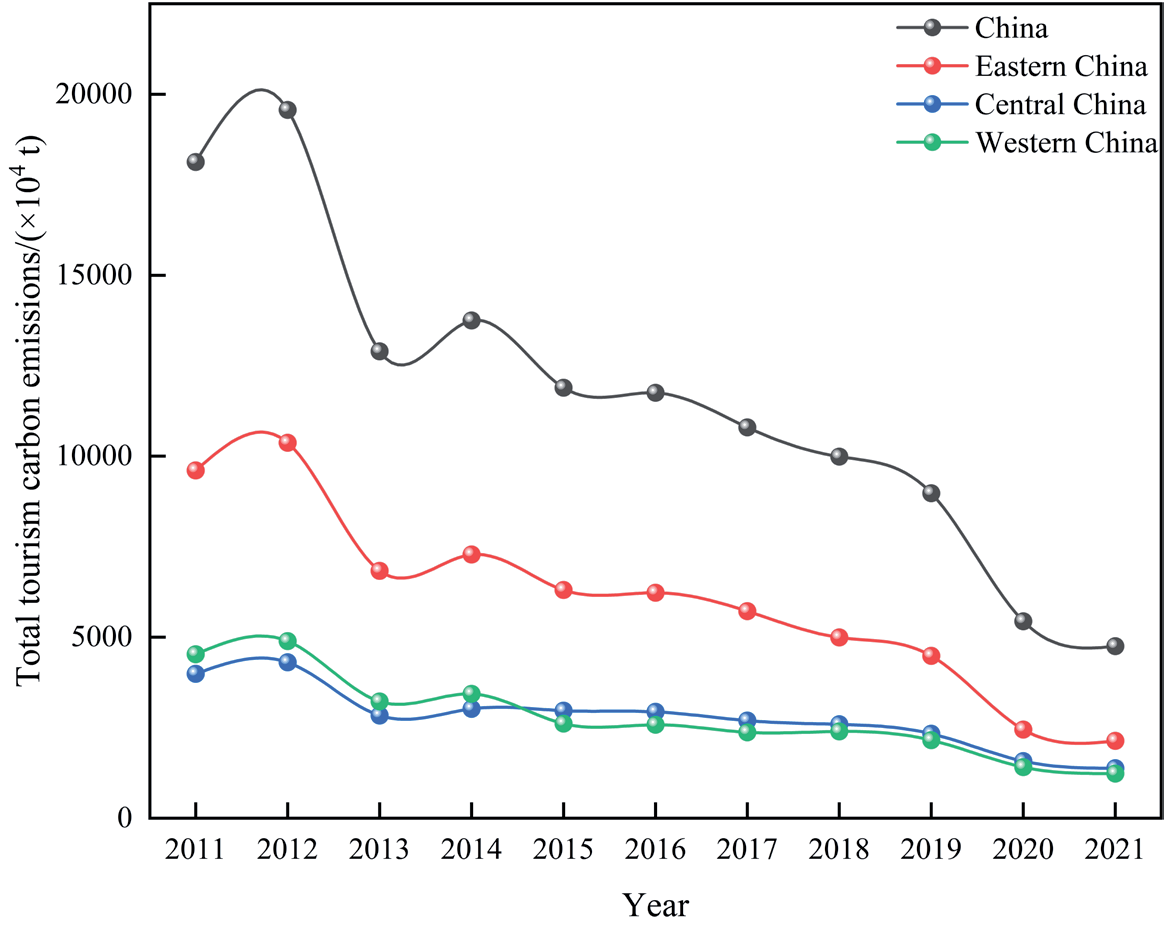
The total carbon emissions from tourism are intricately linked to the developmental trajectory of the industry. Over the period from 2011 to 2021, China witnessed an overall fluctuating downward trend in total tourism-related carbon emissions. The total carbon emissions decreased from 181.26 million tons in 2011 to 47.55 million tons in 2021, representing a substantial decrease of 73.76% (Fig. 1). In 2012, there was a modest increase of 7.95% in China’s total tourism carbon emissions compared to 2011. Subsequently, from 2013 to 2019, the total carbon emissions from the tourism industry in China exhibited a general declining trend. Post-2020, influenced by the COVID-19 pandemic, there was a sharp decline in total carbon emissions from the tourism sector in China. In 2020, China’s tourism-related carbon emissions reached 54.39 million tons, marking a significant decrease of 69.99% compared to 2011.
From a regional perspective, the tourism-related carbon emissions in the eastern region of China generally accounted for 45% to 53% of the national total, while the central region ranged between 22% and 29%, and the western region comprised 25% to 26%. Throughout the period from 2011 to 2021, the proportion of tourism-related carbon emissions in the eastern region exhibited a declining trend, although it remained significantly higher than that in the central and western regions.
The reduction in total carbon emissions from tourism can be attributed to several factors. Firstly, with the growth of the tourism industry in China, there has been a gradual shift towards low-carbon and environmentally friendly travel practices, such as green tourism and shared tourism, resulting in a decrease in carbon emissions [13]. Secondly, the government’s increasing environmental requirements for the tourism sector have led to heightened regulatory measures, promoting the industry’s transition towards a low-carbon and environmentally conscious direction [14]. Thirdly, advancements in technology within the tourism sector, including the application of new energy technologies, have contributed to a reduction in carbon emissions [15, 16].
From a regional perspective, the carbon emissions from the tourism industry in the eastern part of China remain significantly higher than those in the central and western regions. This discrepancy may be attributed to factors such as the economic prosperity of the eastern region, abundant tourism resources, and a higher number of tourists [17, 18]. Concurrently, the tourism industry in the central and western regions is experiencing rapid growth, but their carbon emissions remain relatively lower compared to the eastern region.
Distribution of Tourism Carbon Emission Types
This study reveals, as depicted in Fig. 2, that carbon emissions from tourism transportation (Tt) have consistently been the primary contributors to carbon emissions in the Chinese tourism sector. In 2011, carbon emissions from tourism transportation amounted to 1.52×10⁴ million tons, constituting approximately 84.12% of the total carbon emissions. Although there has been a decline in carbon emissions from tourism transportation in 2016 and 2021, reaching 9.87×10³ million tons and 3.99×10³ million tons, respectively, it remains the major source of carbon emissions in the tourism industry.
Apart from tourism transportation, tourism accommodation (Ta) has also generated a considerable amount of carbon emissions. In 2011, 2016, and 2021, carbon emissions from tourism accommodation were 1.81×10³ million tons, 1.18×10³ million tons, and 0.48×10³ million tons, respectively. In comparison to tourism transportation and accommodation, tourism activities (Ts) and food retail and telecommunications (Others) contribute relatively lower carbon emissions. In 2011, these two sectors collectively produced 1.09×10³ million tons of carbon emissions.
From a regional perspective, carbon emissions in the tourism industry in the eastern, central, and western regions of China follow the pattern of tourism transportation (Tt)> tourism accommodation (Ta)>tourism activities(Ts)>food retail and telecommunications (Others). This sectoral breakdown provides insights into the distinct contributions of various components to regional tourism-related carbon emissions. The findings contribute to a nuanced understanding of carbon emission patterns in the Chinese tourism industry, offering valuable information for sustainable tourism management and policy formulation.
In the pursuit of reducing carbon emissions, mitigating carbon emissions from tourist transportation emerges as the most effective strategy [19, 20]. However, the construction and operation of transportation infrastructure demand significant financial and resource investments, necessitating a delicate balance between meeting tourism demands and curbing carbon emissions [21]. Apart from transportation, accommodations constitute a substantial source of carbon emissions. Thus, promoting eco-friendly lodging options becomes crucial.
Furthermore, optimizing tourism activities, as well as the retail and telecommunications segments, presents substantial potential for carbon reduction. Encouraging the adoption of renewable energy, eco-friendly ingredients, low-carbon foods, and sustainable packaging can contribute significantly. To further diminish carbon emissions within the tourism sector, the implementation of low-carbon technologies, energy efficiency measures, and renewable energy sources should be explored. These actions not only aid in emission reduction but also contribute to energy conservation, cost reduction, and enhanced energy security.
Regarding regional tourism carbon emissions, targeted measures should be employed to balance the developmental needs of each region against carbon emission control objectives. Simultaneously, reinforcing collaboration and information sharing among regions is imperative to better coordinate and manage carbon emissions within the tourism industry.
LMDI Model
Table 1. reveals that from 2011 to 2021, the cumulative effects of carbon emissions, tourism energy structure, and tourism energy intensity are negative, while the cumulative effects of tourism consumption level and tourist volume are positive. Thus, tourism consumption level and tourist volume emerge as the primary factors contributing to carbon emissions, while tourism energy structure and tourism energy intensity (fossil fuel consumption intensity) act as major inhibitors of carbon emission reduction in the tourism sector. Based on the cumulative contribution values of each factor to carbon emissions, the carbon emission coefficient effect has a contribution rate of - 8.54%, the tourism energy structure effect contributes - 50.80%, the tourism energy intensity effect contributes - 40.66%, the tourism consumption level effect contributes 27.46%, and the tourist volume effect contributes 72.36%. Consequently, the tourism energy structure effect and tourist volume effect demonstrate higher contribution rates, highlighting that carbon emissions during tourism primarily arise from the tourism energy structure and the number of tourists.
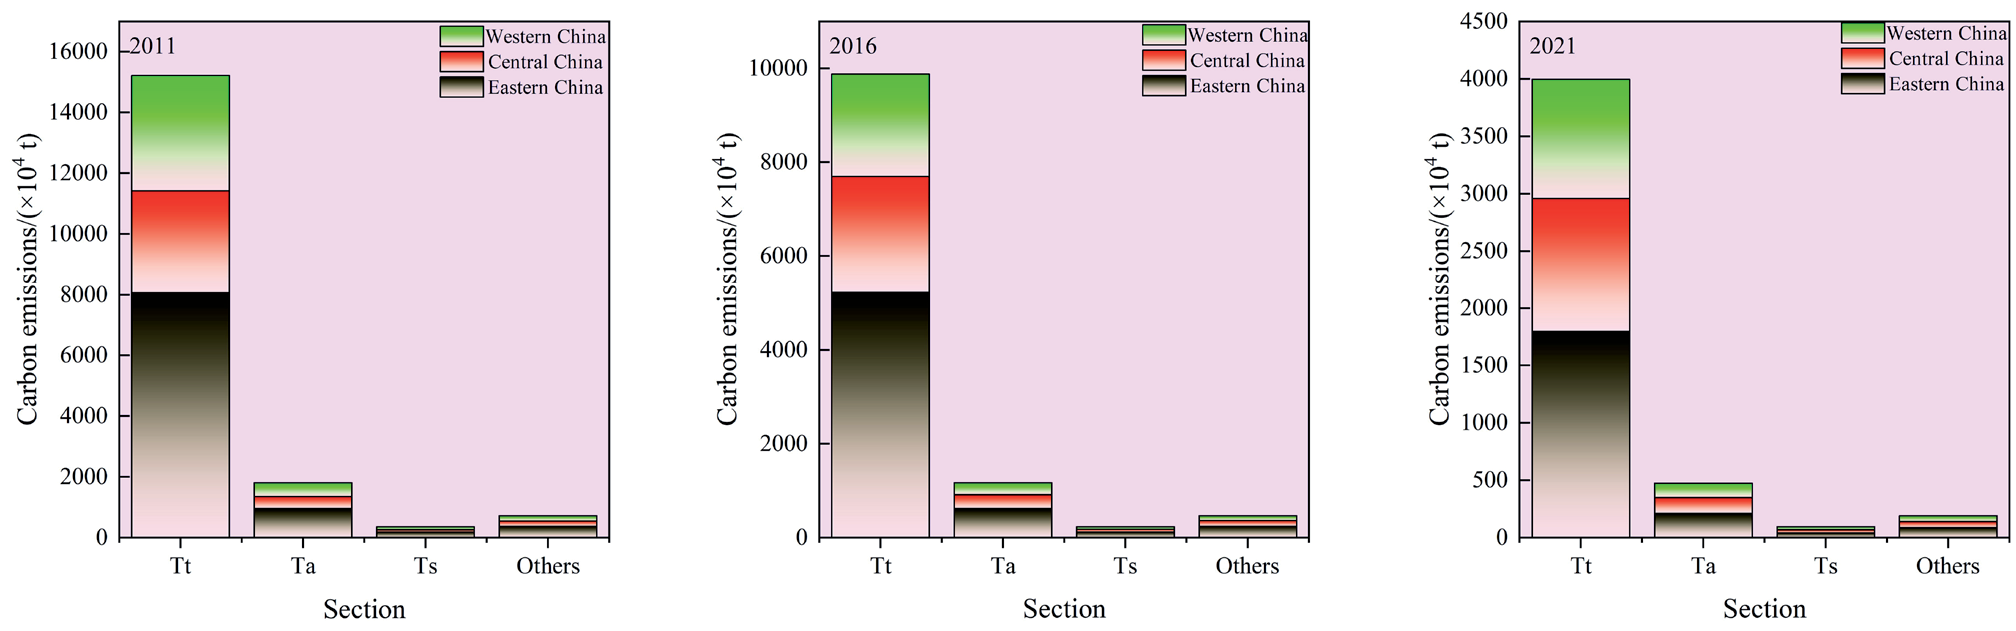
Table 1.
LMDI decomposition results in China’s tourism industry from 2011 to 2021.
Excluding the special impact year of 2020, the sum of tourism industry carbon emission effects from 2011 to 2021 is negative. This suggests an overall declining trend in tourism-related carbon emissions under stable external conditions, with the positive contribution rates of all factors being lower than the negative ones, indicating a continual reduction in future tourism-related carbon emissions. Analyzing the cumulative effects of tourism carbon emissions in Table 1, China’s tourism-related carbon emissions can be categorized into three phases. From 2011 to 2014, carbon emission effects exhibited a declining trend, with the carbon emission coefficient effect making a significant contribution, while the positive impact of tourism consumption level and tourist volume was relatively small. From 2015 to 2017, carbon emission effects increased, primarily due to the significant contribution of the tourist volume effect, driven by an increase in the number of travelers. Lastly, from 2018 to 2021, carbon emission effects declined, with substantial contributions from the carbon emission coefficient effect and the tourism energy intensity effect, while the impact of the tourism consumption level on carbon emissions was minimal.
Conclusions
From 2011 to 2021, the overall trend in total carbon emissions from tourism exhibited a declining pattern. In 2020, there was a significant reduction in tourism-related carbon emissions, primarily attributed to the impact of the COVID-19 pandemic. Broadly, transportation within the tourism sector emerged as the primary contributor to carbon emissions, followed by tourism activities. The national distribution of total tourism carbon emissions revealed regional disparities, with the eastern regions of China demonstrating higher carbon emission levels.
Within the factors influencing the decomposition of tourism-related carbon emissions, the structure and intensity of tourism energy played a suppressive role in carbon emissions. Levels of tourism consumption and the scale of tourists were identified as major contributors to carbon emissions in the tourism sector. Reducing tourism-related carbon emissions necessitates a continual optimization of energy structures, including an expansion of the use of new energy sources, as well as an enhancement of the quality and efficiency of accommodation services, with an emphasis on increasing room occupancy rates.
Despite fluctuations in contributing factors, notably influenced by the impact of the COVID-19 pandemic in 2020, factors such as tourism consumption levels, energy consumption intensity, and tourist scale exhibited significant impacts on carbon emissions. The substantial reduction in tourism-related carbon emissions in 2020 was primarily attributed to decreases in tourism consumption levels and tourist numbers. When tourism consumption and the number of tourists negatively impact carbon emissions, tourism energy intensity becomes a key determinant.

