

Introduction
Globally, environmental issues have come to the forefront, making it crucial to address the problems of environmental pollution, ecological catastrophes, energy, and food security in increasing awareness for sustainable development. For China in particular, environmental protection is of paramount importance in the commitment to promote green economy and sustainability.
The Yellow River Basin (YRB) holds great practical significance to the sustainable development of the whole country due to its prominent environmental and ecological issues that need to be addressed. Yet, it holds strategic importance as an essential hub for the production of both agricultural and energy goods in China to safeguard the country’s food and energy security, which is highly related to SDGs 2, 6, and 7. It is the fifth longest river in the world, flowing through nine provinces in China and covering about 47.47% of China’s land area1. Nine out of the 14 large-scale coal production bases in China are situated along the river, making it the location with the most economically recoverable coal resources and outputs in the country [1]. Additionally, the basin has 41.1 million hectares of arable land and grassland, along with two million hectares of wasteland suitable for forestry [2]. Notably, from 2002 to 2020, the grain output accounted for almost 34% of the total national production2.
The YRB area faces serious ecological and environmental problems. One significant factor that limits the improvement of sustainability is the contradiction between protecting and restoring water resources and the development of local major industries. This contradiction is evident in the unbalanced and uncoordinated relationship between the water, energy, and food sectors, as both the energy and food production sectors in the YRB require huge amounts of water supply. The YRB predominantly consists of arid and semi-arid land with an average annual rainfall of only 200 mm to 350 mm and high evaporation rates reaching up to 2000 mm, making it unable to fully support the development of agriculture and energy [3]. Agriculture itself utilizes approximately 70% of the water resources, leaving only a small fraction for ecological purposes3. The competition for water resources is thus intense among different sectors in the YRB. This imbalance raises concerns about the need to reallocate water to economically and ecologically productive sectors, which could negatively impact the food sector, especially in water-stressed provinces.
Furthermore, the YRB faces significant pollution problems, which could mostly be attributed to the development of the energy industry. In 2020, the discharge of wastewater in the YRB reached 5.60 billion m³, accounting for 9.8% of China’s total discharge [4]. The annual discharge of chemical oxygen demand accounts for approximately 7% of the national total. However, only 48.6% of the water in the streams and main tributaries meets the quality standard [5]. Approximately 37% of the Yellow River’s water-carrying capacity bears more than 91% of the river’s pollution load, causing serious overloading in the main water functional areas, which puts immense pressure on water pollution control and environmental risk prevention in the YRB [6].
In short, achieving sustainable development requires balancing and coordinating the development of the water, energy, and food sectors in the YRB. The WEF theory is an appropriate framework for analyzing sustainability, as it emphasizes recognizing the interconnection of these three sectors as a whole system that aims to reduce resource competition and wastage. The theory acknowledges the close relationship between water, energy, and food resources used by the agricultural, industrial, and urban sectors, along with their influence and feedback mechanisms, allowing the nexus to quantify future patterns of sustainability.
The WEF hypothesis was first proposed at the Bonn conference in Germany in 2011 and has become a hot topic in the domains of environmental science, system engineering, and economics [7]. Numerous academics have endorsed this theory [8–13]. Moreover, to assess the benign degree of the food, energy, and water sectors, several academics [14–17] suggested that the coupling and coordination degree (CCD) can effectively evaluate sustainability by gauging the state of the development of the WEF nexus. Therefore, in accordance with the actual situation in the YRB, this study utilized the CCD to represent the development of the WEF nexus.
In the face of deteriorating environmental conditions and the urgent need for sustainable development, more resources are being allocated to improve local sustainable development. As a response, many financial investments have been made in projects and initiatives that support sustainable development, environmental protection, and regulations, which collectively fall under the umbrella term of green finance [18]. Normal finance, in pursuit of high returns and institutionalization, is prone to the provision of low-cost loans to highly polluting companies. This has accelerated the deterioration of environmental quality [19]. Contrary to that, green finance places a greater emphasis on the benefits of the ecological environment and the industries that protect it [20]. Some research has attempted to empirically validate the impact of green finance on environmental quality. Existing studies generally confirm that green finance contributes to improving the environment and sustainability by offering support and direction to stakeholders, which creates a win-win situation between the economy and the environment [21–23]. These studies show that green finance not only helps alleviate environmental problems but also has a positive impact on the economy. By channeling financial flows into environmentally friendly projects, green finance helps to create jobs, improve resource efficiency, and promote the growth of low-carbon and renewable energy sectors. However, it is yet unknown whether this phenomenon also applies to the YRB. Based on the Scopus database, there is no study conducted in a similar locality that examined the relationship between green finance and environmental quality locally under the environmental Kuznets curve (EKC) scheme.
The EKC is a theoretical model that is used to describe the relationship between environmental quality and economic growth. By taking into account the role of green finance, we can gain a deeper understanding of the potential impact of green financial investment on environmental quality and its interaction with economic growth. This will provide useful information for the development of more targeted policies and strategies to find a balance between environmental protection and economic growth to achieve the goal of sustainable development.
According to EKC [24], there is an inverted U-shaped interconnection between economic development and environmental degradation. Some scholars questioned its existence since the model does not take into account important macro factors. Therefore, a few scholars have incorporated the green finance variable into the analysis [25, 26]. However, these studies only utilized single pollution indicators like CO2 emissions or waste discharge to represent the environment, which could not comprehensively measure the research variable. The same situation also applies to the green finance variable. Apart from the primary variables, relatively less consideration has been given to other factors that influence environmental quality when investigating the relationship. Besides that, most studies concentrated their research on one transmission mechanism within industrial upgrading, environmental regulation, green innovation, or other mechanisms. Past research had scarcely examined and compared the three mechanisms simultaneously.
To investigate the role and influence mechanism of green finance, this study first constructed comprehensive index systems to measure environmental quality and green finance using data from 2004 to 2019 in the YRB by innovatively utilizing the WEF CCD to represent environmental quality, as it is particularly suited to the YRB context. The growing trend and its spatial characteristics are stated according to Moran’s I index. Beyond the realm of green finance, this article provides a more comprehensive consideration of the impact of economic, climatic, urbanization, population density, forest coverage, and educational factors on environmental quality compared to the existing literature. Lastly, this study examined the mechanisms of green finance influencing WEF CCD, industry upgrading, environmental regulation, and green innovation simultaneously. It aims to fill the gaps in former studies to more comprehensively examine the impact of green finance on environmental quality by integrating multiple factors, mechanisms, and diverse environmental indicators. The goal is to provide more comprehensive findings that can figure out the mechanism of green finance on environmental quality in support of local sustainable development and the promotion of a win-win harmony between the economy and the environment.
Literature Review and Hypothesis
The mechanisms of green finance’s role in promoting sustainable development could be mainly categorized into three main aspects: guiding and stimulating industrial upgrading, environmental regulation, and green innovation.
In China, green finance plays a significant role in resource allocation, particularly in influencing the improvement of the industrial structure through the financial sector. However, its direct impact on the industrial structure is more evident in partial intermediation [27]. Notably, green finance is a major factor that encourages industry structure upgrades in China, with the second industry showing the strongest correlation, followed by the tertiary industry. Simultaneously, industry upgrading can also promote green finance in the opposite direction [28]. Moreover, the consistency between the industrial structure and the level of green finance development is stronger in eastern China [29].
Green finance also has a positive role in sustainability through environmental regulation. Empirical findings indicate that green financing, along with green technical advancement and environmental regulation, is a key driver of sustainable growth in the Chinese economy [30]. Environmental regulation refers to a series of rules, guidelines, and procedures created to safeguard and manage the environment and its resources, with the ultimate purpose being the protection of both current and future generations’ health and ensuring the sustainable use of natural resources [31]. Research on the effects of green finance legislation suggests that administration and public-oriented environmental regulations, rather than market-oriented ones, strengthen the impact of green finance on carbon emissions [32]. In situations with a certain degree of shadow economy, stricter environmental regulation aids in reducing pollution [33].
Additionally, in market-oriented situations, the ultimate impact of green finance on environmental quality depends on whether green finance can attract social capital from high-energy-consuming and high-polluting industrial projects to flow into low-energy-consuming and low-polluting green projects [34]. Economist Pigou stated that when positive or negative externality arises, it is not feasible to achieve the optimal allocation of social resources through the complete use of market mechanisms [35]. A dynamic green financial market could be necessary for reducing externality. In a competitive market, Pigovian taxation may be efficient, regardless of whether the entire tax payment equals the total damages at the optimal level [36]. A system known as cap-and-trade indicates a scheme for trading carbon emission permits that aims to pursue emission reduction [37]. It places a maximum emission requirement and can be described as a market-based strategy to lower total pollution emissions and promote corporate investment in energy efficiency and fossil fuel substitutes [38]. Green finance has encouraged the increase in the proportion of renewable energy in China’s overall fuel mix, accelerating the transformation of the country’s energy industry [39]. Various financial products in the green finance market, such as environmental funds, weather derivatives, nature-related securities, and ecological options, can contribute to reducing pollution emissions. Market-oriented mechanisms like emissions trading, green securities, and green credit are driving forces behind this association, which has proven to be favorable. It was also found that green finance is positively impacted by environmental rules through either short-term or long-term external financing [40].
Moreover, ‘green innovation’, which refers to technology innovation aimed to reduce the detrimental effects of production-related activities on the environment (e.g., pollution control, energy conservation, carbon emission intensity reduction, and trash recycling), plays a crucial role in sustainable development [41]. However, due to its high uncertainty and low returns, green innovation often faces funding restrictions. Nevertheless, many scholars recognize a strong positive association between green finance and green innovation [42–44]. Green development is primarily fueled by green finance, with green innovation serving as a key strategy. This highlights the crucial role of green finance in green development, with the western and central areas of China experiencing the greatest effects [45]. Additionally, green finance policies can significantly mitigate the effects of financial limitations on green inventions [46].
Based on the literature, the following assumptions could be considered valid.
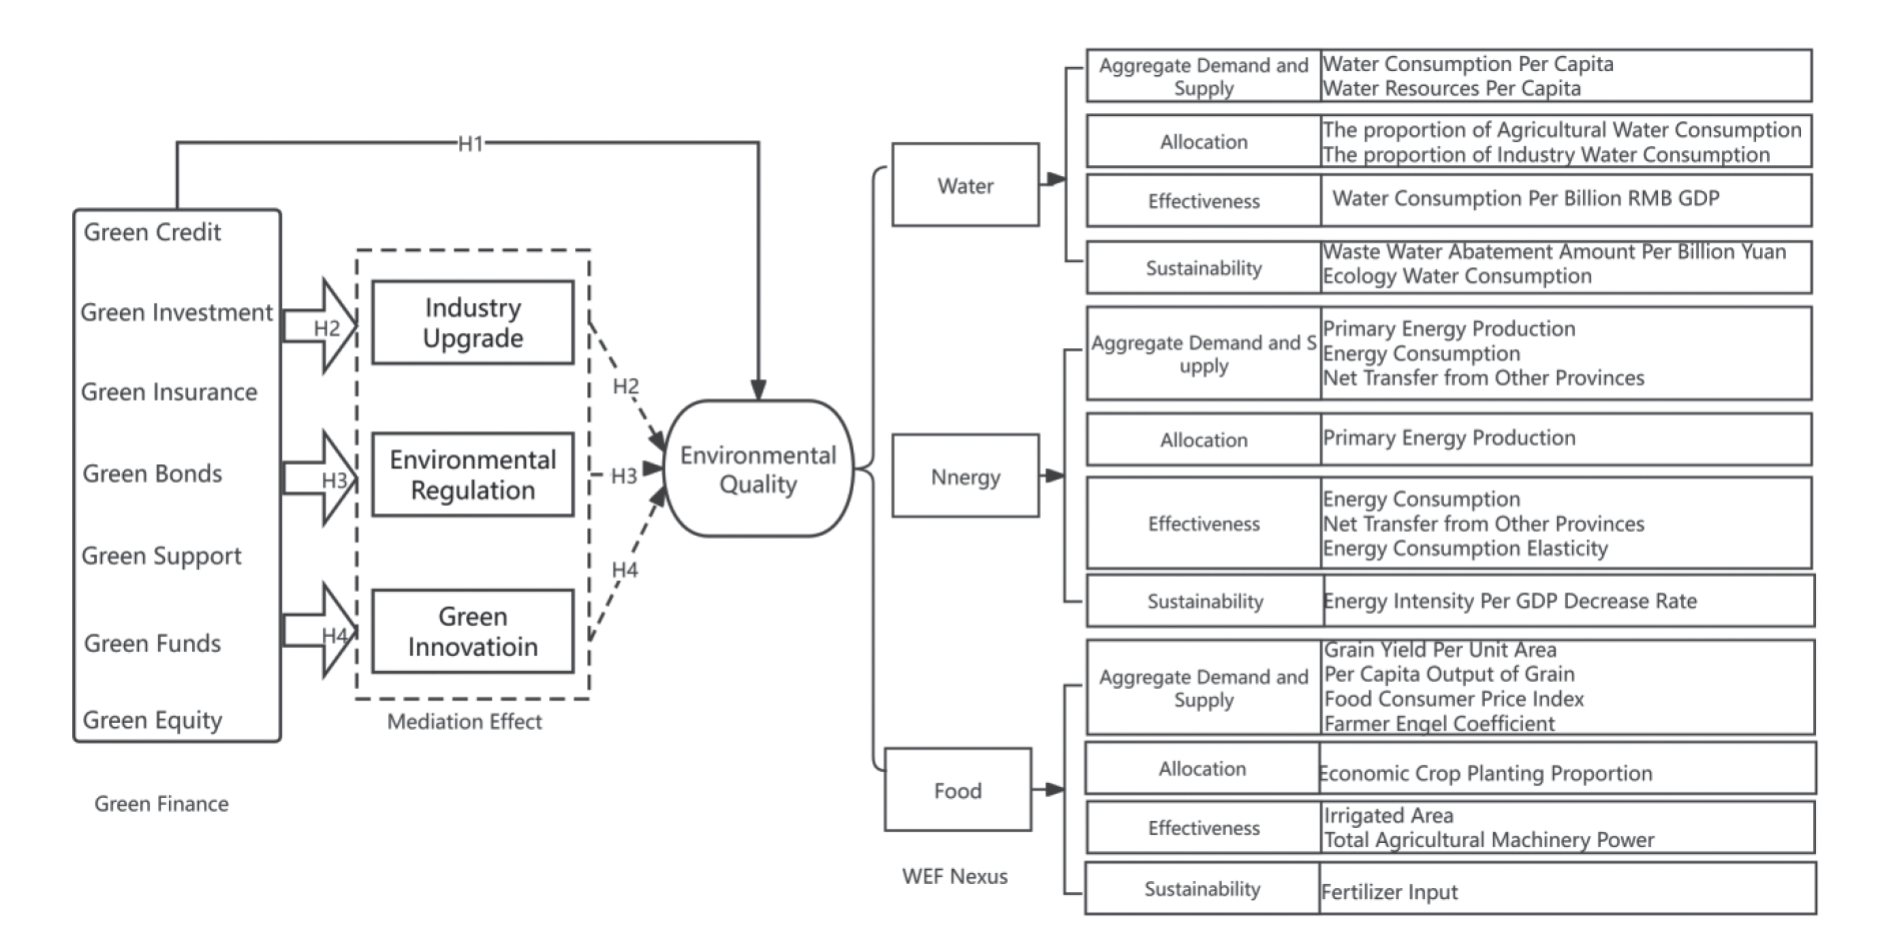
H1: Green finance can contribute to environmental quality enhancement.
H2: Green finance can facilitate environmental quality improvement by stimulating industrial upgrades.
H3: Green finance can facilitate environmental quality improvement through strengthening environmental regulation
H4: Green finance can facilitate environmental quality improvement via incentivizing green innovation.
Accordingly, this article constructed a conceptual framework between green finance and environmental quality as demonstrated in Fig. 1 with hypotheses included.
Materials and Methods
Variables and Data
This study utilized balanced panel data consisting of WEF CCD, real per capita GDP, green finance index, sunshine duration, urbanization rate, forest coverage rate, population density, and education. To address the issue of heteroscedasticity, the population density was transformed into its natural logarithms, as its value was significantly larger than that of other variables. Additionally, all indicators related to prices were adjusted for inflation, with 2003 being recognized as the base year. Consequently, the study obtained a long panel dataset covering nine provinces of the YRB from 2004 to 2019.
Dependent Variable
WEF CCD, which stands for Water-Energy-Food Coupling and Coordination Degree, is a measurement index system that calculates the coordination degree among the water, energy, and food sectors, enabling the assessment of their degrees of harmony. The model’s equations produce degree values ranging from zero to one, whereby a degree value closer to one indicates a more significant synergistic and integrated influence across the systems. Conversely, a value closer to zero suggests the opposite [47]. As shown in Equations (1) [48], W(w), E(e), and F(f) were the comprehensive evaluation indices of water, energy, and food systems. αi, βi and γi were the weights of sub-systemic indicators estimated by the AHP-CRITIC method. wi, ei, and fi were the dimensionless data values of indexes. In terms of the specific index system, please refer to Fig. 1 [49].
Where,
Table 1.
The Construction of an Indicator System of Green Finance.
Main Independent Variable
Green finance was the independent variable of this study. Drawing on the works of Zhang et al. [50] and Lv et al. [51], this study selected seven indicators to construct an indicator system for evaluating green finance development based on different attributes.
As evident in Table 1, all seven indicators were conducive to the development of green finance. This study utilized the Entropy Weight Method to determine the weight of the indicator [52].
Control Variables
Per capita real GDP (GDP). Per capita real GDP is an appropriate indicator of economic growth [53]. In this study, this variable was used to describe overall economic growth, with 2003 as the base year for calculation. According to the EKC theory, in the process of economic growth and development, the environmental quality would initially decline and then rise if evaluated through environmental degradation indicators, resulting in an inverted U-shaped curve [54]. Following Dinda’s empirical study [55], this study adopted the squared and linear terms of per capita real GDP as explanatory variables. Rather than using a pollution variable, which is typically used to represent environmental degradation, this study utilized a comprehensive index, WEF, which indicates environmental improvement. As a result, the relationship between GDP and WEF CCD is assumed to be U-shaped.
Sunshine duration. Climate change is one of the crucial factors affecting the environment and sustainability [56]. In this study, sunshine duration, an index that quantitatively measures the intensity and duration of solar radiation, is used to represent climate change [57]. Since more sunshine duration implies less rainfall, more evaporation, and a drier climate, the predicted sign of this variable should be negative. Average daily sunshine duration was utilized in this paper.
Urbanization rate. With the continued growth of the economy and society, human activities can significantly influence both the natural surroundings and sustainable potential [58]. Urbanization land use is one of the main variables indicating human activities that impact environmental quality [59]. Thus, in this study, it was assumed that the sign of this variable is negative, as urbanization development may strain the sustainable process.
Forest coverage. Numerous studies emphasized and exemplified the importance of forest coverage in biodiversity, ecosystems, and global warming [60, 61]. A higher forest coverage rate is highly assumed to be beneficial to climate, soil, and water conservation, thus positively impacting WEF CCD.
Population density. Population density is recognized as positively correlating with CO2 emissions, meaning it can adversely influence climate and environmental quality [62].
Mean years of schooling. Education status is believed to reflect an awareness of environmental protection. Lucas’s study [63] found limited evidence that science education has successfully advanced awareness of preserving the environment. This study assumed that a higher education level increases the probability of accepting more environmental education, leading to improved awareness and behavior in resource protection. Referring to UNESCO [64], mean years of schooling were used in this study to indicate education, and it was calculated using Equation (2), where, POprimary, POjunior, POcollege, PO6above, represented the population of primary education being the highest level attained, the population of junior high school graduates, the population of high school and technical school being the educational background, the population of college and above being the highest degree achieved, and the population aged six and above, respectively.
Table 2.
Descriptive statistics of each variable.
Data Description
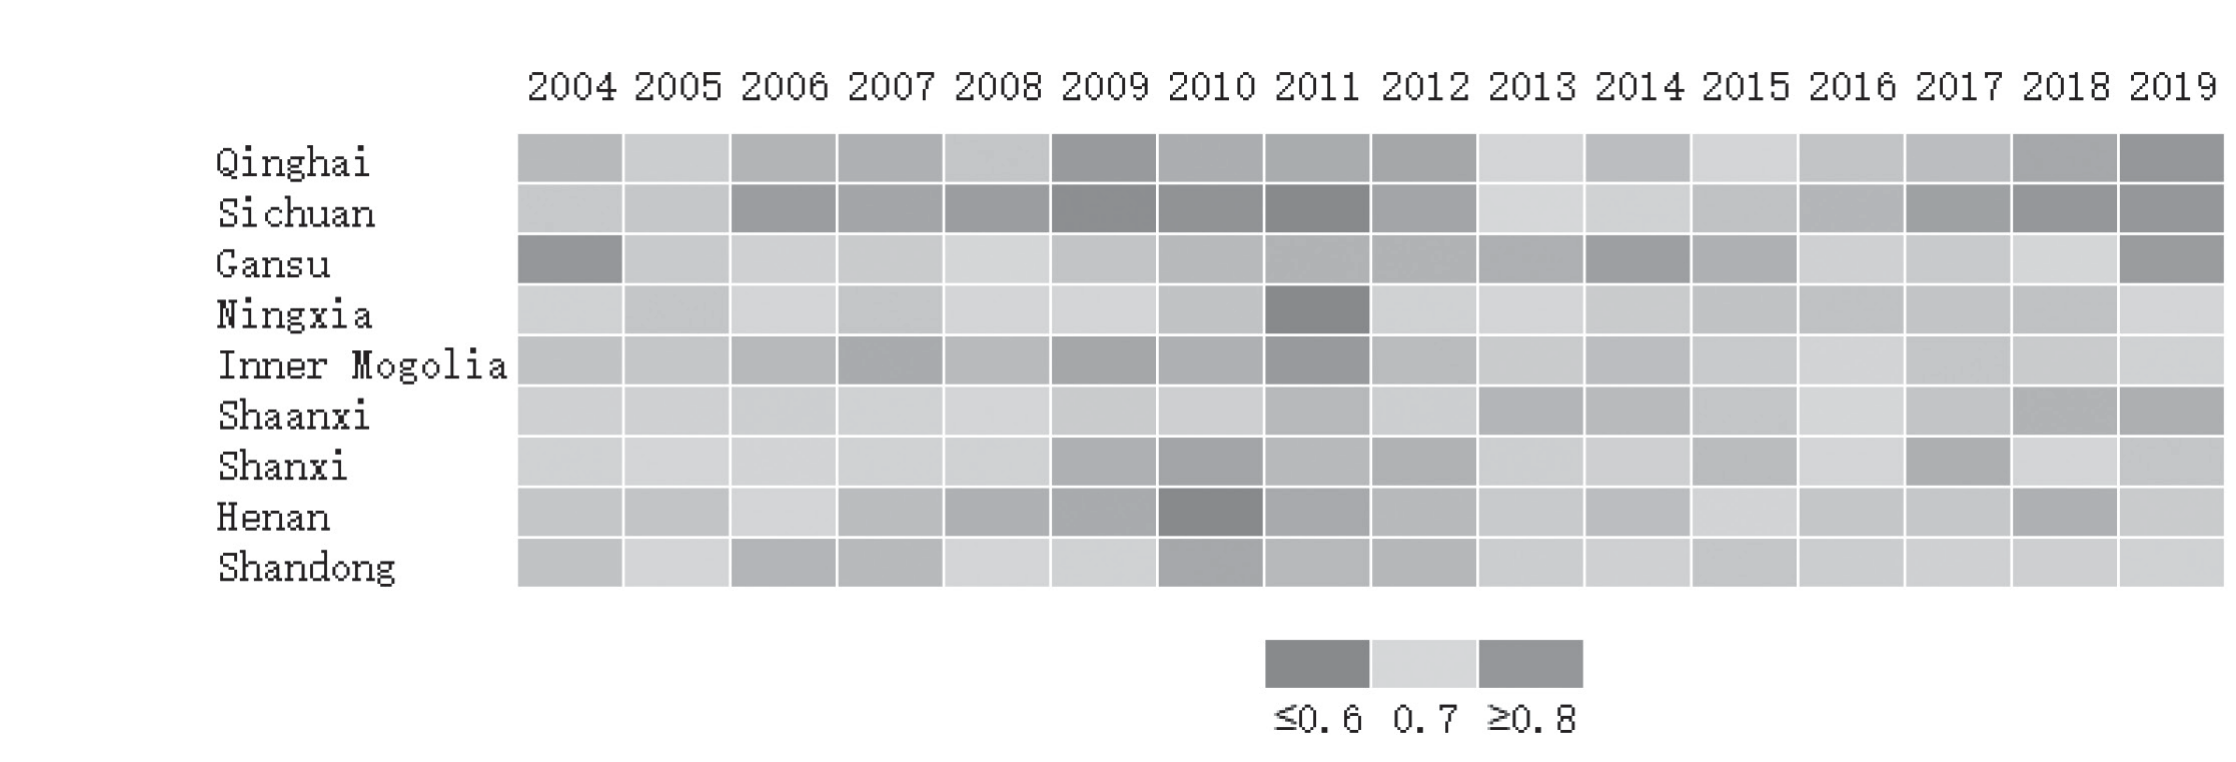
In this section, Table 2 presents the descriptive statistics of the variables used in this study. Fig. 2 to 4 display the data characteristics of WEF CCD and the green finance index, which are the most important variables. Additionally, Table 3 shows the results of the Variance Inflation Factor (VIF) for the variables.
As shown in Fig. 2, the WEF CCD fluctuations, even though the overall trend in the YRB showed a growing characteristic, only Qinghai, Sichuan, and Gansu achieved a relatively high level (≥0.8). Due to the location and scarcity of water resources, the middle and lower strata of the YRB experience greater pressure for WEF nexus improvement.
The energy supply in China remained heavily reliant on coal, despite some progress in developing renewable energy sources over the past decade. According to Yang and Xu [65], the coal consumption rate in China has reached a plateau of about four billion tons per year and is expected to remain stable for the next 10 years. Consequently, the provinces with abundant coal resources in the middle reaches continue to face intense pressure for coal mining to sustain stable economic growth.
Meanwhile, the tidal area of the lower Yellow River, which is responsible for producing one-third of the national grain output, is an essential food-producing region. It also serves as an economic powerhouse with a diverse range of industries. The conflict that arose from high water demand and limited water resources is extremely acute in this region, leading to difficulties in coupling and coordinating the development of water, energy, and food sectors.
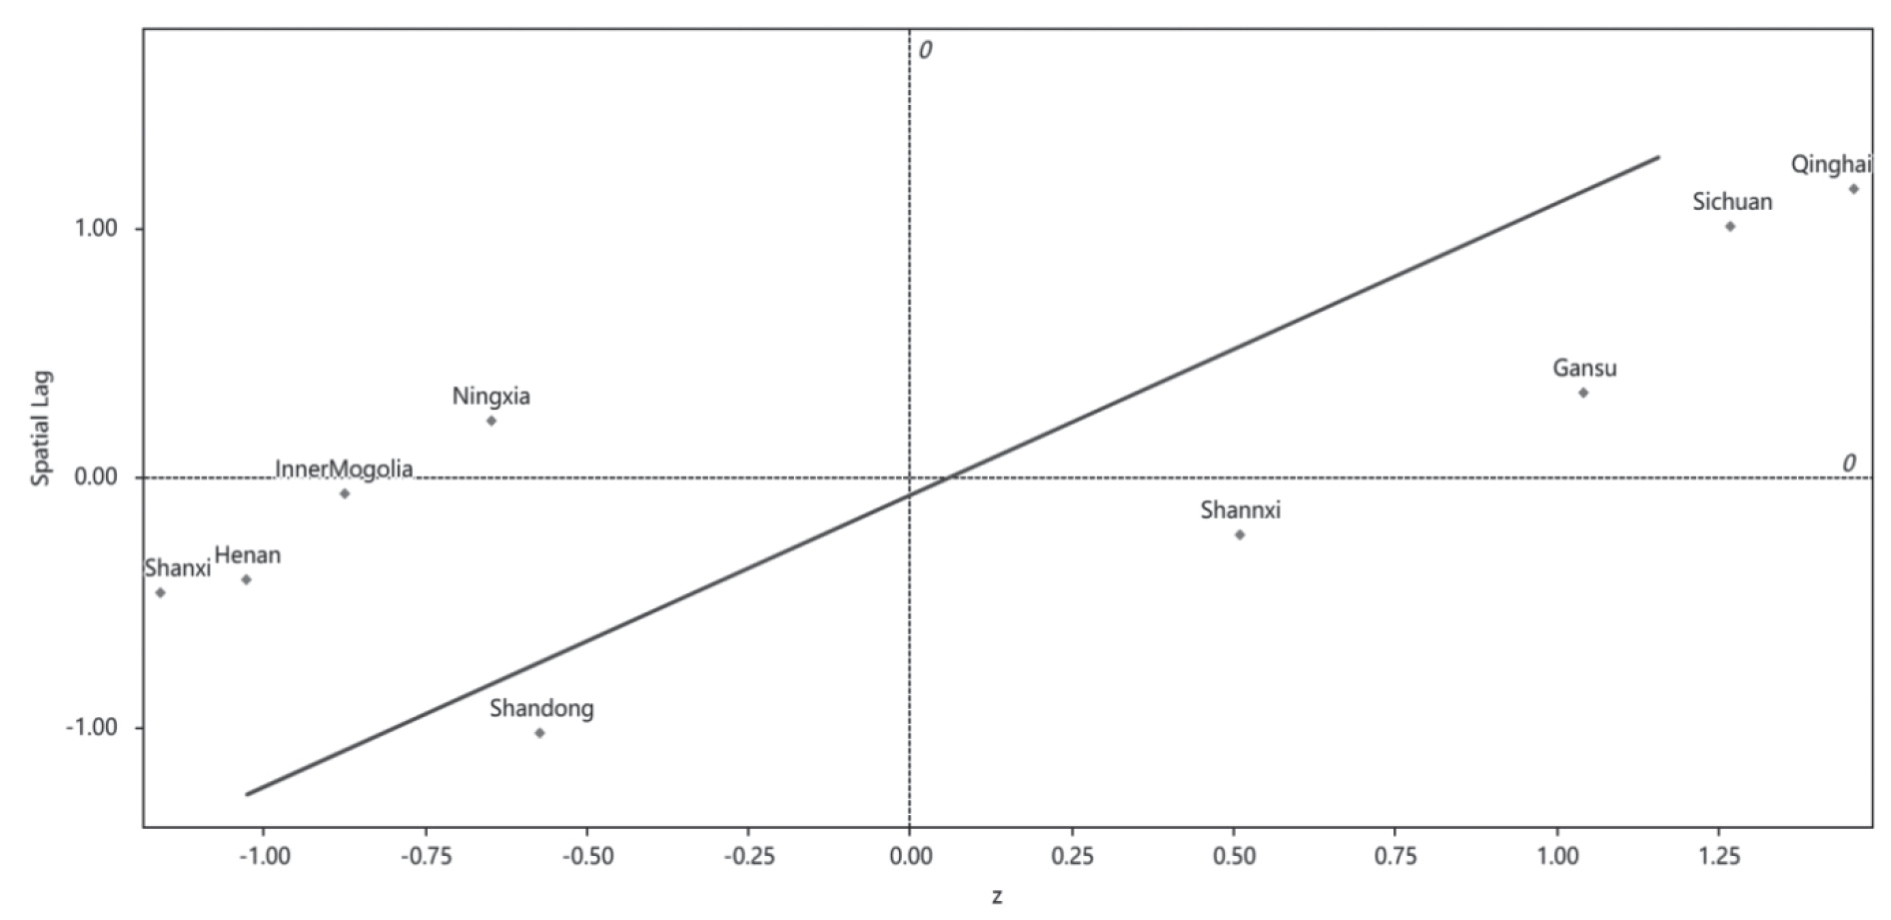
Additionally, from a spatial perspective, as Fig. 3 shows, the global Moran I’s index of WEF CCD in 2019 was calculated, revealing a general positive spatial correlation. It can be observed that, apart from Inner Mongolia, Shaanxi, and Ningxia provinces, the ‘high-high’ cluster areas were mainly located in the upper reaches of the Yellow River. Conversely, the ‘low-low’ cluster areas were concentrated in the lower Yellow River region. In this context, the ‘high-high’ cluster and ‘low-low’ cluster refer to spatial patterns, where areas with high or low values of CCD are geographically clustered together.
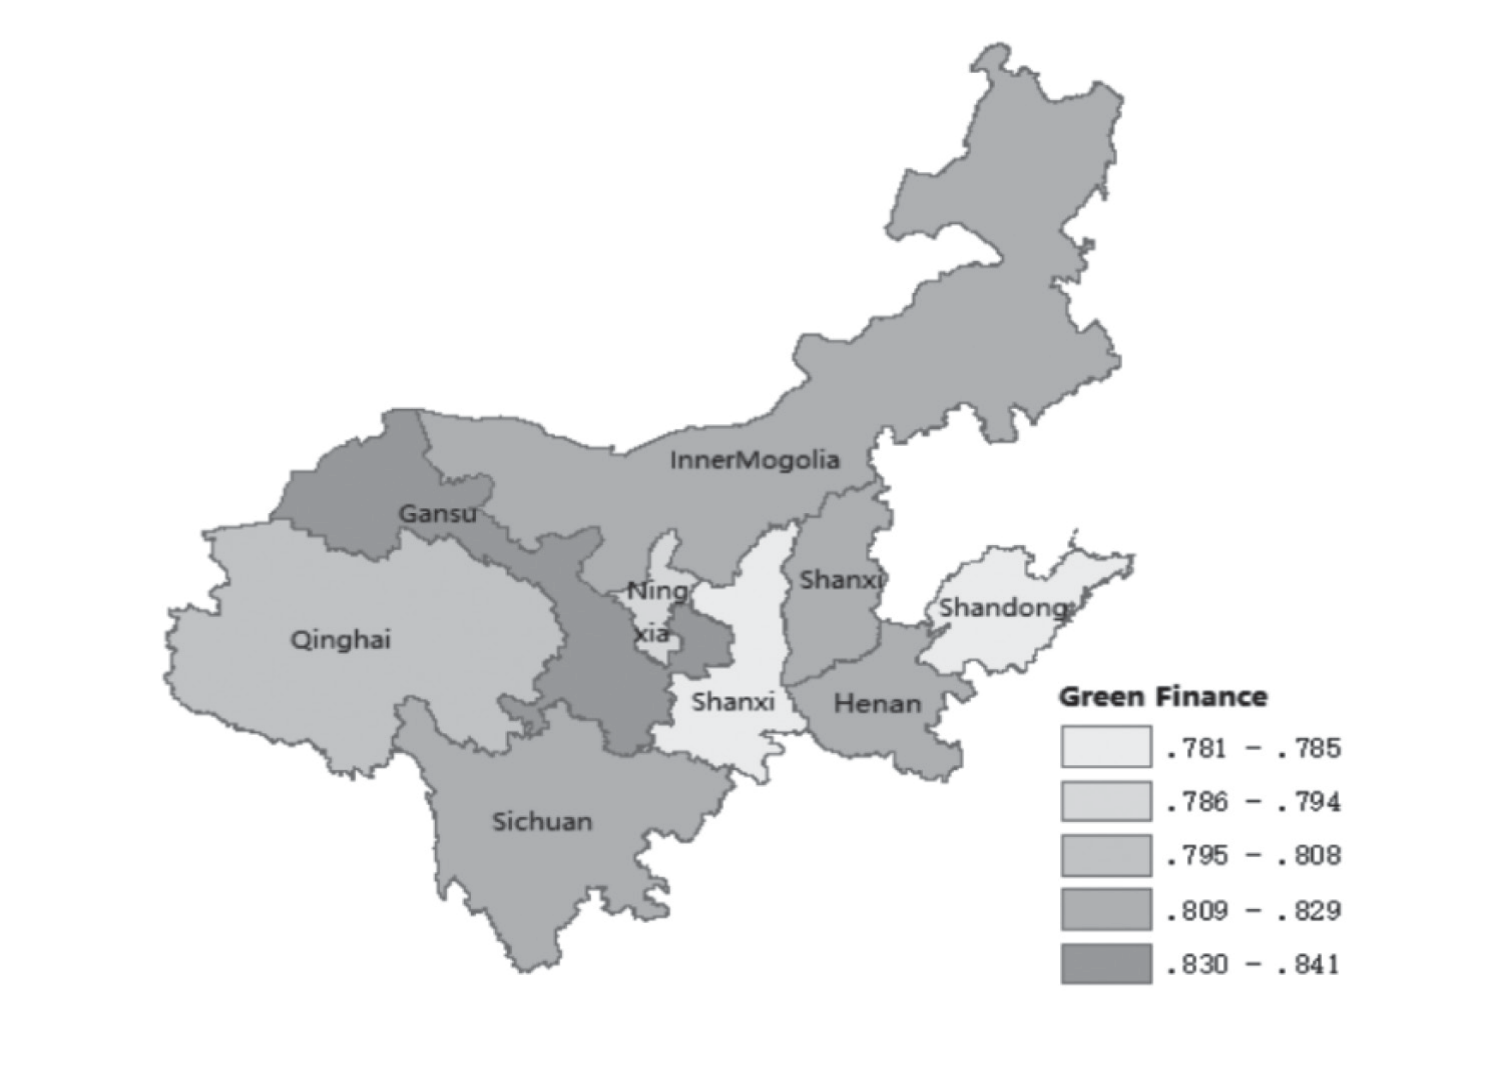
On the other hand, Fig. 4 illustrates the value of the green finance development index for the nine provinces. Among them, Gansu had the highest level of green finance development, primarily due to its government support. The local government had implemented proactive policies in the field of green finance, ranking its total amount of green credit rank first consistently in the YRB4. Conversely, Shaanxi and Shandong exhibited the lowest levels of green finance, mainly attributed to energy resource-rich and industrial structure.
Table 3.
VIF of Independent Variables.
| Variable | VIF | 1/VIF |
|---|---|---|
| Green Finance | 5.99 | 0.166874 |
| GDP | 5.92 | 0.168942 |
| Sun Duration | 5.02 | 0.199023 |
| Education | 4.51 | 0.221601 |
| Forest Coverage | 3.49 | 0.286448 |
| Population Density | 2.99 | 0.334351 |
| Mean VIF | 4.66 |
Besides, as shown in Table 3, the mean VIF was found to be smaller than 10, indicating that the long panel model could be constructed without significant issues of multicollinearity.
Empirical Methodology
The panel data used in this paper encompassed nine provinces in the YRB from 2004 to 2019 (n = 9, t = 16), making it a long panel dataset. Moreover, based on the EKC theory, the relationship between environmental quality indicated by WFE CCD and GDP is expected to be U-shaped. The relationship between GDP and environmental pollution may exhibit an inverse U-shaped pattern, while the combination of GDP with variables representing the improvement of environmental quality should follow a U-shaped relationship. Therefore, this study included the square of GDP in the model to account for these nonlinear relationships.
The econometric model was set as follows:
Di (i = 1,2…8) is a dummy variable measuring the nine different provinces in the YRB, T is the time variable; and εit, is the error term. It is possible to encounter the following three scenarios in the long panel model [66]:
1) The variance of the disturbance term for individual i is σ2i ≡ Var(εit). If σ2i ≠ σ2j (i ≠ j) exists, the disturbance term {εit} might have groupwise heteroscedasticity.
2) If Cov (εit, εjt) ≠ 0 (i ≠ j, sas∀t) exists, the disturbance term {εit} might have contemporaneous correlation.
3) If Cov (εit, εjt) ≠ 0 (t ≠ s, sas∀i) exists, the disturbance term {εit} might have autocorrelation within panels. Assuming the disturbance term follows an AR(1) process, εit = ρi εi,t + vit.
Regarding this situation, there are two sub-cases. One case requires the autoregressive coefficients to be the same within each group, ρi = ρ(i = 1, 2, …, n) ; the other case permits each group to have different within-group autocorrelation coefficients.
As evident from Fig. 2 to 4, there are notable differences among the nine provinces, indicating the potential presence of both individual fixed effects and time-fixed effects. To assess this, the Least Squares Dummy Variable (LSDV) two-way fixed effect model was employed. When considering disturbance term scenarios (1) and (2), the estimation of the LSDV method remained consistent; however, it is necessary to use robust standard errors, specifically the Panel Corrected Standard Error (PCSE). Considering scenarios (3) and (4) for the disturbance term, autoregressive coefficients are required to be the same being and being different within each group. To achieve a more comprehensive estimation, full Feasible Generalized Least Squares (FGLS) was considered, which accounted for all three situations simultaneously.
The FGLS model was examined using the modified Wald test for groupwise heteroscedasticity, the Wooldridge test for autocorrelation, and the Breusch-Pagan LM test for independence. The obtained P-values for all three tests were less than 0.05, which led to the rejection of the null hypothesis. This indicated the presence of heteroscedasticity, intra-group autocorrelation, and inter-group covariance in the model.
Furthermore, the stability of the model parameters was tested. The null hypothesis could not be rejected, suggesting that the varying coefficient model may not be suitable for this dataset. As a result, this study recognized the full FGLS model (Table 4 column 5) as the more appropriate choice.
Results and Discussion
Main Model
From the model results as shown in Table 4, it is evident that the variable GDP2 is significantly positive, while GDP is noticeably negative. To verify this, U tests were conducted, revealing a negative slope and rejecting the monotone or inverted U assumption. This clarifies that the relationship between the WEF CCD and GDP is indeed U-shaped. Furthermore, at the 1% level, the positive coefficient of green finance (0.217) indicates that an increase of one unit of green finance leads to an improvement of 0.217 percentage points in the WEF CCD. Regarding the control variables, the coefficient for education, represented by the average number of schooling years, was excessively low and nearly negligible. The duration of sunshine and population density exhibited significant negative coefficients, whereas the coefficients for forest coverage and urbanization rate failed to demonstrate any notable significance.
Table 4.
The Impacts of Green Finance on WEF CCD.
Robustness Check
Subsequently, in this study, the independent variable green finance index was replaced with the regular financial development index, which was calculated as the ratio of the total amount of deposits and loans to the real GDP in each province. The financial development index serves as an indicator to measure the degree of improvement in the financial system of a country or region, and it was found to be significant as shown in Table 5, column (2). However, upon comparing columns (1) and (2) of Table 5, it becomes apparent that the coefficient of green finance (0.217) was notably larger than that of regular finance (0.022). This suggests that green finance may have a stronger promoting effect on environmental quality compared to regular finance.
This study utilized two additional models, namely the System Generalized Method of Moments (SYS-GMM) and the Spatial Durbin Model (SDM), to test the results of the main model. The model results are presented in Table 5, columns (3) and (4). In the SYS-GMM model, the one-step estimation was examined, and the null hypothesis that all instrumental variables are valid could not be rejected based on the Sargan test of overidentifying restrictions (P = 0.5895).
Similarly, based on various tests, including the LM test (where the p-value of the spatial error model’s Robust Lagrange multiplier was 0.020 and the spatial lag model’s Robust Lagrange multiplier was 0.014), Hausman test (Prob>chi2 = 0.5357), and LR test (where the P value of the assumption SAR nested in SDM was 0.0086 and the assumption SEM nested in SDM was 0.0070). The SDM with fixed effects was selected.
Further Mechanism Analysis
This section delves deeper into how green finance influences WEF CCD to enhance sustainability. As mentioned in the literature review, green finance plays a pivotal role in promoting environmental quality through industrial upgrading, environmental regulation, and green innovation. To examine the complementary relationship between green finance and industry upgrading, environmental regulation, and green innovation, this study added the relevant variables along with their interaction terms with the green finance indicator in the analysis. This enabled the verification of whether green finance affects WEF CCD by facilitating industry upgrading, boosting environmental regulation, and promoting green innovation in the YRB.
Table 5.
The Robustness Analysis.
Firstly, industry upgrading was assessed at the provincial level every year following the approach of Gan et al. (2011). This evaluation was done using the formula:
In the calculation of industry upgrading (INDUPG), the variable firind represents the output value of the first industry, seind represents the output value of the second industry, and thirdind represents the output value of the third industry.
For environmental regulation (ER), China’s industrial sector was found to be a major contributor to waste gas, wastewater, and waste residue among economic sectors, and accounts for the majority of the country’s energy consumption. To evaluate the level of environmental regulation intensity, this study used the provincial total amount of industrial waste residue, wastewater, and waste gas elimination investments from 2004 to 2019. The natural logarithm of this variable was utilized due to data availability considerations.
To assess green innovation (GRI), this study employed the ratio of green patent applications to the total patent applications as a proxy. This ratio provides a more accurate reflection of the importance stakeholders place on green innovation. Additionally, the data on green patent applications is more timely compared to data on green patent authorizations, making it more suitable for this analysis.
From the regression results presented in Table 6, green finance was found to promote the environment of the YRB through industry upgrades and green innovation, as shown in column (2) and column (4). There is a significant complementary effect between green finance, industry upgrading, and green innovation.
Discussion
Since WEF CCD with an overall upward trend represented positive environmental quality, the main model results indicated the relationship between WEF CCD and economic development consistency with the EKC theory is indeed U-shaped. Furthermore, in terms of enhancing environmental quality, the development of green finance played a crucial role. Irrespective of the substitution of primary explanatory variables or models, upon comparing the coefficients, the significance of a positive coefficient for green finance persisted. This observation was robustly corroborated through various testing methods which substantiated hypothesis H1. The results also revealed a stronger positive influence of green finance on environmental quality in comparison to traditional finance, underscoring the significance of developing green finance.
Table 6.
The Impacts of Green Finance on WEF CCD (Mechanisms).
However, education did not effectively contribute to environmental preservation, which could be attributed to the inadequate integration of sustainable development education into the educational system in the YRB from 2004 to 2019. The government should pay attention to integrating more contents of sustainable development, such as water and electricity conservation and environmental protection, into the primary and secondary education system.
The arid or semi-arid climate, with long sunshine hours and low average yearly rainfall of the YRB, may lead to ecosystem degradation, soil erosion, and desertification. This directly led to the fact that the issues of soil and water conservation in the YRB remained extremely serious. Although the forest coverage in the YRB has increased over the years, the impact of this augmentation on water conservation has remained relatively limited. Therefore, accelerating the speed and effectiveness of afforestation is a top priority for sustainable development in the local area.
The upward trend in resident population density might contribute to increased CO2 emissions and energy demand, thereby incentivizing higher greenhouse gas emissions and exacerbating temperature rise and climate change. In that instance, a notable negative impact of population density on the environment was also observed in the YRB. However, despite the rapid urbanization rate reaching 58% by the end of 2020, it did not have a significant effect on environmental quality, as per the model results. Although an increase in population density exerted pressure on the environment, the current urbanization rate is within the range of environmental carrying capacity. The urbanization process could mitigate its negative impact and even achieve the goals of environmental quality and sustainability through economies of scale, improved infrastructure, rapid technological updates, policy promotion, etc. China’s urbanization rate target is to reach approximately 75% by 2035 and 80% by 2050 on the basis of 2020. In this process, the local government should fully consider the pressure of population density on environmental quality, complete the construction of smart cities as soon as possible, and reduce the loss of environmental quality by improving the efficiency of transportation and city operation.
In mechanism analysis, the observations suggest that the assumption H2 and H4 could be valid in the YRB that can underscore the role of green finance in stimulating sustainable practices and innovation in the region. However, contrary to the existing literature, this study did not find evidence to support H3, where green finance can promote environmental quality through environmental regulation locally. As shown in Table 6 in column (3), the coefficients of the environmental regulation variable and interaction terms of it and green finance are close to zero even though the coefficient of the interaction term is smaller. This finding suggests the problem of weak environmental regulation that could not meet the requirements for local sustainable development.
Conclusions
In conclusion, the findings of this study indicate that the environmental quality of the YRB experienced a decline first and then rose between 2004 and 2019, with a spatial positive correlation. The sustainability issues in the middle and lower reaches of the Yellow River had become increasingly acute. The YRB enjoyed a robust development of green finance, primarily influenced by its policy orientations. Regions with the highest green credits achieved better progress in green finance, while those with abundant fossil energy and industrial activities lagged.
During the same period, the relationship between the WEF CCD and GDP in the YRB followed a U-shaped pattern. Additionally, the results consistently showed that the development of green finance positively impacted sustainability in the YRB across all the estimation techniques and robustness checks conducted. The mechanisms analysis further suggested that green finance primarily boosts sustainability by enhancing industry upgrading and green innovation, rather than relying on environmental regulations.
Based on these findings, policymakers can consider the following suggestions. First, due to the uneven development of WEF CCD, the government could intensify its efforts to address the conflict between water demand and supply, particularly in the midstream and downstream regions of the YRB. Besides, given the significant variations in industry structure and resource endowment, it is imperative for provincial governments to tailor their green finance development strategies specifically to their local resources and characteristics. Strengthening legal oversight and related laws and regulations can enhance the stability and continuity of green finance policies, as well as address issues like local protectionism and ineffective policy implementation in environmental protection. While this study did not find a significant relationship between green finance and environmental regulation, it is essential for green finance to expand its role in waste control investment. Establishing a long-term incentive system based on market forces for environmental regulation activities is crucial to further complement the efforts of green finance in improving sustainability in the YRB. By focusing on these aspects, policymakers can work towards achieving a more sustainable and environmentally friendly development in the region.

