

Introduction
Indonesia is one of the countries ratifying the Paris Agreement and is outlined in national-level policies Law No. 6/2016 on ratification of the Paris Agreement to the United Nations Framework Convention on Climate Change 2016 [1]. The national target updated in 2022 is to reduce greenhouse gas (GHG) emissions by 31.89% BaU and 43.20% with foreign assistance [2]. This national target is evenly distributed to strategic sectors as well as local governments as regional rulers administratively. Forestry and other land uses (FOLU) is a sector that is targeted to become a carbon sink by 2030 [3], [4] so that FOLU becomes an important sector.
Land use in Indonesia is broadly divided into protected areas and cultivated areas. Each of them has a designation according to the character of the region. The type of land use and vegetation correlates with the amount of carbon sequestration. Land with vegetation such as forestry plants and mangroves will increase carbon sequestration, while land with agricultural crops such as rice tends to have low potencies of carbon sequestration. This can be seen from the carbon absorption coefficient in the research of [5].
In this study, Central Java Province was taken as the locus because it is the most populous province on Java Island. Population pressure on large land use changes and threatens the existence of vegetation cover, which is the main GHG absorber. The Regional Action Plan for GHG emission reduction ended in 2020 Central Java Governor Regulation No. 43/2012 concerning the Regional Action Plan for Reducing Greenhouse Gas Emissions in Central Java Province for 2010-2020 [6], so it is necessary to evaluate its achievements. The total emissions produced by Central Java Province in 2021 were recorded at 31,995,596.25 tons of CO2 eq (Aksara-Bappenas).
The cluster approach is one solution that can be used to achieve NZE. The formulation of carbon sequestration based on clusters has the principle that regions that produce excess carbon emissions will be assisted in absorbing carbon emissions by areas that are directly adjacent to the area (buffer areas) and have excess carbon sequestration. Therefore, it is necessary to identify and inventory which areas cannot absorb all carbon emissions produced by these areas and which areas have excess sequestration so that they can be united in one cluster to help absorb carbon emissions. Through a regional approach, it is hoped that Central Java can achieve NZE to support national targets by knowing the districts/cities that emit large and small value emissions so that a strategy is obtained to achieve them.
Research on emission production and carbon sequestration has been carried out by [7], who has identified which provinces cannot absorb their own carbon emission production. The study also states that Central Java Province is one of the provinces in Indonesia whose carbon emission production is greater than carbon sequestration.
NZE is reducing GHG emissions or increasing vegetation absorption so that emissions become net zero. Based on regional data, the districts/cities in Central Java province will vary in terms of emission values. Industrial areas will have different emission values from areas that have protected areas, as well as areas that are dominated by agriculture. Urban areas such as Surakarta have high emission levels [8], while Karimun Jawa islands in Jepara have the potential to absorb emissions from seagrass beds [9] apart from terrestrial vegetation. Areas that have mangrove forests have the potential to absorb more GHG, such as in Brebes [10, 11], and Rembang [12].
In the study, the achievement of NZE is associated with the latest regulation, namely Presidential Regulation Number 98/2021 concerning the Implementation of Carbon Economic Value for the Achievement of Nationally Determined Contribution Targets and Control of Greenhouse Gas Emissions in National Development. The mechanism for implementing the economic value of carbon (NEK) in Article 47 Paragraph (1) will be analyzed in accordance with the findings of the study. Recommendations for provincial scale are carried out through regional (spatial) approaches and policies, not considering the character of the greenhouse gas pollutants studied.
Material and Methods
Time and Research Location
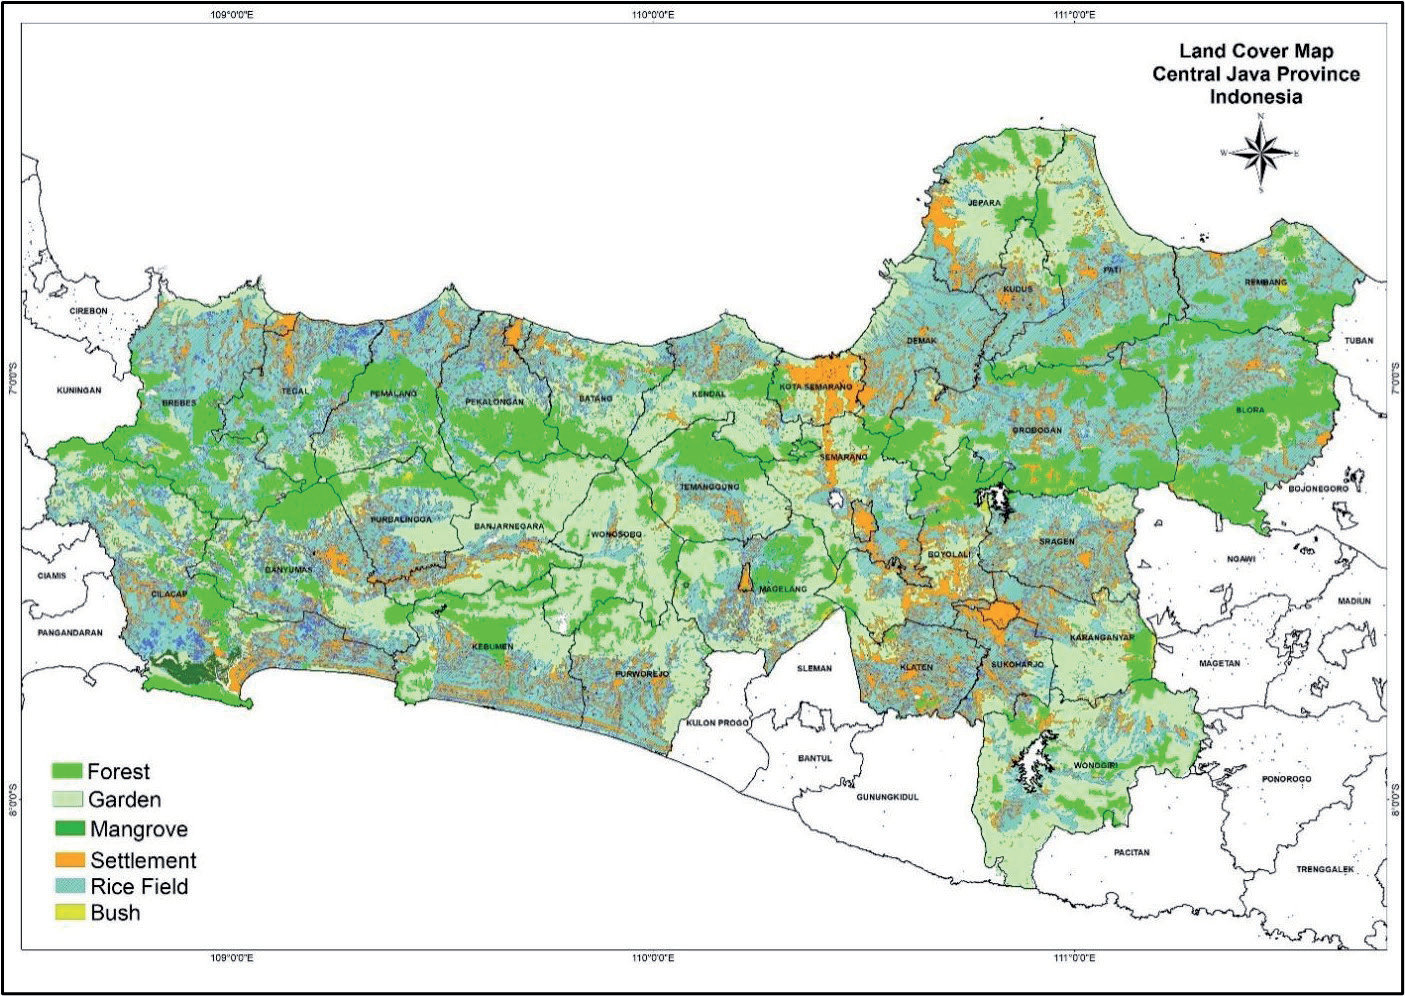
The research was conducted in Central Java Province, Indonesia (Fig. 1). Sample determination is carried out by the census sampling technique. According to [13], thecensus sampling technique is a sampling technique that all members of the population use as samples. In this study, all districts/cities included in the administrative area of Central Java Province were used as samples to determine areas that still have deficits and surpluses in carbon emissions.
Research Tools and Materials
This research is quantitative descriptive and aims to provide an overview of how much carbon emissions are produced and absorbed in Central Java Province. The material used in this study is land cover map data in 2022 and carbon sequestration constant data.
Data Collection Methods
Land use cover data was collected from Rupa Bumi Indonesia (RBI) in the 2022 land use map. Carbon sequestration is constant data collected from terrestrial crops from the Agricultural Research and Development Agency, Ministry of Agriculture. Secondary data collection is carried out by processing data from various sources. According to [5], the calculation of absorption and storage potential (carbon sequestration) is calculated through the ability of land cover vegetation in the form of: (1) terrestrial ecosystems such as forests, plantations, shrubs, grasslands, and agricultural land; (2) coastal ecosystems in the form of mangrove forests, seagrass beds, animal husbandry, lakes, seas, and others; and (3) individuals per plant/tree can also be calculated, especially to estimate the potential registration of urban parks/areas, so that by knowing the area and type of land cover of an area, the potential for carbon dioxide absorption and storage from the area/area will be calculated.
The individual carbon footprint of Indonesia collected from https://edgar.jrc.ec.europa.eu/report_2 023?vis=co2pop#emissions_table. In the publication published by the European Commission, it stated that Indonesia has an Individual Carbon Footprint (ICF) of 2.5 tons of CO2 eq/person/year. The approach using ICF values has limitations, in that the type of activity is not taken into consideration in the calculation. So, only one ICF value is used for everyone. Even so, this method is considered to still be able to describe the estimated emissions produced by each individual in an area.
Data Analysis Methods
Carbon Emissions Calculation
The calculation of carbon emissions for each district/city is carried out by the indirect method. The individual carbon footprint (ICF) approach is carried out to determine the number of emissions produced by each person in an area. This data is then converted into carbon emission data for each district/city based on its population.
Individual carbon footprint is a measure of human activities that have an impact on the environment [14]. The approach to the amount of carbon emissions from an area is calculated through the main individual activities that produce carbon emissions, such as transportation activities, use of electrical energy, food consumption, use of paper/stationery, waste production, entertainment, etc., so it is often overlooked [7].
After individual carbon footprint data is obtained, then the data is multiplied by the number of residents in each districts/cities to get the total carbon emissions. The total carbon emissions of districts/cities are calculated by the following equation:
ΣDistrics Emissions: Tons CO2 eq
ICF: Individual carbon footprint (Tons CO2 eq/ person/year)
ΣDistricts population: Person
Carbon Sequestration Calculation
Carbon sequestration is carried out by calculating the extent of land cover from RBI land cover map data. Land cover use data is then multiplied by the carbon sequestration constant to determine the potential for carbon sequestration and storage in an ecosystem. Briefly, it can be formulated with the following equation:
PCS: Potential carbon sequestration (Tons CO2 eq/ha)
LCA: Land cover area (ha)
CSC: Carbon sequestration constant (Tons CO2 eq)
Regional Evaluation and Clustering to Achieve NZE
The emission and sequestration data of each districts/ cities that has been obtained is then evaluated by looking at the difference between carbon sequestration in the region and the resulting carbon emissions. Briefly, it can be formulated with the following equation: NZE = Carbon Sequestration - Emission of an area (3)
NZE: Net Zero Emission (Tons CO2 eq)
Carbon Sequestration: Tons CO2 eq
Emission of an area: Tons CO2 eq
If the calculation results show a negative value, it means that there is still a difference in emissions that have not been absorbed by land cover in the area. Therefore, it is necessary to cluster to compensate for the excess produced by an area. Data analysis for clustering is carried out by descriptive-qualitative methods.
Regional clustering is carried out based on the amount of carbon emissions and sequestration produced by districts/cities in Central Java province in 2022. This clustering follows a scheme of carbon economic value where emission producers are encouraged to pay for excess emissions produced in addition to emissions that have been sequestered by their respective land cover in each region.
Results and Discussion
Carbon Emissions of Districts/ Cities in Central Java Province
The population of Central Java Province, according to data from the Central Statistics Agency in 2022, show that there are 37,032,410 inhabitants. Based on the Emissions Database for Global Atmospheric Research (EDGAR, European Commission), the Individual Carbon Footprint value for each person in Central Java Province is 2.50 tons of CO2 eq/person/year. The value of the Individual Carbon Footprint is then used as a calculation basis to determine the number of emissions in each districts/cities in Central Java Province by multiplying it by the population of each districts/cities. The calculation results can be seen in Fig. 2.
Individual carbon footprint (ICF) is a concept that voices the causes of climate change as well as reducing GHG emissions [15]. ICF is calculated based on individual or household consumption of energy sources (electricity, fuel, and vehicle mode) [16]. For the ICF calculator, inputs are added to food, water, and wastewater production [15]. ICF basically varies between individuals due to economic and lifestyle factors: even the level of prosperity of the country also affects ICF [16]. From the calculation results based on the ICF, the amount of carbon emissions will be linear with the population. This means that the greater the population of an area, the higher the value of carbon emissions.
ICF ignores other factors, such as regional factors with a multi-region input-output (MRIO) model approach or hybrid model [17]. The model studied by [17] considers aspects such as geographical boundaries and consumption by residents and migrant groups. MRIO can be applied from city to country scale [17]. However, with the limited data obtained at the locus of study, the ICF database was used in this research.
Carbon Sequestration of Districts/ Cities in Central Java Province
Carbon sequestration in an area can be calculated based on the land use. In this research, land use was used as a calculation variable. Various land uses consisting of terrestrial forests, gardens, mangroves, settlements, rice fields, and shrubs are then multiplied by the value of the carbon stock constant to get the value of carbon sequestration [7]. Mangroves in coastal areas have potential in environmental services as carbon sinks [18]. Not only that, forests that have many plant species, such as ebony and teak, can also be a good carbon sink [19, 20]. Based on Table 1. below, the constant value of carbon stocks in land cover in the form of mangroves is 2-3 times greater than terrestrial forests and plantations.
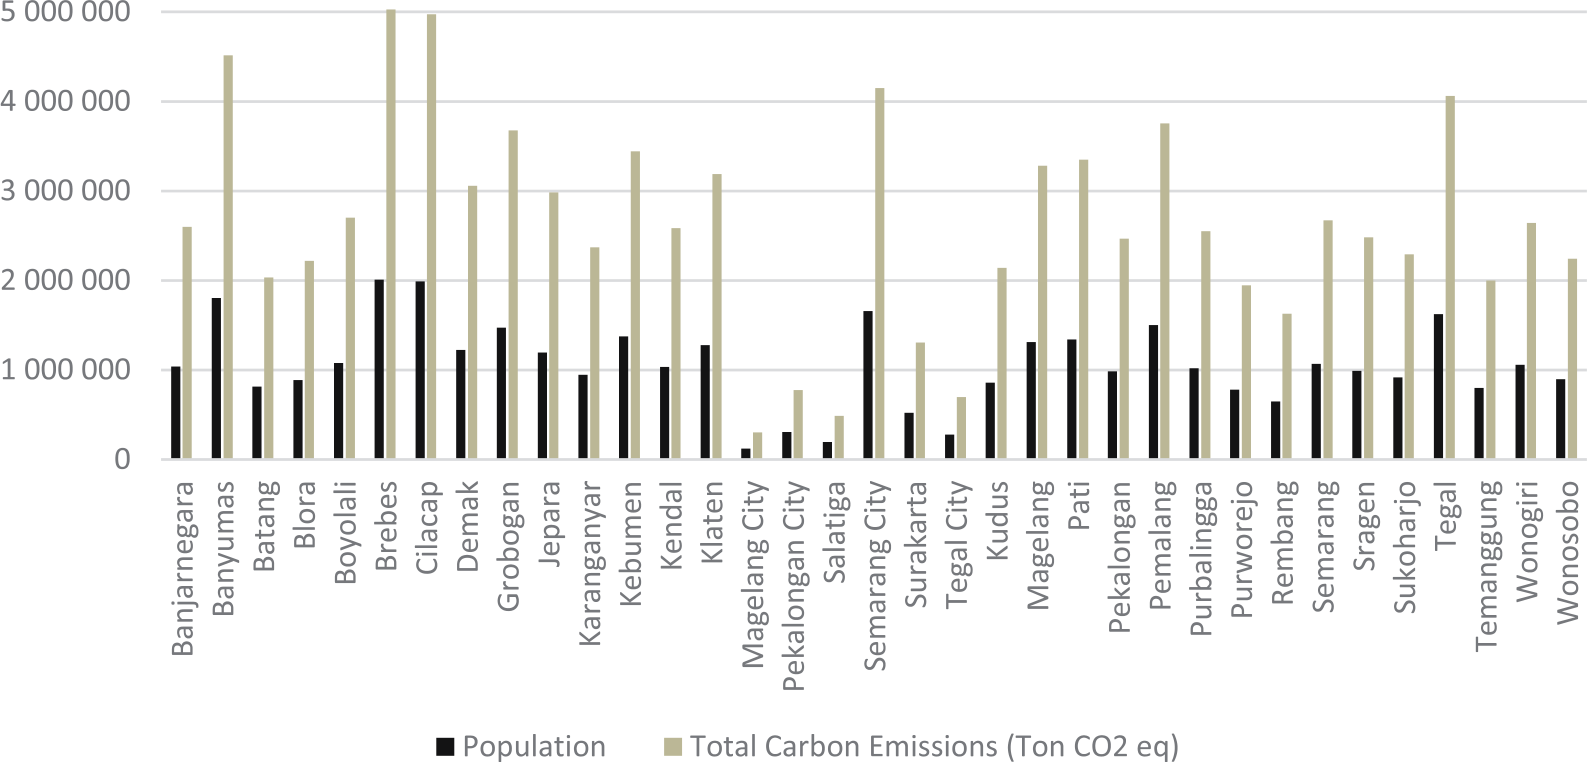
Table 1.
Carbon Stock Constant Value.
| Land Cover | Carbon Stock Constant Value* |
|---|---|
| Forest | 85.25 |
| Garden | 63.00 |
| Mangrove | 188.30 |
| Settlement | 4.00 |
| Rice Fields | 2.00 |
| Bush | 30.00 |
Indonesia, as a developing country with extensive forests and very high levels of biodiversity, is expected to play an important role in increasing carbon sequestration [19, 20]. But there are many obstacles. Land degradation can lead to reduced value of carbon stocks [18]. The conversion of land cover into settlements or rice fields is very influential and will reduce the ability of land to absorb carbon [21]. This can be seen from the value of the settlement carbon stock constant, which only reaches a value of 4, much smaller than the forest carbon stock constant, which reaches 85.25 [7]. Reducing canopied land cover into other types, such as settlements, causes a reduction in carbon stocks, changes the ability to store carbon stocks, and produces emissions to the environment [22].
The constant value of carbon stocks is then used as a basis for calculations, and the value is different for each type of land cover. This is because the carbon sequestration ability of each land cover is different. The results of carbon sequestration calculations can be seen in Table 2.
The amount of sequestration potential is highly dependent on the type and extent of land cover. This type of land cover with constant carbon stocks has the potential to absorb more carbon, and vice versa. Table 3 above shows that Cilacap, Blora, and Grobogan are the 3 districts with the largest estimated carbon sequestration in Central Java Province. Cilacap is the area with the highest estimated carbon absorption, reaching 8,620,246.74 tons of CO2 eq, or 8.48% of the estimated carbon absorption in Central Java Province.
The high potential for carbon sequestration in Cilacap is possible due to land cover in the form of mangroves, which have the highest sequestration coefficient. Cilacap is one of the six districts/cities that have the largest mangrove forests, although the area has been significantly reduced since 2016 [23]. Mangrove forests grow naturally, or the result of rehabilitation activities scattered along the coastline and centered in the Segara Anakan area [24]. The large potential for carbon sequestration in Cilacap is also possible due to land cover in the form of terrestrial forests and plantations that are larger than other districts/cities in Central Java Province.
Blora is the second highest region with a potential carbon absorption of 8,219,027.70 tons of CO2 eq, or 8.09% of the estimated carbon absorption in Central Java Province. Although Blora does not have land cover in the form of mangroves, its land cover is dominated by terrestrial forests as well as the most extensive in Central Java Province, with the second largest carbon stock constant value. The same thing was also found in Grobogan, which is the area with the third highest absorption potential, reaching 7,252,304.65 tons of CO2 eq, or 7.14% of the estimated carbon absorption in Central Java Province. The land cover of Grobogan is dominated by terrestrial forests and rice fields, which makes its carbon sequestration potential also increase.
Table 2.
Calculation of Districts/Cities Carbon Sequestration in Central Java Province.
The three areas with the lowest estimated carbon sequestration can be seen in the calculation results (Table 3), namely Pekalongan, Magelang, and Tegal. These three areas do not have land cover in the form of mangroves, terrestrial forests, and shrubs with high carbon stock constants. The three regions only rely on areas in the form of plantations, settlements, and rice fields as carbon sinks, so carbon sequestration is very small compared to other regions, considering that the carbon sink constant from available land cover is also the smallest compared to other regions. The estimated carbon absorption in Pekalongan City is only able to reach 15,510.83 tons of CO2 eq or 0.02% of the total estimated carbon absorption in Central Java Province. Not much different, Magelang City and Tegal City are only able to absorb 14,557.08 tons of CO2 eq and 11,095.63 tons of CO2 eq, or about 0.01% only.
The amount of carbon sequestration for each district and city in Central Java Province needs to be evaluated and compared with the number of emissions produced. The evaluation includes changes in land cover that occur in a certain time span and the possibility of preventing land cover change, especially in non-forest areas. Significant land cover change needs to be controlled through spatial planning policies [22]. The results of this evaluation are needed to determine an action plan for achieving NZE at the provincial level and have an impact on achieving NZE at the national level.
Regional Evaluation and Clustering to Achieve NZE in Central Java Province
Table 3 shows the top ten carbon emitting districts/ cities namely, Brebes, Cilacap, Banyumas, Semarang City, Tegal, Pemalang, Grobogan, Kebumen, Pati, and Magelang, in accordance with the order of population density in Central Java Province. Table 3 also shows the results of the calculation of zero carbon emissions for all districts/cities in Central Java Province. NZE is a condition when the amount of carbon emissions released into the atmosphere does not exceed the number of emissions that can be absorbed. Therefore, NZE calculations are calculated based on the difference between the amount or estimate of carbon that can be sequestered and carbon emissions released into the atmosphere from various activities.
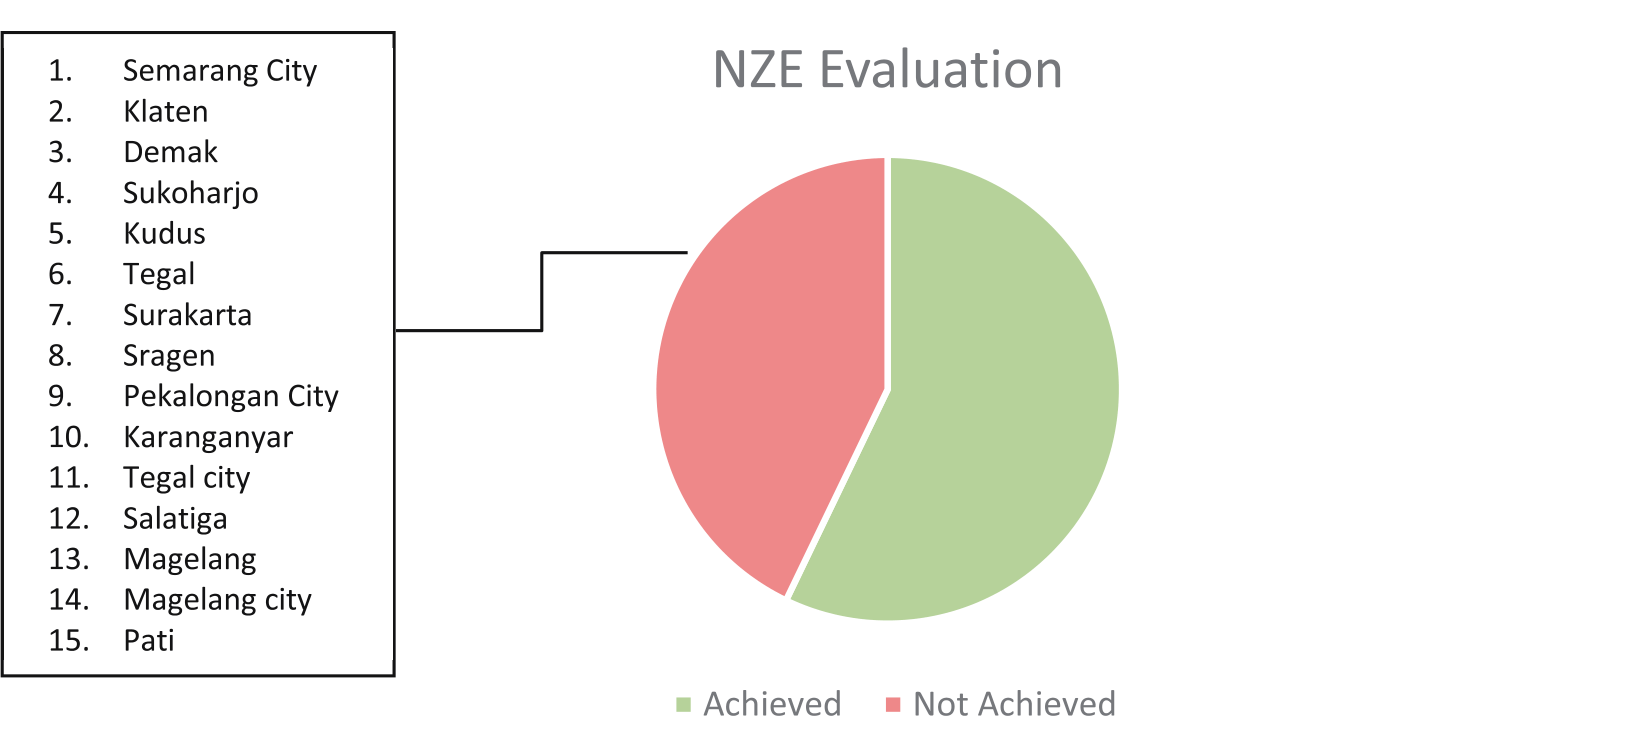
Based on Fig. 3 above, Central Java Province has achieved NZE with a difference in estimated absorption and carbon emissions of 9,025,367.00 tons of CO2 eq. However, when viewed per districts/cities, almost half, or 15 districts/cities (42.86%), in Central Java Province have not achieved NZE, as can be seen in Fig. 3.
Blora, Cilacap, and Grobogan are the top three highest NZE in Central Java Province. Blora has the highest estimated difference in carbon absorption and emissions of 5,998,467.70 tons of CO2 eq. This achievement was due to very high carbon absorption of 8,219,027.70 tons of CO2 eq, as well as carbon emitted into the atmosphere of 2,220,560.00 tons of CO2 eq. Although Cilacap has emitted high carbon of 4,971,555.00 tons of CO2 eq, Cilacap has achieved the second highest NZE in Central Java Province at 3,648,691.74 tons of CO2 eq. This is because Cilacap has the highest carbon absorption potential, especially the largest mangrove land cover potential in Central Java Province. It is kindly similar to Grobogan, which emitted large amounts of carbon of 3,675,375.00 tons of CO2 eq, but has great potencies of carbon sequestration of 7,252,304.65 tons of CO2 eq so the NZE achieved was 3,576,929.65 tons of CO2 eq.
Semarang City was in the top tier of districts/cities with the highest carbon emission of 4,149,937.50 tons of CO2 eq, and this value is higher than the estimated carbon absorbed by land cover of 861,381.30 tons CO2 eq. This condition resulted in Semarang City having an NZE value of -3,288,556.20 tons of CO2 eq. Some other districts/cities that emitted carbon higher than its sequestration include Klaten, Demak, Sukoharjo, Kudus, Tegal, Surakarta, Sragen, Pekalongan City, Karanganyar, Tegal City, Salatiga, Magelang, Magelang City, and Pati.
Table 3.
Results of Carbon Emission Calculation Districts/Cities in Central Java Province.
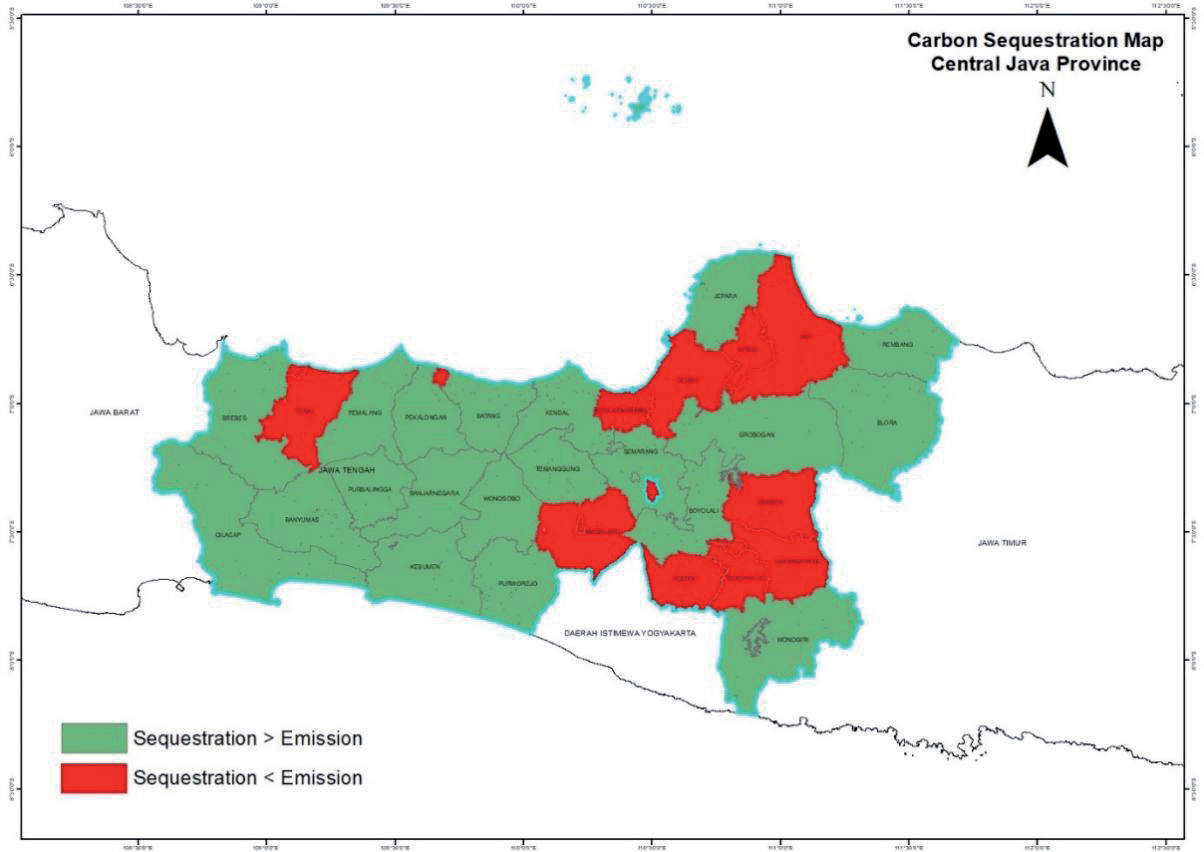
Table 3 shows that the amount of carbon sequestration produced in some districts/cities is very low. Therefore, to achieve NZE in some of these districts/cities, significant efforts are needed to increase or restore land cover, especially those with high sequestration constants, protecting forests, and preventing deforestation. In addition, compensating areas that produce a lot of emissions with surrounding buffer areas and then forming a cluster can also be done to achieve NZE, as can be seen in the following map of carbon emissions in Central Java province (Fig. 4).
Regional clustering is carried out based on geographical location and results in 4 clusters, namely Tegal and Tegal City, Pekalongan City, and 2 other big clusters, as can be seen in Table 4.
There are two large clusters that are geographically located next to each other, namely the Magelang, Magelang city, Salatiga, Klaten, Sukoharjo, Surakarta, Karanganyar, Sragen (south cluster), and the Semarang city, Demak, Kudus, Pati (north cluster). The south cluster is directly adjacent to Purworejo, Wonosobo, Temanggung, Semarang, Boyolali, Grobogan, and Wonogiri. The total south cluster has an absorption shortfall of -8.529.192,85 tons of CO2 eq. However, the buffer area that is directly adjacent to this cluster has an excess absorption of 10.418.881,12 tons of CO2 eq. This value is more than enough to cover the lack of emission absorption from the south cluster.
Meanwhile, the north cluster has an absorption shortfall of -7.236.320,28 tons of CO2 eq. However, this deficiency can be covered by the existence of a buffer area that is directly adjacent, namely Kendal, Semarang, Grobogan, Jepara, Blora, and Rembang, with excess carbon absorption of 12.970.708,27 tons of CO2 eq. There is an interesting result that Semarang and Grobogan play an important role in cluster-based NZE evaluation. Semarang and Grobogan are buffer areas for two large clusters due to their location, with excess carbon absorption of 812.040,86 tons of CO2 eq and 3,576,929.65 tons of CO2 eq, respectively.
The other cluster is a small cluster, namely Pekalongan City, with an absorption shortfall of -758.844,17 tons of CO2. The lack of carbon absorption in this cluster can be covered by two surrounding districts, namely Pekalongan and Batang, with excess carbon absorption of 2.481.144,92 tons of CO2 eq. Thus the NZE differences in this cluster reach 1.722.300,75 tons of CO2 eq.
Different from other clusters, the Tegal and Tegal City cluster, which has an emission absorption shortfall of -2.064.573,24 tons of CO2 eq can still be covered by carbon absorption in its surroundings. Pekalongan and Batang, which are directly adjacent to this cluster, only have excess carbon absorption of 1.079.824,14 tons of CO2 eq. This cluster still lacks -984.749,11 tons of CO2 eq to achieve NZE. This condition requires serious handling by both the cluster and the surrounding area, for example, by reducing the carbon emissions from various activities and also land use and vegetation management in order to increase carbon sequestration.
Table 4.
Districts/Cities cluster in Central Java Province based on lack and excess of carbon emission.
Table 5.
NZE Projection of Districts/Cities in Central Java Province to 2030.
Mechanisms based on geographical factors need to be emphasized in the territorial scheme. Of the several districts/cities indicated to have emission absorption deficiencies, only some have the status of metropolitan areas. Metropolitan is a concept of regional management that is indicated to experience rapid urbanization so that groupings (agglomerations) are made. Regional grouping is legalized through the establishment of interregional cooperation bodies. Semarang metropolitan city area (Kedungsepur) includes Kendal, Demak, Semarang City, Ungaran - Semarang, Purwodadi - Grobogan, and Salatiga City. Based on this, the regions that have been institutionally able to overcome the lack of emission absorption are Demak, Semarang City, and Salatiga City.
Meanwhile, for other regions that are not included in the spatial scheme, the implementation of NEK implementation deserves further study. In Presidential Regulation No. 98/2021, local governments are one of the implementers of NEK (Article 46 Paragraph (2) Letter b). The accommodating mechanism is performance-based payments (Article 55), but it is top-down (national to local and provincial to local government) not between districts/cities. Another mechanism involving local governments is carbon levies (Article 58). For the implementation of this levy, it is necessary to further analyze the fields/sectors subject to taxation on carbon in each region. The technical provisions for the implementation of NEK are still in the process of being prepared according to the authority of the relevant minister, so further study is needed.
Projection NZE in Central Java Province to 2030
Indonesia has a target to achieve NZE in the land sector by 2030. This is stated in the FOLU Net Sink program that is being planned by the government to meet Indonesia's carbon emission reduction commitment. The calculation results in 2023 are then projected for 2030 to be an illustration of the condition of carbon emission absorption in Central Java. The following are the projected results of districts/cities that have red records in 2030:
The calculation was done by assuming all open land in areas that have red notes is used as forest. Therefore, the secuscitation constant used is 85.25. Population data is then obtained from the calculation of BPS Central Java projections. The results show that all regions that have red records still lack carbon emission absorption. Even though all open land has been planted, it still cannot meet the burden of emissions generated. Semarang is a city with a relatively high NZE value, namely -3,522,390 tons of CO2 eq, followed by Demak with -2,632,612 tons of CO2 eq and Klaten with as much as -2,593,955 tons of CO2 eq. Therefore, it is necessary to reduce emissions in several sectors in districts/cities that have red records.
The increase in sequestration with the cultivation of vacant land is not enough to make up for the lack of sequestration in some areas. Therefore, the step that needs to be taken is to reduce the individual carbon footprint. For the area to reach NZE, it is intended that each person will reduce their carbon footprint. However, in some regions, it is difficult to reduce individual carbon footprints because these areas are economic centers that produce a lot of emissions. For example, Semarang City ideally has an individual carbon footprint of 0.50 to achieve NZE. Reducing the value of individual carbon footprints from 2.50 to 0.50 is very difficult. Therefore, it is necessary to apply carbon tax compensation to the buffer area to absorb carbon produced by Semarang City. Therefore, it is necessary to reduce emissions in several sectors in districts/cities that have red records.
Conclusions
From the results of the NZE analysis of carbon emissions and sequestration for the Central Java Province, it can be concluded that:
1. Globally, the Central Java Province has reached NZE, meaning that carbon emissions generated from all activities/sectors can be absorbed and stored in sequestration by existing plants/vegetation. Considering the autonomous task, the NZE analysis needs to be continued to the districts/cities level. Although there are clusters that have not reached NZE. Therefore, policies must be implemented by the provincial government in order to maintain the achievements of ZNE until 2030.
2. Achieving NZE can be done by planting vegetation and reducing carbon emissions, especially from the energy, transport sectors, and waste, considering the availability of the area and sequestration capability in surrounding districts/cities.
3. There are four clusters that have not achieved NZE in Central Java Province that can be seen from this research. Two clusters are categorized as large clusters, namely the Magelang, Magelang City, Salatiga, Klaten, Sukoharjo, Surakarta, Karanganyar, Sragen (south cluster), and Semarang City, Demak, Kudus, and Pati (north cluster). Serious approaches must be taken to overcome this condition, especially for the Tegal and Tegal City clusters. There are efforts that can be made, such as reducing carbon emissions from various sectors, especially energy and transportation, and cooperating with surrounding areas to increase carbon sequestration.
4. After further analysis, it consists of at least 3 categories of regions, namely: 1) Districts/cities that have reached NZE, such as Blora, Cilacap, and Grobogan. For this category, the strategy applied is to maintain a balance between emissions and sequestration capabilities; 2) Districts/cities that have not reached NZE but are still able to be supported by surrounding districts/cities such as Tegal, Pekalongan City, and Salatiga. Strategies that can be done are collaborating/ cooperating with buffer areas in the form of carbon trade to increase sequestration; 3) Districts/cities that have not reached NZE and cannot be supported by surroundings such as Semarang City. The strategy that must be taken is reducing carbon emissions through strict spatial regulation policies, the development of clean industries, the application of efficient transportation to save the use of fossil fuels, integrated waste management, etc.
5. Considering the limitations of this research, it is hoped that emission calculations can be carried out by considering the type of activity for each individual so that the results obtained will be more comprehensive.

