

Introduction
As environmental issues become increasingly prominent, climate change has become a global challenge. The global power sector contributes the largest CO2 emissions among all sectors, 14.6Gt of CO2 emissions were emitted in 2022 [1]. The low-carbon transformation of the power sector is a key link in achieving global CO2 emission reduction goals. As for the country, the proportion of CO2 emissions in China’s power sector to global CO2 emissions is the highest. In 2021, coal consumption in the power sector was 5,339 EJ, accounting for 52% of global coal power generation [2]. In addition, the CO2 emissions of China’s power industry can reach over 40% of the CO2 emissions [3]. So, to achieve the environmental goals of the world (e.g., limiting the world’s mean temperature to 1.5ºC) and China (e.g., “dual carbon” goal), the top priority is lowering the power sector’s CO2 emissions in China.
China’s primary energy consumption is dominated by coal, and CO2 emissions from coal power generation are the main source of CO2 emissions from China’s power sector [4]. To reduce CO2 emissions from the power sector, China has implemented a policy of eliminating outdated production capacity in the power sector [5], by setting technical and CO2 emissions standards and eliminating thermal power companies below the standards. Although the policy has reduced CO2 emissions of the power sector to a certain extent and improved the efficiency of the power sector’s CO2 emissions, it has also resulted in the power sector investing more capital and labor in the renovation and construction of power generation equipment, leading to an increase in overall costs. Therefore, there is an urgent need for a market-oriented policy to improve the current situation.
CETS, as a market-based environmental regulation tool, can achieve CO2 emission reduction in a more economical way by internalizing external environmental costs [6] and is currently implemented in many countries or regions, for instance, the EU, Korea, and Japan [7]. China also piloted CETS in selected provinces and first included the power sector in the national CETS [8], which has given great expectations for solving the problem of CO2 emissions from the power sector through the CETS.
Existing literature has carried out extensive research on the CETS’s environmental impact on CETS pilot provinces [9-13], including the CETS’s influence on the power sector’s CO2 emissions in CETS pilot provinces [4, 14]. However, due to disparities in resource endowments and economic development levels, there is an imbalance between provinces’ power demand and supply [15], and cross-provincial power transmission is a major feature of China’s power sector, for instance, in 2022, China’s cross-provincial power transmission was 1.77 TWh, accounted for 20% of the country’s power generation [16]. The omission of cross-provincial power transmission characteristics may lead to a biased assessment of the CETS’s impact on the power sector’s CO2 emissions. Although some scholars have considered the CETS in pilot areas to have spillover effects on the vicinity’s CO2 emission reduction, the discussion was mostly based on factors such as geographical distance [12, 17, 18], and few scholars have yet considered the characteristics of cross-provincial power transmission in the study of the CETS’s impact on the Chinese power sector’s CO2 emissions. On the other hand, existing research has discussed the environmental influence of cross-provincial power transmission [19], but the CETS’s environmental influence on cross-provincial power transmission has received less attention.
The purpose of the CETS is to reduce CO2 emissions in China’s power system. Compared to only considering the CETS’s influence on the power sector’s CO2 emissions in CETS pilot provinces, what is more important is whether the Chinese CETS can further promote CO2 emission reduction in China’s power system. Can the CETS promote the clean and green transformation of the power system? The discussion of the above issues is of great significance for the construction of the national CETS and the CO2 emission reduction of China’s power system.
Combined with the above discussion, we attempt to incorporate the characteristic of cross-provincial power transmission in the study of the CETS’s impact on the Chinese power sector’s CO2 emissions, that is, to study the CETS’s impact on the Chinese power system’s CO2 emission reduction. To be specific, we choose WEPT– the representative cross-provincial power transmission project (In 2020, WEPT completed cross-provincial power transmission of 1.536 TWh, accounting for 15% of China’s power generation) [20], as an example to study whether CETS reduces the power sector’s CO2 emissions in the primary provinces of WEPT. Subsequently, from the perspective of the cleanliness of the power structure, the mechanism of CETS lessening CO2 emissions in the Chinese power sector is explored. Finally, heterogeneity testing is conducted based on three aspects: regional characteristics, government environmental regulatory intensity, and CETS characteristics.
There are three primary contributions to this study. First, we considered the characteristic of cross-provincial power transmission in the study of the CETS’s impact on the Chinese power sector’s CO2 emissions, taking WEPT as an example to study the CETS’s influence on the Chinese power system’s CO2 emissions. Second, we enriched the relevant studies on the environmental effects of cross-provincial power transmission by considering the CETS’s impact in the study of the environmental effects of cross-provincial power transmission. Third, we examined the role that the cleanliness of the power structure plays in the CETS to reduce the power sector’s CO2 emissions, and conducted a comprehensive exploration of heterogeneity.
Background Information on the Chinese Power Sector and WEPT
The Provincial Distribution of the Chinese Power Sector’s CO2 Emissions
Fig. 1a) and Fig. 1b) depict China’s province-level power sector’s CO2 emissions in 2009 and 2019, respectively. In 2009, the top five provinces for the power sector’s CO2 emissions were Shandong, Jiangsu, Inner Mongolia, Guangdong, and Henan. And the top five provinces in 2019 were Inner Mongolia, Shandong, Jiangsu, Shanxi, and Hebei. Most of the power sector’s CO2 emissions are generated in the economically advanced eastern region. The need for economic growth has caused the eastern region’s power sector to emit more CO2 emissions than other regions. Inner Mongolia is rich in coal resources, accounting for one-sixth of the country’s total, with coal being the main source of electricity production. The demand for electricity from other provinces has caused the power sector in Inner Mongolia to emit a great deal of CO2 emissions.
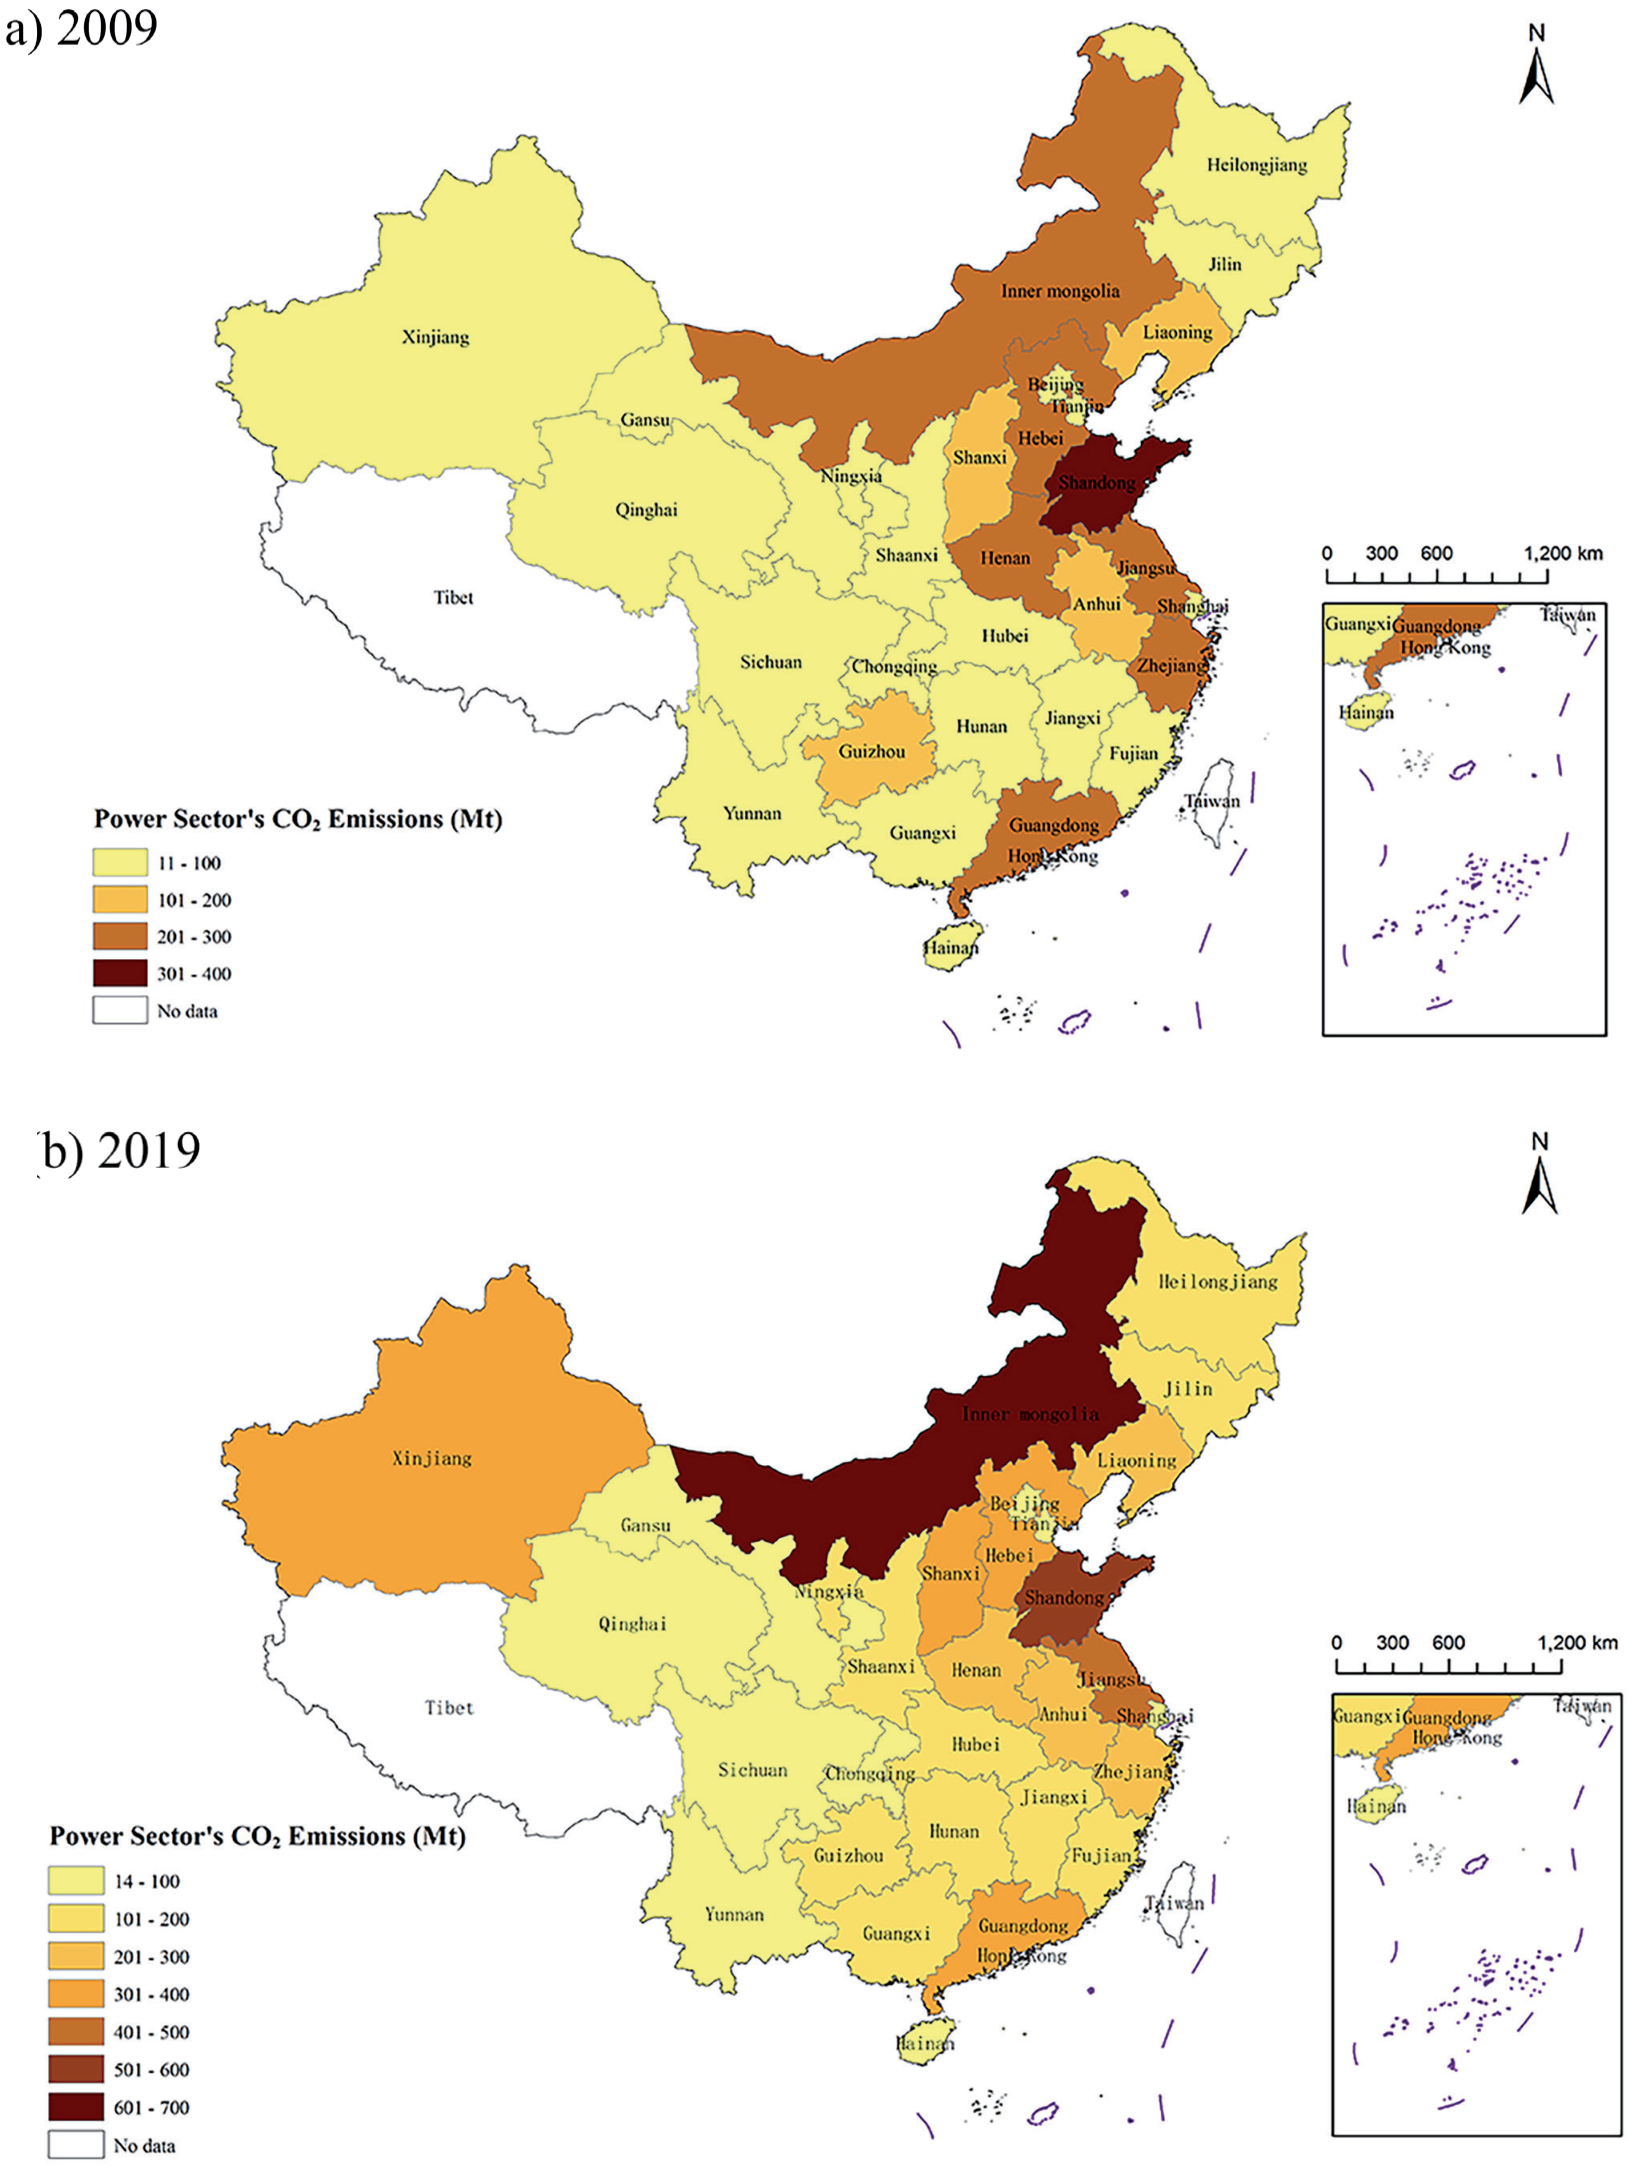
As for temporal trends, on the one hand, the standard deviation of the province-level power sector’s CO2 emissions has risen from 88.79 in 2009 to 148.45 in 2019, indicating that the differences in the power sector’s CO2 emissions across provinces have gradually increased over time. On the other hand, from 2009 to 2019, The power sector’s CO2 emissions shifted from the eastern areas to the central areas. Overall, the power sector’s CO2 emissions have climbed from 3,635 Mt in 2009 to 5,626 Mt in 2019.
The Provincial Distribution of Power Shortage/Surplus
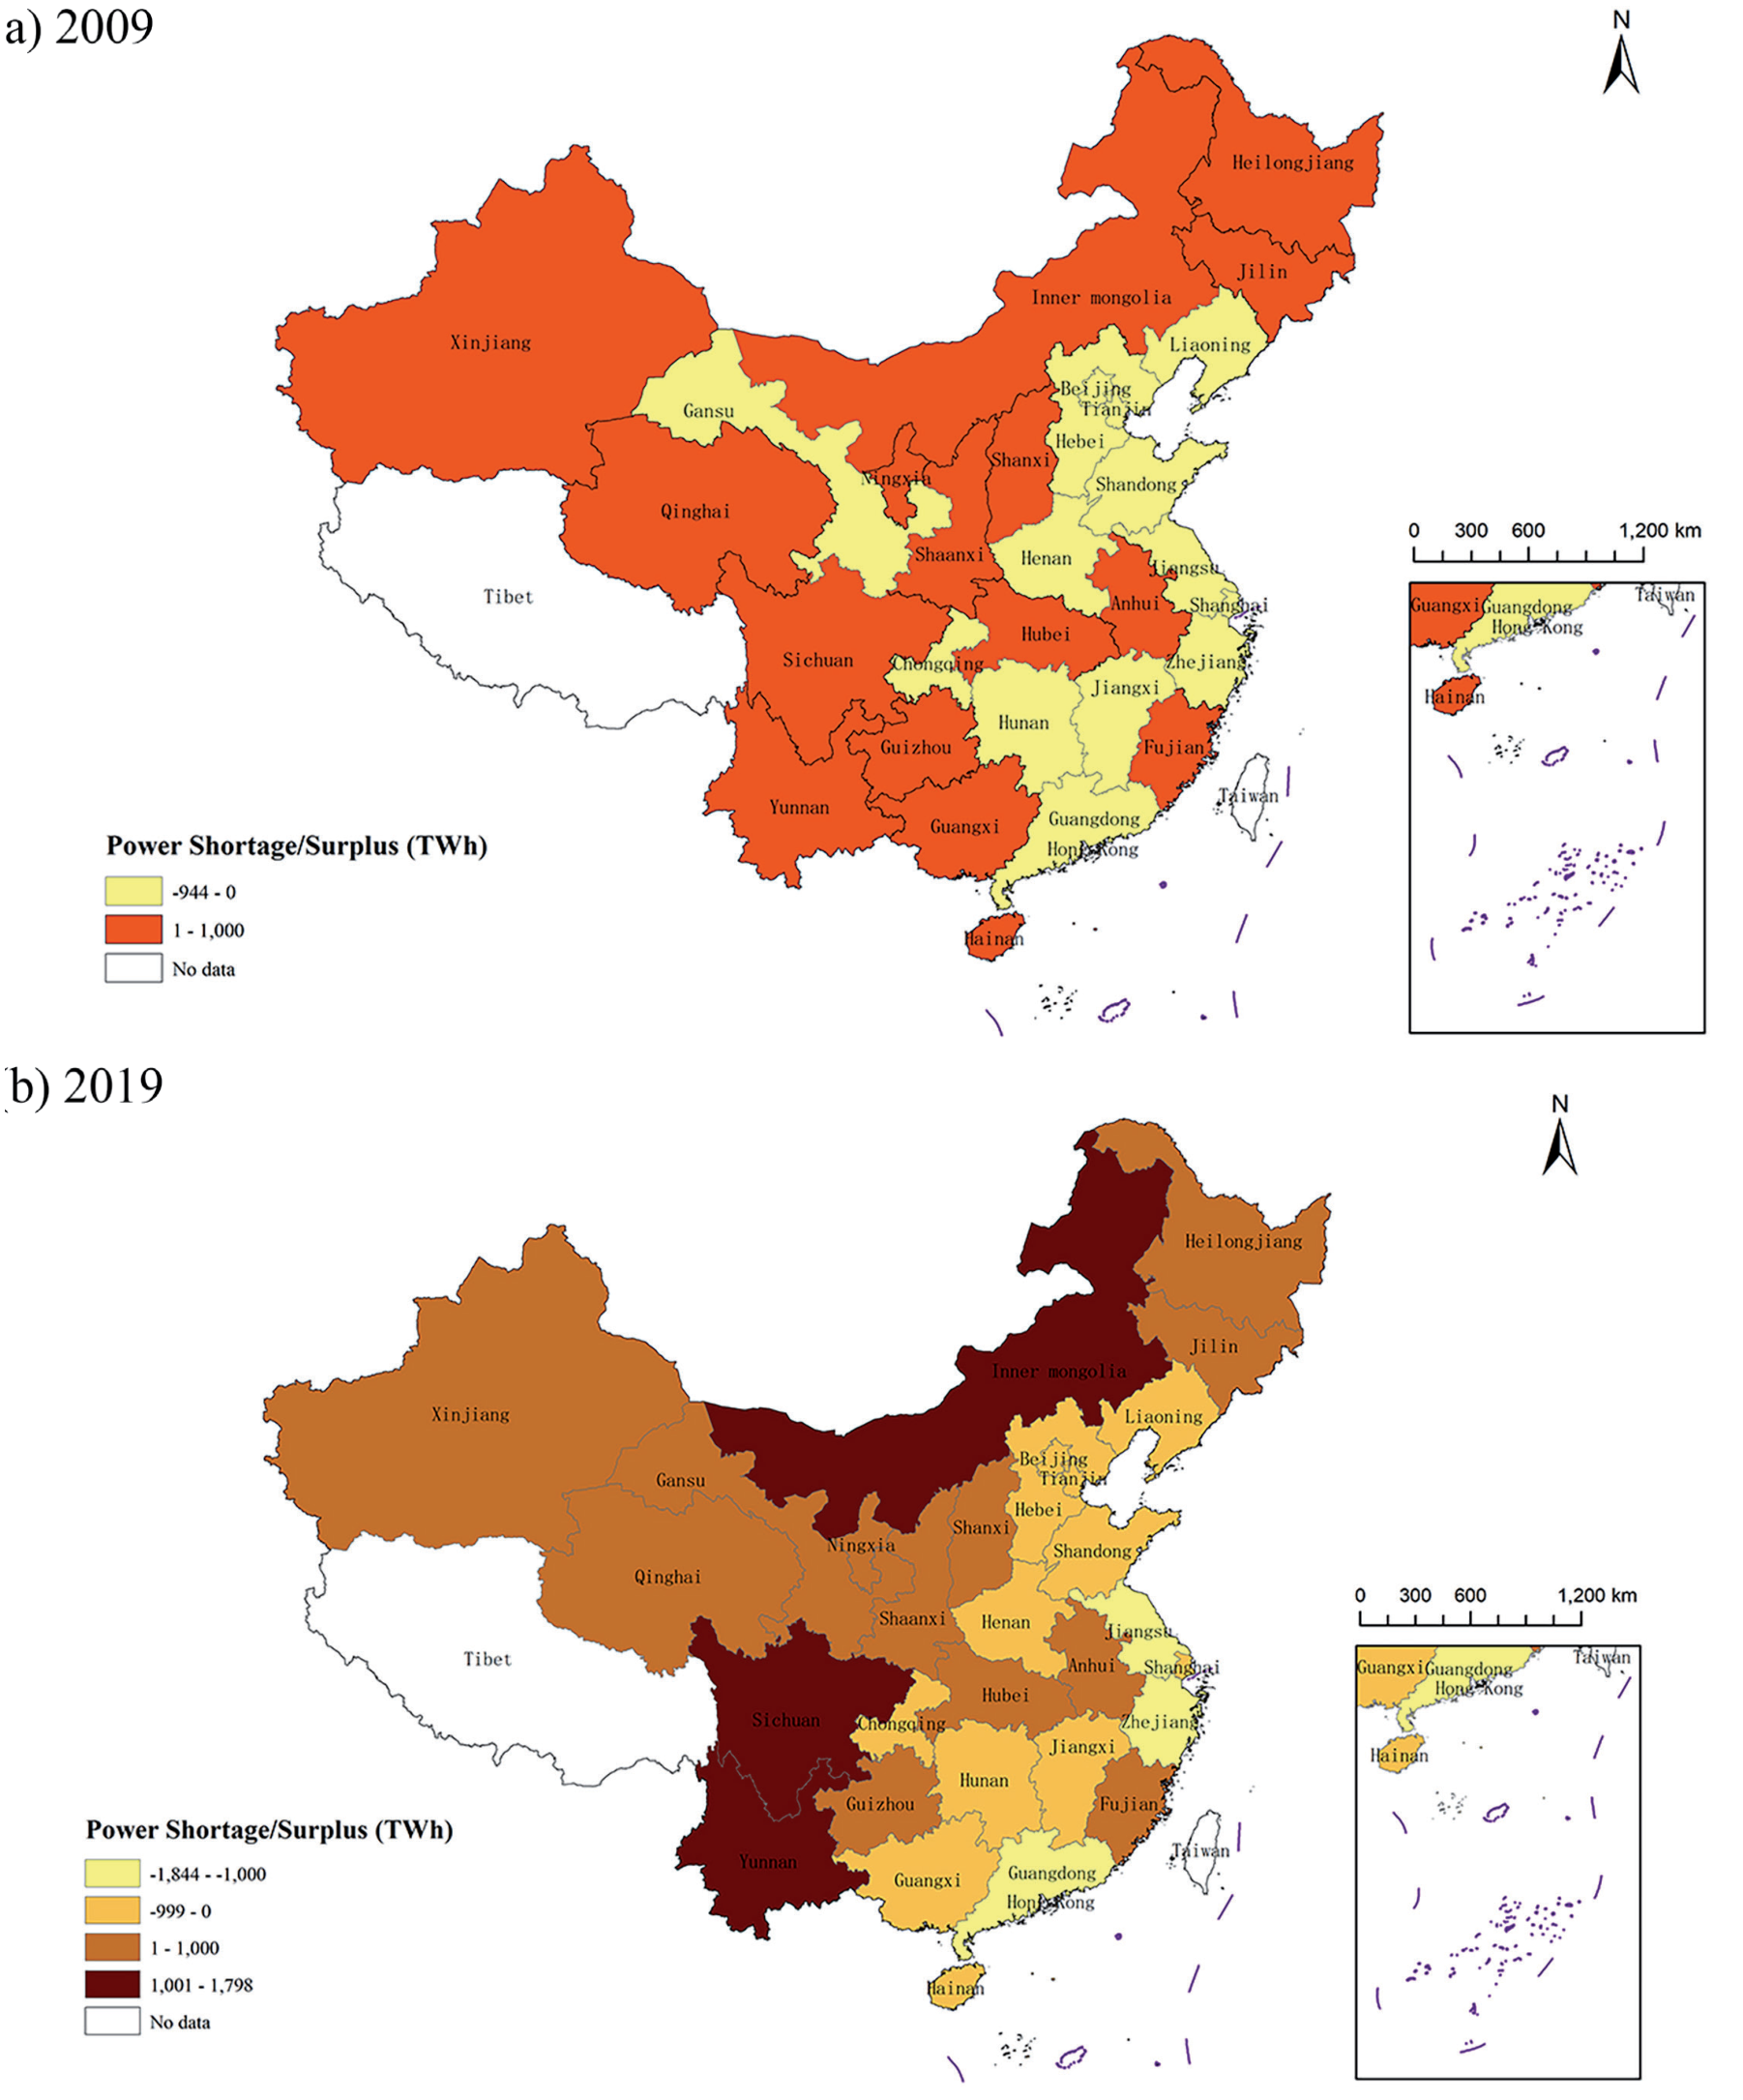
Fig. 2a) and Fig. 2b) show China’s province-level power shortage/surplus in 2009 and 2019, respectively. Most of the power shortage provinces are in the southeast region, while most of the power surplus provinces are in the northwest region. China’s electricity production and consumption are extremely imbalanced [21], and this is mainly because of the imbalanced distribution of energy resources and load centers. There is a greater concentration of energy in the western than in the eastern China, as well as more in the northern than in the southern China [22]. Consequently, most of the electricity generation is concentrated in the northwest, while China’s central and eastern regions have long been the power demand center [23].
The standard deviation of the province-level power shortage/surplus has increased from 375.72 in 2009 to 836.42 in 2019, demonstrating that over time, provinces with power shortages rely more on electricity output from power surplus provinces, and power surplus provinces provide more electricity to power shortage provinces.
Background Information and Classification of WEPT
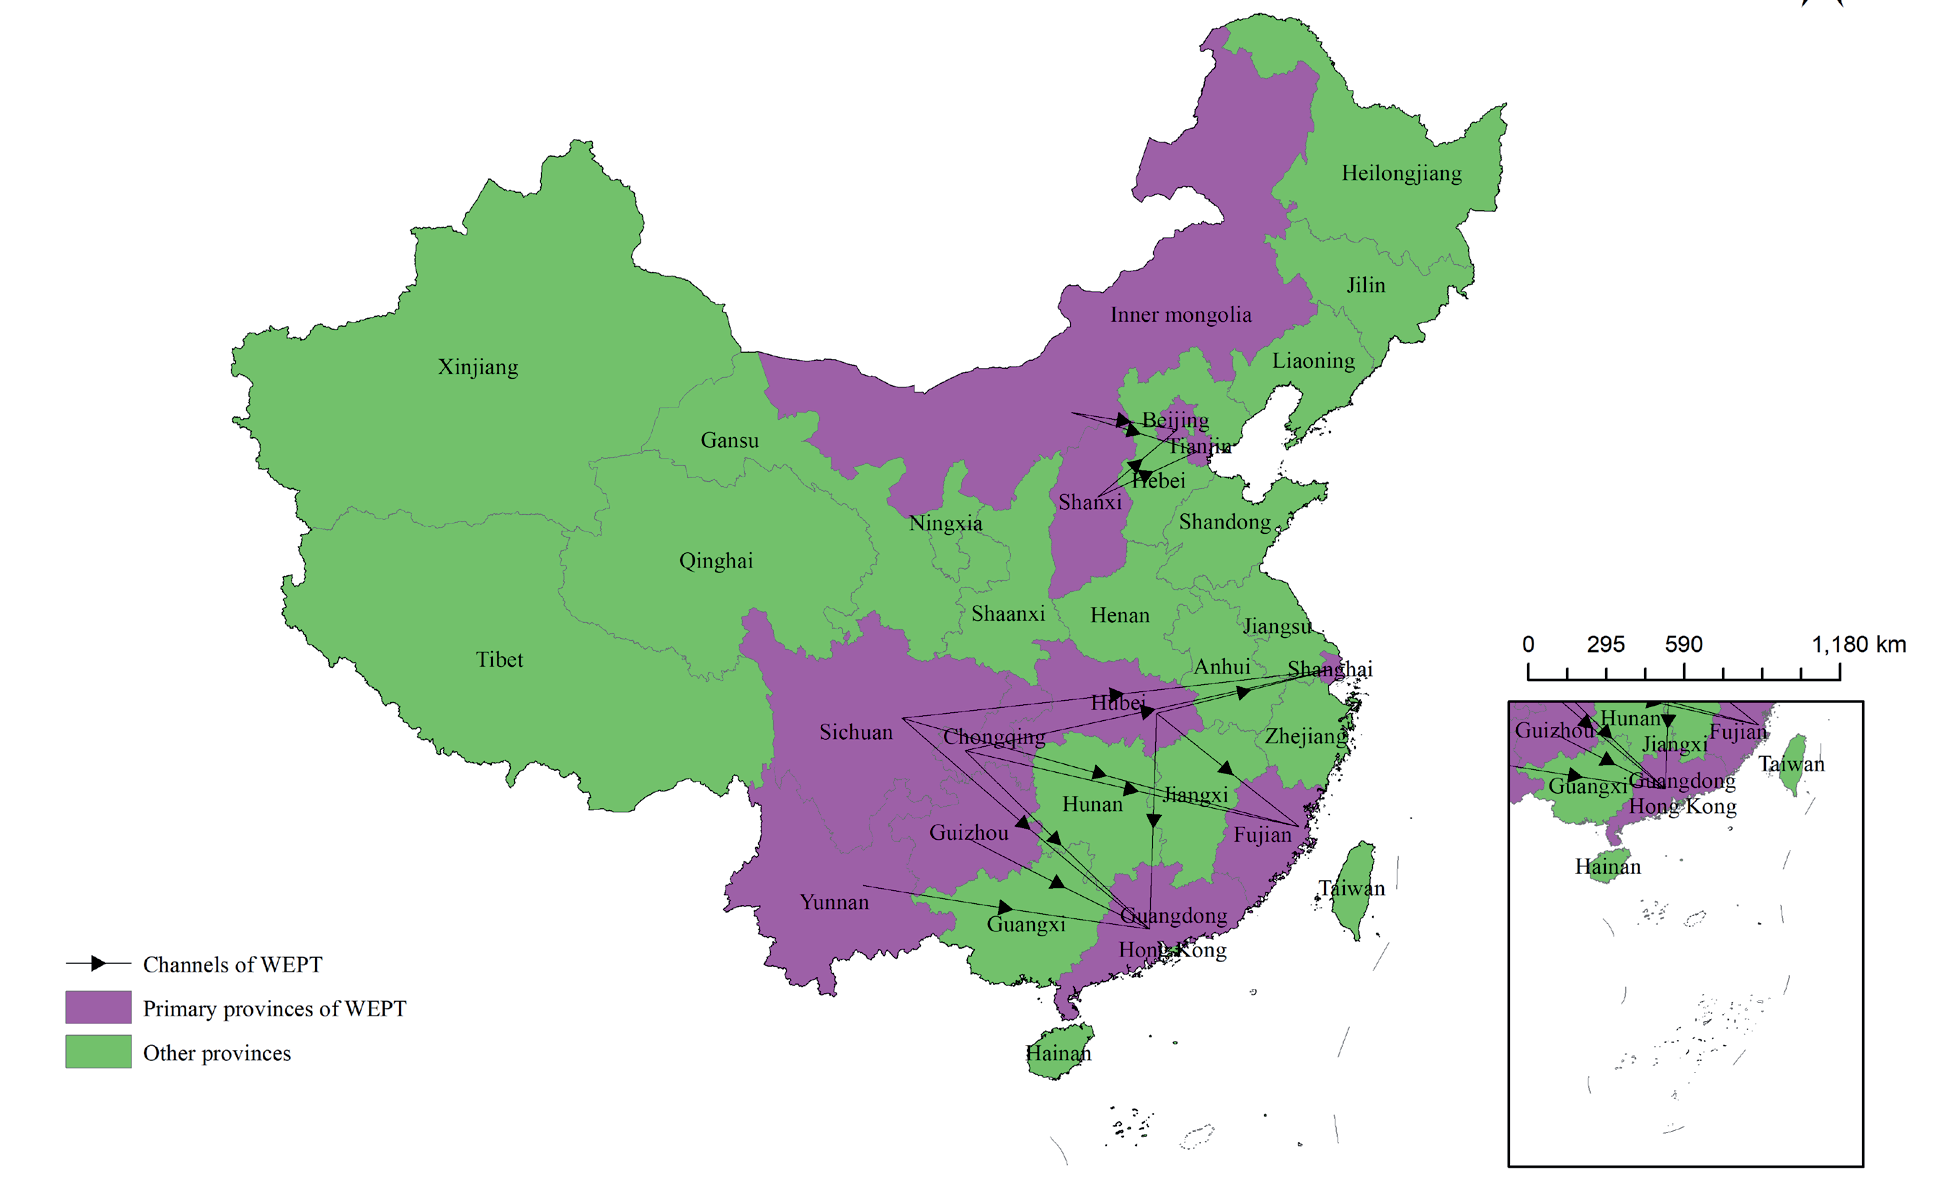
The WEPT is a representative project for cross-provincial electricity transmission in China. China’s WEPT was implemented to alleviate the uneven distribution of power resources and achieve efficient resource allocation in 2000. The WEPT has three major channels (Fig. 3), namely the northern, middle, and southern channels. The northern channel refers to the transmission of electricity from hydropower upstream of the Yellow River, as well as thermal power from Shanxi and Inner Mongolia to north China and Shandong; The middle channel is led by the Three Gorges Hydropower Station, which extends the distribution network westward to the upper Yangtze River so that Sichuan, Chongqing, and central China can jointly send power to east China and Guangdong; The southern channel involves developing hydropower in southwest China, thermal electricity in Yunnan and Guizhou, and transmission lines to bring power to Guangdong.
Fig. 3 also shows the primary province of WEPT. By comparing with pilot provinces in the CETS (Table 1), we found that the primary province of WEPT comprised all the CETS provinces. Based on the above, this paper divides the primary provinces of WEPT into the CETS pilot province of WEPT and non-CETS pilot provinces of WEPT based on whether the province is a CETS pilot province, as shown in Table 2. The primary provinces of WEPT include Beijing, Tianjin, Shanghai, Guangdong, Hubei, Chongqing, Fujian, Yunnan, Inner Mongolia, Guizhou, and Shanxi. CETS pilot provinces of WEPT include Beijing, Tianjin, Shanghai, Guangdong, Hubei, Chongqing, and Fujian. Sichuan only conducts Chinese Certified Emission Reduction (CCER) transactions and no CO2 quota transactions, and Shenzhen is subordinate to Guangdong province. So, Sichuan and Shenzhen have been excluded. Non-CETS pilot provinces of WEPT include Yunnan, Inner Mongolia, Guizhou, and Shanxi. Additionally, Beijing, Tianjin, Shanxi, and Inner Mongolia are the northern channel provinces of WEPT. Shanghai, Fujian, Hubei, Guangdong, and Chongqing are the central channel provinces of WEPT. Guizhou, Yunnan, and Guangdong are the southern channel provinces of WEPT; Electricity net inflow provinces of WEPT include Guangdong, Shanghai, Beijing, Chongqing, and Tianjin. Electricity net outflow provinces of WEPT include Fujian, Hubei, Shanxi, Inner Mongolia, Guizhou, and Yunnan. Furthermore, based on whether the province is a CETS pilot province, this research also divides the electricity net outflow provinces of WEPT into CETS pilot electricity net outflow provinces of WEPT (including Fujian and Hubei) and Non-CETS pilot electricity net outflow provinces of WEPT (including Shanxi, Inner Mongolia, Guizhou, and Yunnan).
Table 1.
Pilot provinces, and implementation year of CETS.
| Year | Province |
|---|---|
| 2013 | Beijing, Tianjin, Shanghai, and Guangdong |
| 2014 | Hubei, and Chongqing |
| 2016 | Sichuan, and Fujian |
Table 2.
Classification of primary provinces of WEPT.
Overall, the power sector in China is not isolated among provinces but interconnected. During the sample period, the CO2 emissions of China’s power sector have steadily increased, and there is a trend of CO2 emissions shifting from the eastern coastal areas to inland areas. Meanwhile, over time, the northwest region has produced more electricity and transmitted power to the southeast region through cross-provincial electricity transmission projects represented by the WEPT. Compared to focusing solely on changes in the power sector’s CO2 emissions in pilot provinces, studying the impact of CETS on the CO2 emissions of power systems represented by the WEPT has greater practical significance and importance.
Literature Review
Research on the CETS’s Influence on Lower CO2 Emissions
The CETS is a typical market-oriented CO2 pricing instrument. Extensive research has been conducted on the CETS’s influence on CO2 emissions abatement [9, 24, 25], innovation [26, 27], green total factor productivity [28, 29], etc. Overcoming CO2 emissions pollution is the primary objective of CETS [13]. Based on data at the provincial level [11], prefectural level [30], and enterprise level [10], scholars have studied the CETS’s impact on CO2 emissions and carbon intensity, and found that the CETS can significantly contribute to the reduction of CO2 emissions and carbon intensity in pilot regions and enterprises.
In deeper research, many scholars believed that the CETS in pilot areas have spillover effects on the vicinity’s CO2 emission reduction [12, 17, 18]. By combining policy evaluation methods with the spatial econometrics models, some scholars discovered that CETS can cut CO2 emissions in the vicinity of the CETS pilot areas [17, 18]. It was also found by Li et al. that CETS in pilot provinces had a spatial spillover impact on lowering transportation-related CO2 emissions, with the effect being greatest between 250 and 650 KM away [31].
Research on the Environmental Effects of Cross-Provincial Electricity Transmission
As for cross-provincial electricity transmission, existing research mainly focused on economic [15, 32, 33] and environmental benefits. In terms of environmental benefits, Yang et al emphasized the value of power transmission technology and interprovincial electrical transmission for lowering the power sector’s CO2 emissions [34]. Wang et al. found that ultra-high voltage transmission projects can significantly reduce CO2 emissions in China’s power sector [35]. Liu et al. also stated that the interprovincial transfer of power reduced the power sector’s CO2 emissions in China [19].
Research on the CETS’s Influence on the Power Sector’s CO2 Emissions
In the beginning, some studies included the power sector in the datasets to examine the efficacy of the CETS [36, 37]. By constructing a dataset of the industrial sector including the power sector at the provincial level, Hu et al. found that CETS can cut CO2 emissions in pilot provinces [36].
With further research, many studies solely focused on the Chinese CETS effect on cutting the power sector’s CO2 emissions. Lin and Jia constructed a CGE model and set 5 scenarios to study the environmental influence of national CETS involving only the electricity sector, and proposed that a nationwide CETS is a functional CO2 emission reduction instrument [14]. At the facility level, Wu et al. constructed a micro dataset of China’s thermal power plants and found that an increase in CO2 prices can significantly promote a decrease in CO2 emissions intensity [4]. Ma and Xu focused on the power sector and found that the CETS in pilot regions can form a spillover effect and promote the power sector’s CO2 emission reduction in adjacent areas [38].
However, few studies considered the characteristic of cross-provincial power transmission in the study of the CETS’s impact on the Chinese power sector’s CO2 emissions. Li et al. constructed an economic dispatch model and investigated the influence of power market reform and the CETS on the power sector’s CO2 emissions from the viewpoint of the power system, then found that the power sector’s CO2 emissions significantly decrease when the carbon prices are higher than 300 RMB/TCO2 [39]. Xiao et al. established a model for China’s power sector considering cross-regional power transmission and technological advances and found that appropriate carbon prices can promote the reduction of the power sector’s CO2 emissions [40].
In summary, since the announcement of China’s CETS in 2011, there have been numerous scholarly discussions on the CO2 emissions decline and spillover effects of the CETS from many dimensions. And some scholars carried out research in the power sector. However, most studies of the CETS’s impact on the Chinese power sector’s CO2 emissions ignore the characteristic of cross-provincial power transmission. Also, less research on the environmental effects of cross-provincial power transmission has considered the introduction of CETS. Therefore, we combine the CETS with the representative project of cross-provincial power transmission - the WEPT. From the viewpoint of the power system, we study the influence of the CETS on the power sector’s CO2 emissions in the primary provinces of WEPT. Based on these findings, this study additionally examines the impact mechanism and heterogeneity.
Theories and Hypotheses
The theoretical idea of CETS originated from Coase [41], who suggested applying market instruments to address the pollution emission problem. Without market failures and uncertain property rights, economic actors can effectively address the externality problem through transactions. The main logic is to include companies that meet the criteria in the CETS and issue a certain number of CO2 emission rights. In the compliance period, enterprises can trade CO2 emission rights in CETS. If the enterprise’s actual CO2 emissions are more than the acquired CO2 emission rights, the enterprise needs to buy the corresponding difference in CO2 emission rights in CETS resulting in damage to the interests; if the enterprise’s actual CO2 emissions are less than the acquired CO2 emission rights, then the enterprise can sell the surplus of CO2 emission rights and obtain profits. Depending on whether a province is a pilot province or not, theoretical analysis of the CETS’s influence on the power system’s CO2 emissions represented by the primary provinces of WEPT should be conducted from two aspects: the influence of the CETS on the power sector’s CO2 emissions in the CETS pilot provinces and the non-CETS pilot provinces of WEPT, respectively.
On the one hand, for the power companies that sell CO2 emission rights in CETS pilot provinces, according to the theory of externalities, CO2 emission rights become a new input factor in corporate production. Under the assumption of profit maximization, the seller, as the party benefiting from the CETS, increasing CO2 emissions is equivalent to increasing the production and operation costs of the enterprise, in which case the seller will not choose to increase CO2 emissions. In addition, when the expected benefits of the CETS are greater than the expected inputs for the low-carbon transition, the power companies prefer to use greater energy savings and cleaner thermal power production techniques [42], and actively expand the production of clean energy represented by hydropower to gain revenue through the CETS, resulting in reducing the power sector’s CO2 emissions [43].
On the other hand, the buyer of the CETS in the power sector bears a greater cost, as the government limits the power companies’ CO2 emissions. With the same scale of renewable energy, if the buyer wants to maintain or expand the scale of thermal power production, they will certainly buy more CO2 emission quotas from the CETS, which causes a rise in production costs and loss of market competitiveness. Additionally, the burden of declining market competitiveness will compel power companies to employ cleaner and more efficient thermal power generation technologies and to develop cleaner energy sources, then achieve CO2 emission reduction [44].
Hypothesis 1: The CETS reduces the power sector’s CO2 emissions in the CETS pilot provinces.
For the non-CETS pilot provinces of WEPT, in relevant theory on international trade, high-CO2 emitting industries may relocate due to variations of environmental regulations intensity, resulting in two outcomes: (1) The transferred areas will become a “pollution haven”, due to the increased production of pollutant emissions [45, 46]; (2) The transferred areas will become a “pollution halo”, due to the decreased production of pollutant emissions [47, 48]. The above research conclusions are also applicable to the Chinese power sector. There has been a long-standing problem of supply-demand mismatch in China’s power sector, cross-provincial power transmission represented by the WEPT is not rare. So, due to the cost differences of CETS pilots, the CETS pilots not only influence the power sector’s CO2 emissions in CETS pilot provinces of WEPT but also have spillover effects on non-CETS pilot provinces of WEPT, as WEPT is the largest cross-provincial power transmission project in China. This can be seen by pilot enterprises transferring more power orders or power enterprises to non-pilot regions, represented by the non-CETS pilot provinces of WEPT. Correspondingly, this may lead to two results: (1) Due to the transfer of more electricity orders and power enterprises out of the CETS pilot provinces towards the non-CETS pilot provinces of WEPT, the non-CETS pilot provinces of WEPT produce more thermal power to meet electricity demand, leading to a rise in the power sector’s CO2 emissions [49].
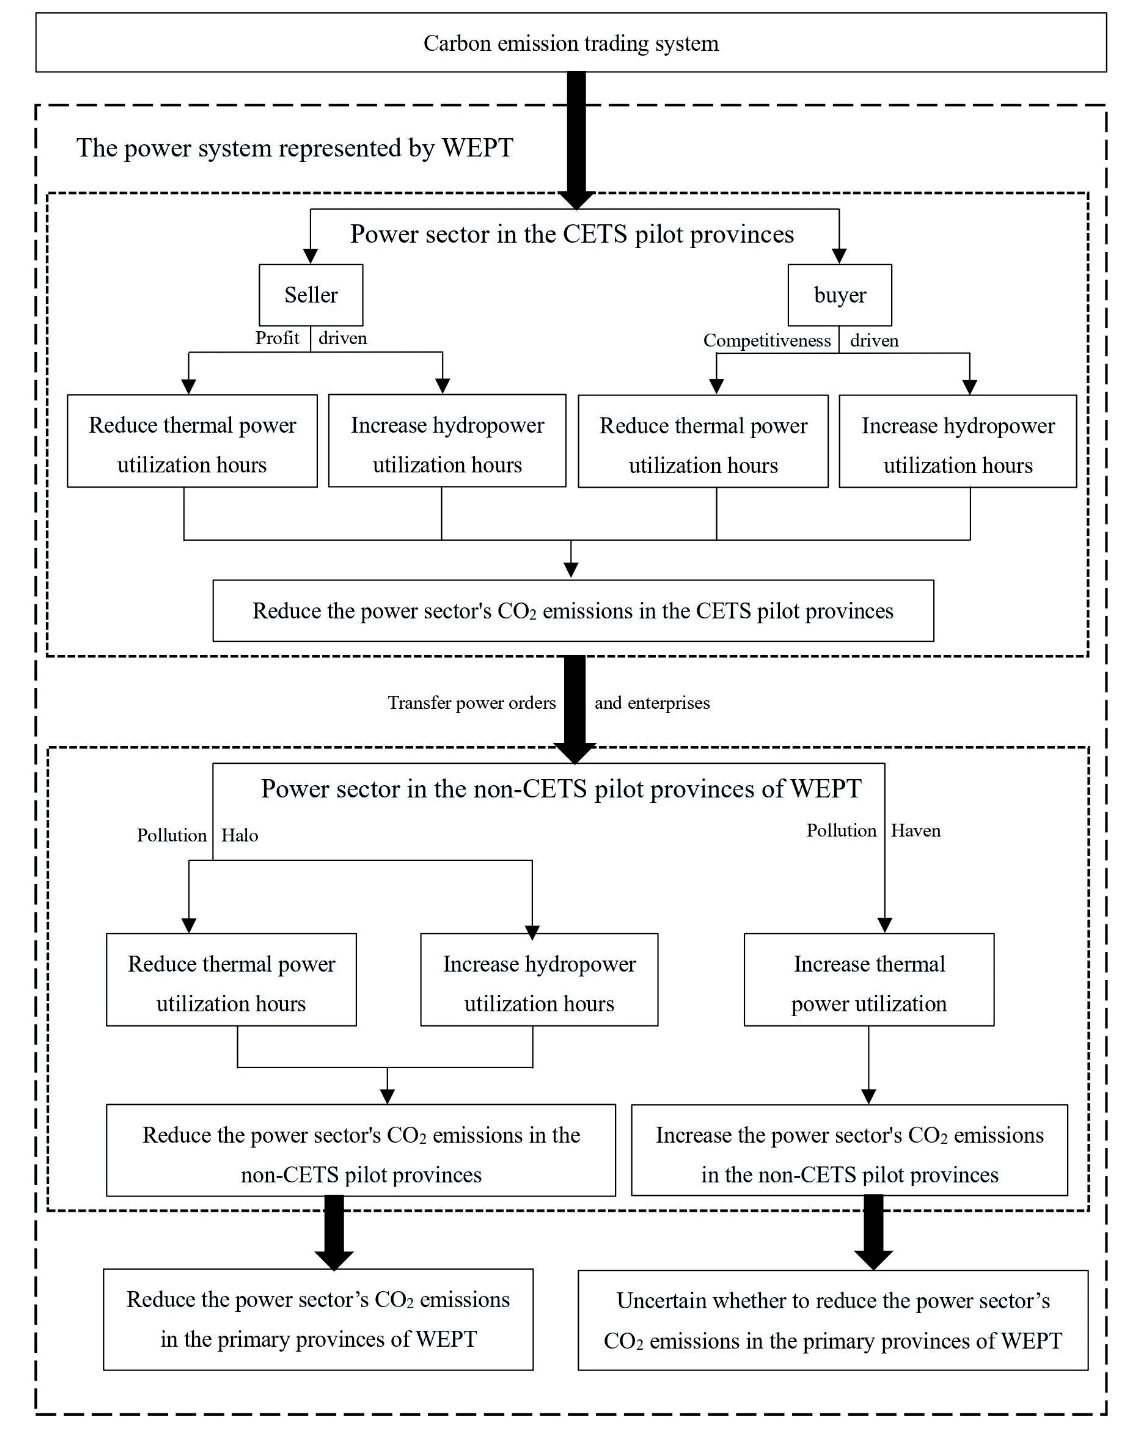
(2) Firstly, the rise in electricity orders will increase the operating revenue of power companies, enabling power enterprises to increase R&D investment in developing renewable power generation technology [50]. Secondly, the transferred power companies may have more advanced pollution treatment technologies compared to enterprises located in the non-CETS pilot provinces of WEPT. Finally, the increase in electricity demand has spurred the emergence of green power in the non-CETS pilot provinces of WEPT. So, the CETS in pilot provinces may reduce the power sector’s CO2 emissions in the non-CETS pilot provinces of WEPT.
Hypothesis 2a: The CETS in pilot provinces increases the power sector’s CO2 emissions in the non-CETS pilot provinces of WEPT.
Hypothesis 2b: The CETS in pilot provinces decreases the power sector’s CO2 emissions in the non-CETS pilot provinces of WEPT.
Reducing CO2 emissions from the power sector can be realized through a cleaner transformation of the power structure. Whether the CETS can promote the cleanliness of the power structure is the key to whether the CETS can promote CO2 emission reduction in the power sector. The cleanliness of the power structure can be manifested in the decline of the thermal power utilization hours and the increase of the hydropower utilization hours. On the one hand, under the CETS, the calculation criteria for the power sector’s CO2 emissions are derived from thermal power generation’s energy consumption [51]. Under the cost-benefit theory, CETS would encourage power companies to reduce the operating hours of high-emission equipment, replace it with low-emission, high-efficiency equipment, and reduce the thermal power utilization hours [52]. Reducing thermal power utilization hours through technological advances in thermal power generation and shutting down outdated power plants can reduce the power sector’s CO2 emissions effectively.
Table 3.
Baseline results.
On the other hand, when the reduction of CO2 emissions by low-carbon thermal power generation technology reaches the technological ceiling, at this point, the CETS will not bring a reduction in the power sector’s CO2 emissions but will lead to an increase in the cost of power companies. Therefore, power companies will seek alternative clean energy sources, such as hydropower, to produce electricity and thus profit from CETS. In addition, the CCER program under the CETS has also incentivized power companies to pursue clean energy development and increase hydropower utilization hours. Hence, the CETS can reduce CO2 emissions by increasing the utilization hours of clean energy represented by hydropower [53]. The layout of the mechanism is shown in Fig. 4.
Hypothesis 3: The CETS reduces the power sector’s CO2 emissions by gradually achieving the cleanliness of the power structure.
Methods and Sets of Data
Time-Varying DID Model
There are several research methods for determining the efficacy of CETS policies. The CGE model [54, 55] is a commonly used method, which can comprehensively evaluate the policy effectiveness. Another method for evaluating the efficacy of CETS is the SCM model [56, 57] developed by Abadie et al. [58]. The DID model [59, 60] is the primary method for studying the effectiveness of CETS policies, as it can partially alleviate endogeneity caused by selection bias. In this paper, we employ a time-varying DID model to evaluate the CETS’s influence on the power sector’s CO2 emissions in the CETS pilot provinces, the non-CETS pilot provinces of WEPT, and the primary provinces of WEPT, respectively. The baseline model is listed below:
Table 4.
Temporal placebo test.
The letters i, t, and k represent the province, year, and kth variables, respectively. Yit is the dependent variable, which indicates the power sector’s CO2 emissions of province i in year t. DIDit is the key explanatory variable, the value rules will be explained later. β is the estimated coefficient of DIDit , when β>0, CETS increases the power sector’s CO2 emissions of treated provinces; when β<0, CETS decreases the power sector’s CO2 emissions of treated provinces. controlkit denotes the kth control variable that affects the power sector’s CO2 emissions and varies with province i and year t. γi denotes province-fixed effects, which account for province factors that influence the power sector’s CO2 emissions but don’t change over time. δt denotes time-fixed effects and is used to control the time factors that influence all provinces over time. εit stands for the error term.
When studying the CETS’s influence on the power sector’s CO2 emissions in the CETS pilot provinces, for the accuracy of results, non-CETS pilot provinces of WEPT are excluded from the sample based on Table 2. According to Table 1, the value rule of DIDit is: when i represents Beijing, Tianjin, Shanghai, and Guangdong and t≥2013, or i represents Hubei, and Chongqing and t≥2014, or i represents Fujian and t≥2016, the DIDit = 1; in addition, DIDit = 0.
In the same way, when studying the spillover effects of CETS pilot provinces on lowering the power sector’s CO2 emissions in the non-CETS pilot provinces of WEPT, the CETS pilot provinces are excluded from the sample. Given that Yunnan and Guizhou deliver electricity to Guangdong, whereas Inner Mongolia, and Shanxi transmitter power to Beijing, and Tianjin, and Beijing, Tianjin, and Guangdong all launched CETS pilots in 2013, the value rule of DIDit is: when i represents Inner Mongolia, Shanxi, Yunnan, and Guizhou and t≥2013, the DIDit = 1; in addition, DIDit = 0.
This study also evaluates the CETS’s influence on the power sector’s CO2 emissions in the primary provinces of WEPT. It is a full-sample analysis. The value rule of DIDit is taken according to the above DIDit value rules of CETS pilot provinces and non-CETS pilot provinces of WEPT.
Variable Description
Dependent variables and key explanatory variables. The dependent variable is the logarithmic form of the Chinese power sector’s CO2 emissions by province (LNco2). The key explanatory variable is DIDit, the value rules have been explained above.
Control variables. Given that the power sector’s CO2 emissions and economic development have a strong relationship, the development of the power industry is heterogeneous across provinces. To make the CO2 emissions in the power industry comparable between different provinces, controlling for the heterogeneous characteristics of economic development and power sector development in different provinces is necessary. This paper combines the relevant studies of other scholars [13, 61] with the characteristics of the electric sector [52] to select control variables. The control variables are as follows: (1) The extent of economic development. Represented by actual per capita GDP (LNpgdp) and its squared term (LNpgdpp), calculated in 2008 as the base year; (2) Industrial structure, calculated as the proportion of secondary (psi) and tertiary industry (pti); (3) The degree of economic agglomeration. Expressed as the population size (LNps) and population density (LNupd); (4) The degree of market development. Measured by the total marketization process score (LNtsmp); (5) The effectiveness of environment protection. Expressed as the government’s expenditure on environment protection (LNiep); (6) Control variables related to the electric industry. Including the social electricity consumption (LNsec), the standard coal consumption of thermal power generation (LNsccpg), and the capacity of thermal power generation equipment (LNctpge).
Mechanism variables. Take the number of thermal power utilization hours (LNtpuh) and hydropower utilization hours (LNhpuh) to represent the cleanliness of the power structure.
Data Source
From 2009 to 2019, this study compiles panel data from 30 Chinese provinces. Due to the limitations of available data, Tibet, Taiwan, Hong Kong, and Macao are excluded from the sample. The Chinese power sector’s CO2 emissions in provinces are obtained from the CEADs [62-65]. The China Electricity Statistical Yearbook (2010-2020) is consulted for data related to the power sector. The data of other control variables are from the WIND and CEI databases.
Result and Discussion
Baseline Results
All results of regression account for province-fixed and year-fixed effects. Serial correlation and heteroskedasticity issues are addressed using the robust standard errors of provincial clustering. In Table 3, columns (1)-(2), columns (3)-(4), and columns (5)-(6) are the regression results for the CETS pilot provinces, the non-CETS pilot provinces of WEPT, and the primary provinces of WEPT, respectively. When no control variables are added, DIDit coefficients β of CETS pilot provinces and primary provinces of WEPT are both significantly negative. The coefficient β for non-CETS pilot provinces of WEPT although negative, but statistically insignificant. After the control variables are added, despite varying levels of significance, the DIDit coefficients β for CETS pilot provinces, non-CETS pilot provinces of WEPT, and primary provinces of WEPT are all significantly negative. The CETS in the pilot provinces not only lowers the power sector’s CO2 emissions but also shows a positive power sector’s CO2 emission reduction spillover effect in non-CETS pilot provinces of WEPT. Hypothesis 1 and Hypothesis 2b are verified. Additionally, The CETS decreases CO2 emissions of the primary province of WEPT and reaches a power sector’s CO2 emission reduction from the viewpoint of the power system.
Driven by profit and competitiveness, the CETS reduces the power sector’s CO2 emissions in CETS pilot provinces through a market mechanism, while causing the power sector in CETS pilot provinces to transfer power orders or enterprises to non-CETS pilot provinces of WEPT, enabling the power sector in non-CETS pilot provinces of WEPT to carry out clean technology transformation or clean energy construction. At the same time, during the sample period, the signal of the establishment of a national CETS also prompted the power sector in non-CETS pilot provinces of WEPT to undergo green transformation, in the hope of benefiting from the national CETS, ultimately promoting CO2 emission reduction in the power system represented by WEPT.
Parallel Trend and Dynamic Effect Tests
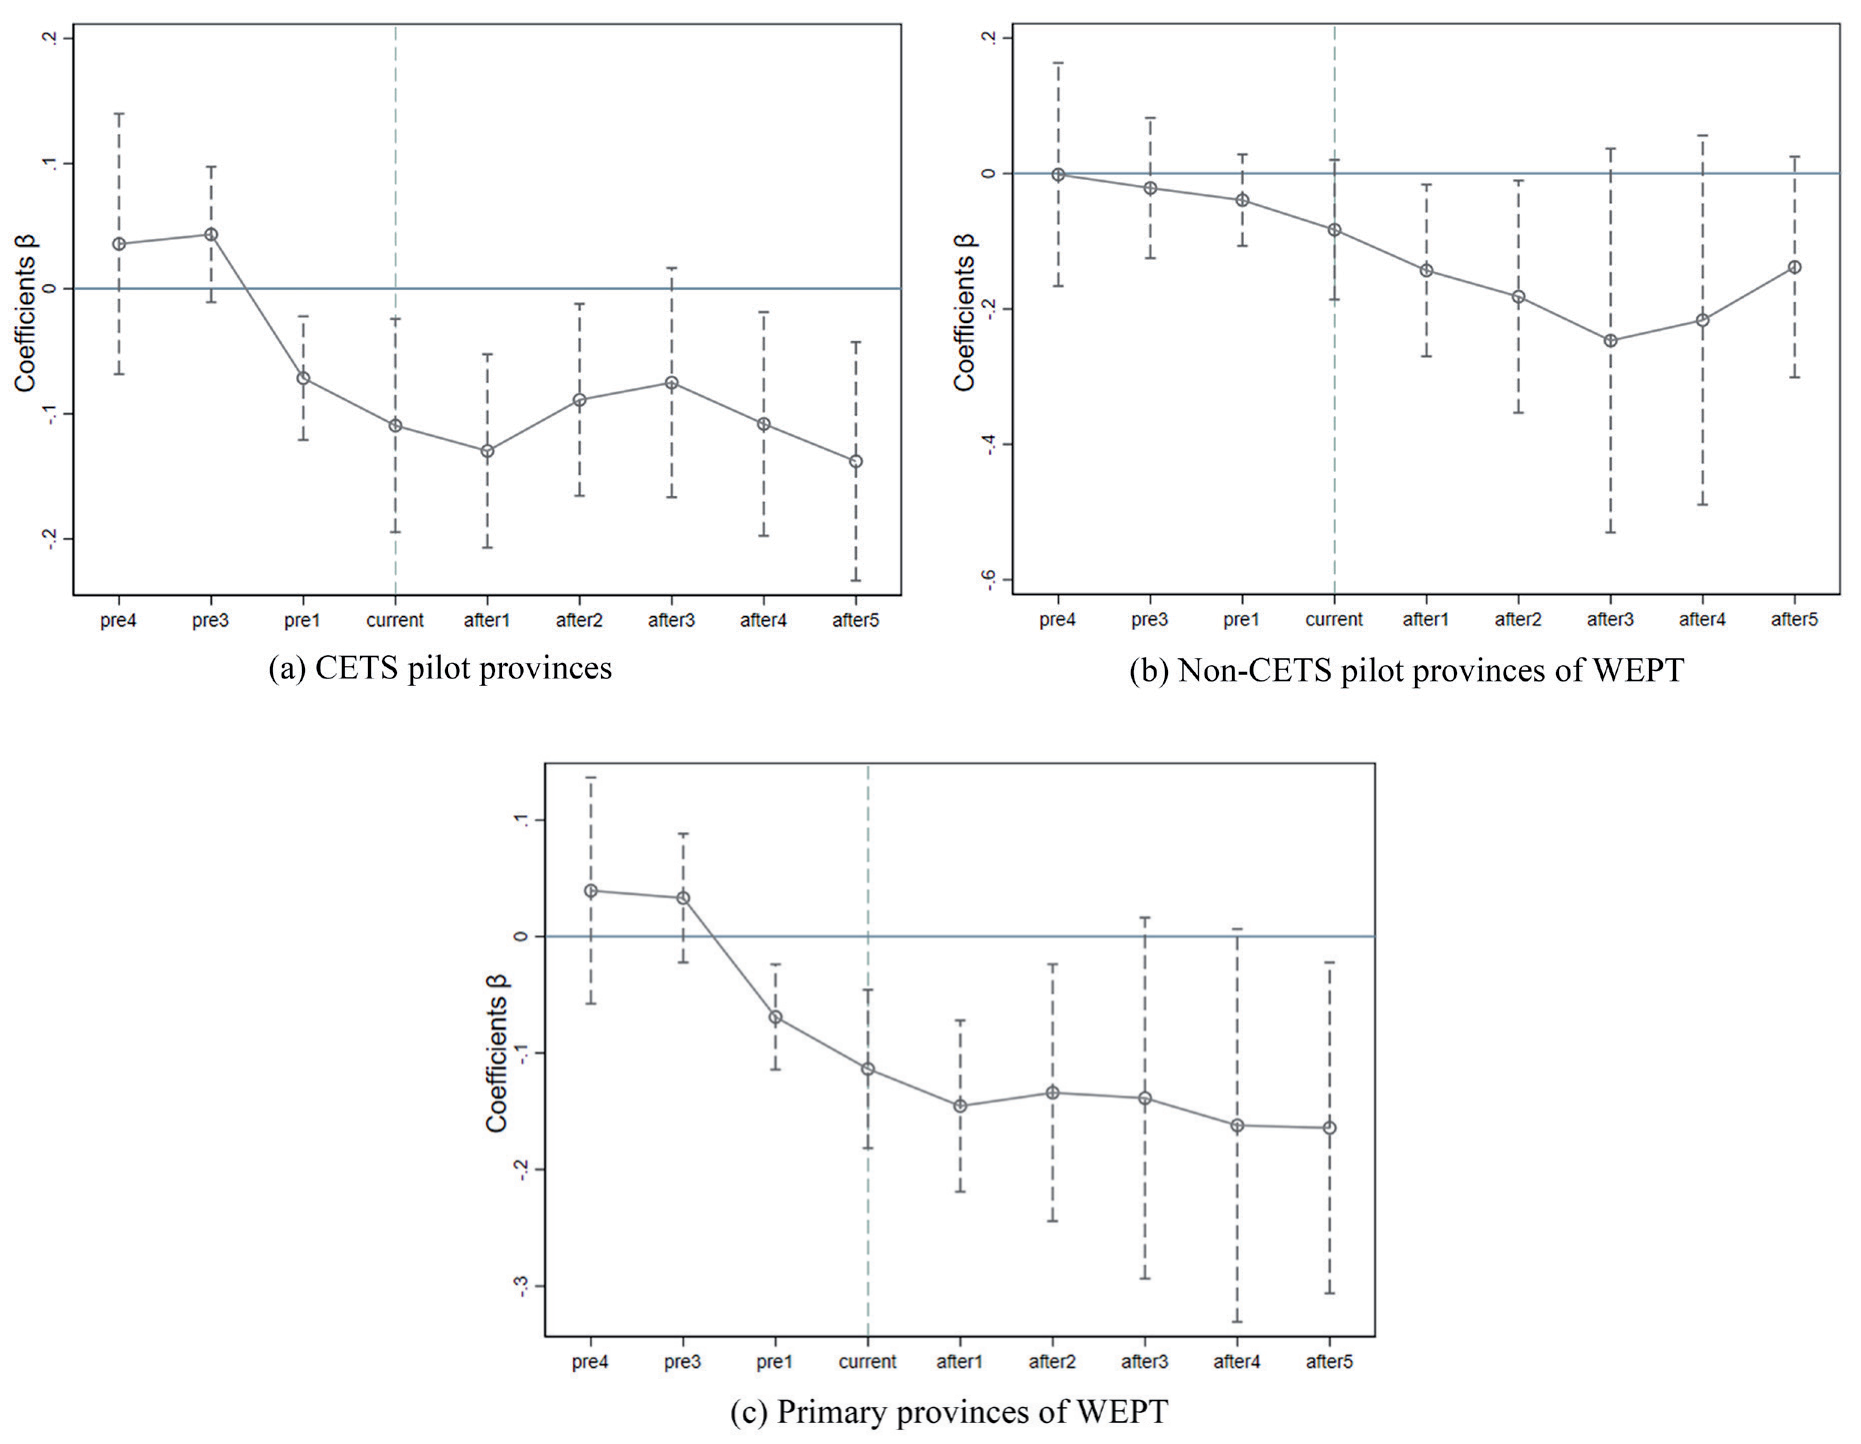
The parallel trend assumption must be met while adopting the DID method to estimate policy impact. Based on the event analysis method [66], we evaluate the assumption of parallel trends and examine the dynamic effects of CETS. Specifically, using the second year before the launch of the CETS in pilot provinces as the benchmark for comparison, considering the limited data from the fifth to seventh years before the CETS introduction and the sixth year after the CETS introduction, this article summarizes the data from the fifth to seventh years before the CETS introduction into period -4, and the data from the sixth year after the CETS introduction into period 5. The model is as follows:
Where DIDipre, DIDicur, and DIDiaft represent the intersection terms of the year dummy variables (Four years before, at the time of, and five years after the start of CETS in pilot provinces) and the corresponding policy dummy variables. βpre, βcur, and βaft are the corresponding coefficients. The meanings of the other symbols are equivalent regarding Equation (1).
For the results of the CETS pilot provinces (Fig. 5a), the coefficients β from the third to fourth years before launching the CETS in pilot provinces are not significant, indicating that the power sector’s CO2 emissions agree with the concept of the parallel trend hypothesis. Simultaneously, the corresponding coefficient β for the first year preceding the introduction of CETS in pilot provinces is significantly negative, meaning that there is a certain “anticipatory effect” of reducing the power sector’s CO2 emissions in CETS pilot provinces; Fig. 5b) shows the results for the non-CETS pilot provinces of WEPT, the coefficients β before launching the CETS in pilot provinces do not significant, so, the power sector’s CO2 in non-CETS pilot provinces of WEPT also satisfy the concept of the parallel trend hypothesis. The regression results for primary provinces of WEPT (Fig. 5c) and the results for the CETS pilot provinces are similar, with the corresponding coefficient β for the year before the launch of CETS in pilot provinces being significantly negative, representing an “anticipatory effect”. The above results are close to existing studies, many scholars found that the effects of CETS in pilot provinces began to emerge in 2011 [67, 68]. The power companies anticipated the launch of CETS in pilot provinces and upgraded their power generation technologies and generation methods in advance, which lowered the power sector’s CO2 emissions. Based on the above analysis, the CETS pilot provinces, the non-CETS pilot provinces of WEPT, and the primary provinces of WEPT all agree with the concept of the parallel trend hypothesis.
For the dynamic effect, the coefficients β of the CETS pilot provinces have a decreasing trend in the period when the CETS in pilot provinces are implemented and the first year after the implementation, and the coefficients β are significant. While the corresponding coefficients β exhibit an upward trend in the second and third years following the execution of the CETS in pilot provinces, and the third year is not significant, showing a certain “policy rebound effect”, and then the corresponding coefficients β maintain a decreasing trend. The “policy rebound effect” in non-CETS pilot provinces of WEPT is more obvious than in the CETS pilot provinces, with a significant downward trend from the first to the third years following the launch of the CETS in pilot provinces, the coefficients β are gradually insignificant. Then the coefficients β show an upward trend. Although the coefficients β of the primary provinces of WEPT in the third and fourth years were not significant after the implementation of the CETS in pilot provinces, the coefficients β of the primary provinces of WEPT show a downward trend overall. So, from a dynamic perspective, the CETS have an effective effect on the power system’s CO2 emission reduction.
Robustness Tests
Temporal and Spatial Placebo Tests
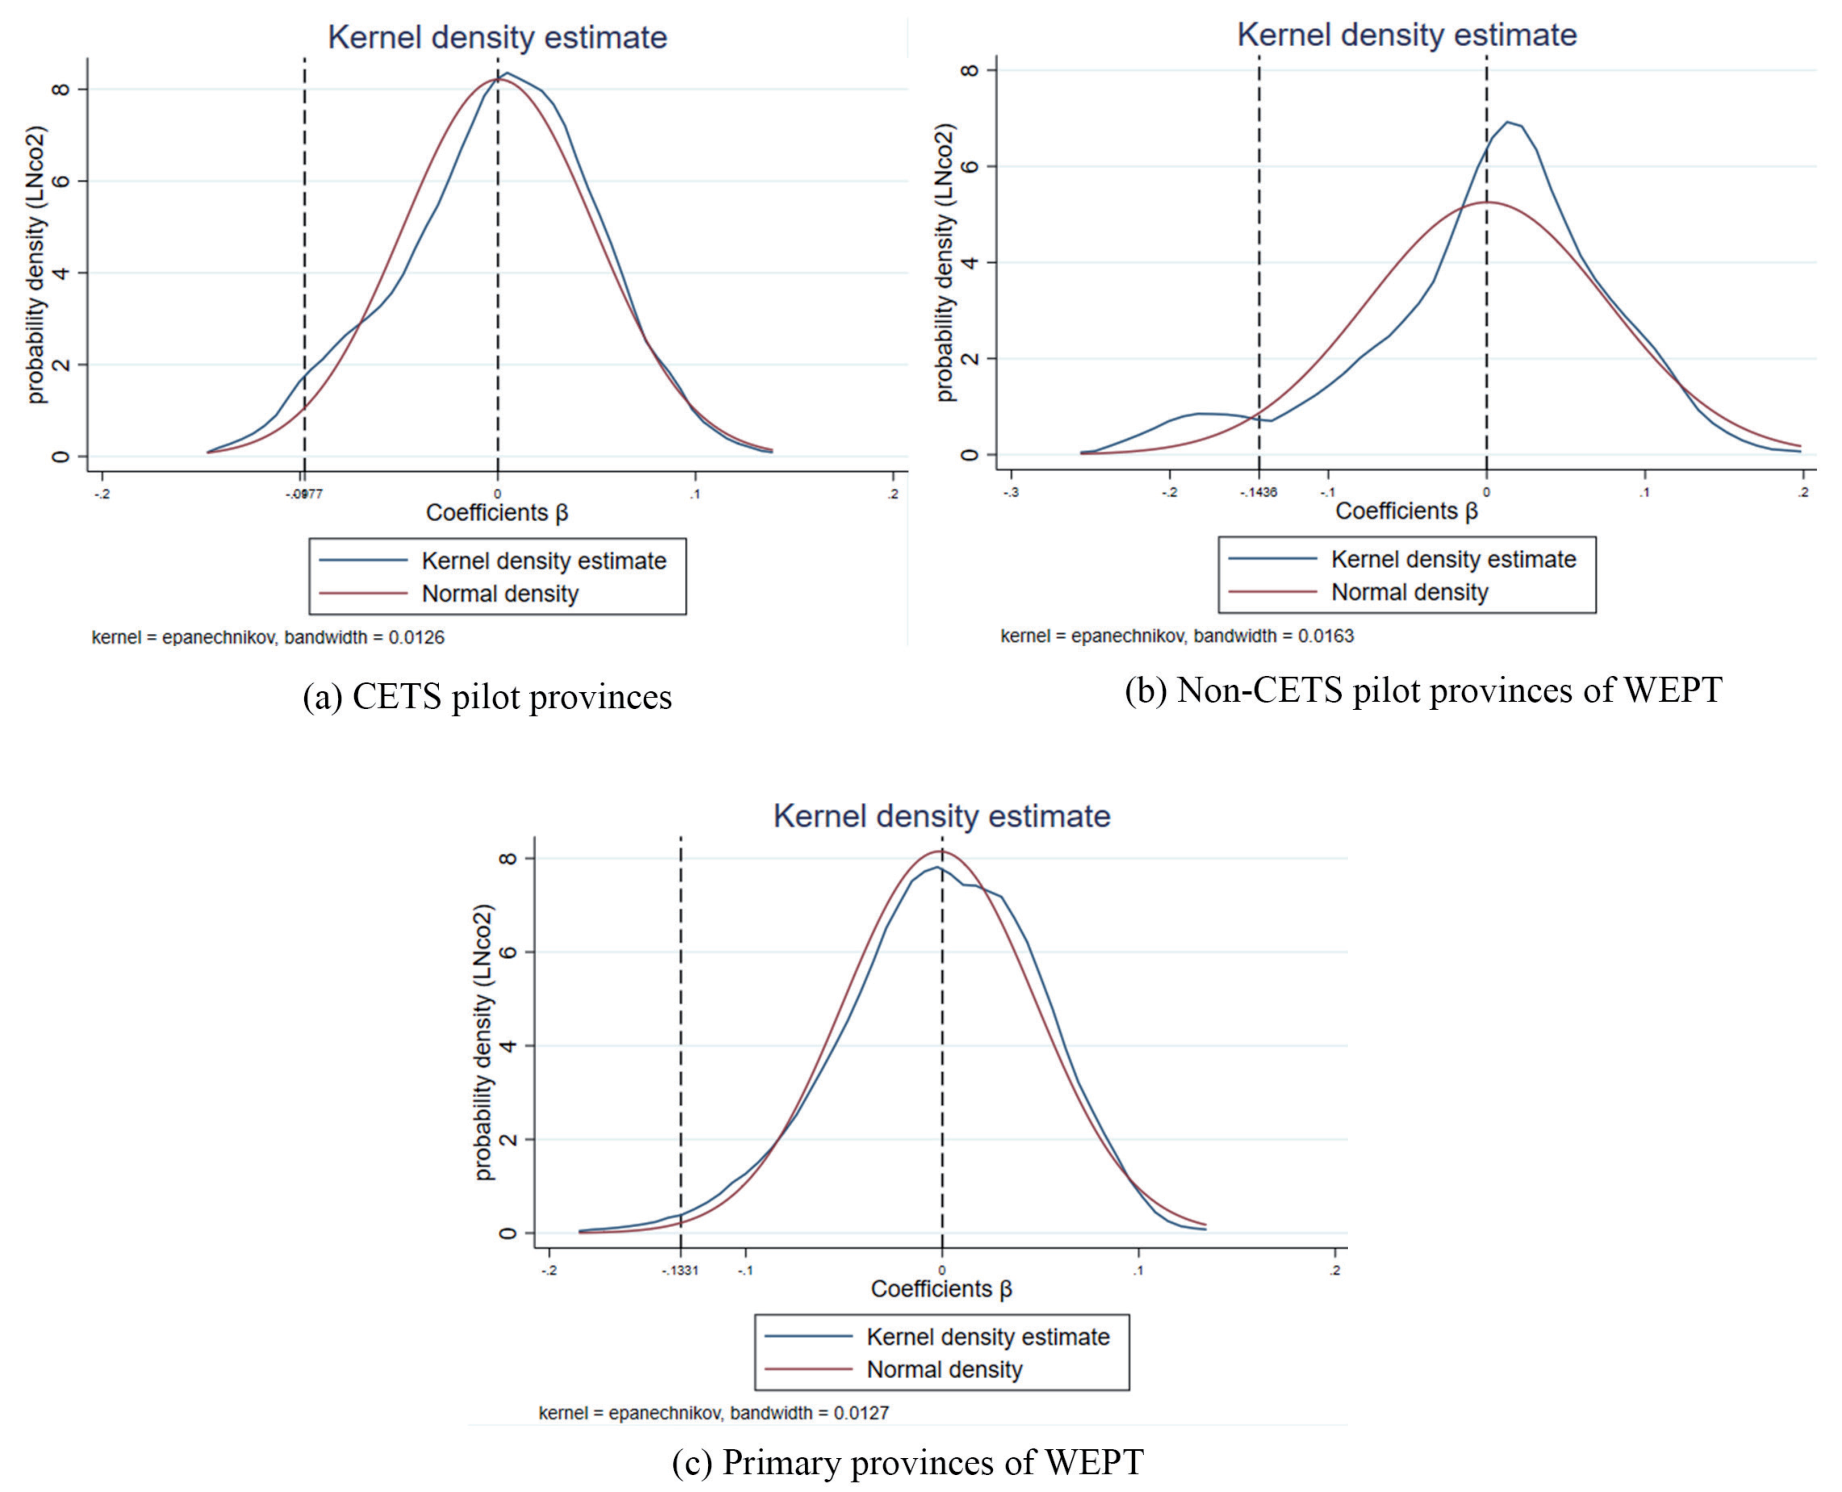
The baseline results in Table 3 may be biased due to variables that may be omitted at the year or province level. Therefore, to improve the reliability of baseline results, two placebo experiments [68] are conducted: varying the launch time of the CETS in pilot provinces and randomly assigning the CETS pilot provinces, the non-CETS pilot provinces of WEPT, and the primary provinces of WEPT, respectively.
The first check is whether the baseline results are robust to the launch year of CETS in pilot provinces. Due to the importance of meeting electricity demand for economic development, while cutting CO2 emissions, the province’s electricity demand ought to be taken into consideration, i.e., the elimination of the obsolete power capacity must not result in a power deficiency in the province. In addition, from a technical perspective, new devices for energy generation and the construction of the group’s network, etc., will require more time. Therefore, the implementation time of CETS in pilot provinces that are respectively lagged by one and two periods. Columns (1), (3), and (5) in Table 4 lagged the launch of CETS in pilot provinces by one period, and columns (2), (4), and (6) lagged the launch of CETS in pilot provinces by two periods. For the CETS pilot provinces, the effect of the CETS in pilot provinces lagging by one period is weaker than the effect in baseline results (-0.098), and the significance level changes from 1% to 10%. The effect of the CETS in pilot provinces lagged by two periods is further weakened and loses its statistical significance; For the non-CETS pilot provinces of WEPT, the effects of the CETS in pilot provinces lagged by one period and two periods are not significant; while the effect of CETS in pilot provinces for primary provinces of WEPT is similar to the result of CETS pilot provinces, the impact weakens with the increase of the lagging period, and the significance of the lagging period also loses its statistical significance. The above results may be a consequence of the incorrect incorporation of the correct policy year before the policy implementation year. Therefore, the benchmark results for the implementation time of CETS in pilot provinces are reliable.
Selecting a nonparametric permutation test procedure for the spatial placebo test. Bertrand et al. pointed out that when using panel data for the DID analysis, over-rejecting the null hypothesis in a regression test may occur if there is an issue with standard error bias due to serial correlation [69]. The (a), (b), and (c) in Fig. 6 shows the spatial placebo test results for the CETS pilot provinces, the non-CETS pilot provinces of WEPT, and the primary provinces of WEPT, respectively. The baseline results are placed in the low tail of the distribution of coefficients β for the nonparametric permutation test. The results of the spatial placebo tests indicate the accuracy of the baseline results.
Goodman-Bacon Decomposition
When using the time-varying DID model for policy effectiveness evaluation, if the difference between the post treatment group and the early treatment group or additional control group is determined as a component of the policy effect, the parameter estimation results of the DID term may have bias [70]. To mitigate possible deviations, Goodman-Bacon decomposition was performed. Due to the impact of CETS on all non-CETS pilot provinces of WEPT since 2013, we only conduct Goodman-Bacon decomposition for CETS pilot provinces and primary provinces of WEPT [71, 72].
From Table 5, we can see that in the weight decomposition of CETS pilot provinces and primary provinces of WEPT, the Later T VS Earlier C group accounts for the largest proportion, contributing over 90% to the average treatment effect; The weights of the Later T VS Earlier C group in the results are only 2.8% and 3.7%, which do not have a significant impact on the estimation results. Therefore, we believe that the estimation based on the time-varying DID model is reliable.
Addition Robustness Tests
In this section, several additional robustness tests are further conducted. The various robustness operations are as follows: (1) Exclude Beijing, Shanghai, and Guangdong. Among the CETS pilot provinces, these three provinces are China’s most economically influential areas, and they may have implemented additional stringent environmental protection policies in addition to the CETS in pilot provinces, and this might hinder the identification of policy effects.
(2) Exclude Fujian from the sample. Fujian launched its CETS at the end of 2016, which can be excluded to further examine the validity of the baseline results.
Table 5.
Goodman-Bacon decomposition.
| CETS pilot provinces | Primary provinces of WEPT | |||
|---|---|---|---|---|
| β | Total weight | β | Total weight | |
| Earlier T VS Later C | -0.205 | 0.025 | -0.227 | 0.031 |
| Later T VS Earlier C | 0.050 | 0.028 | -0.012 | 0.037 |
| Never treated VS timing | -0.176 | 0.947 | -0.192 | 0.932 |
Table 6.
Robustness tests (1).
Table 7.
Robustness tests (2).
Table 8.
Thermal power and hydropower utilization hours mechanism tests.
(3) Replace the explanatory variables measurement indicators. The logarithm of the “total CO2 intensity” is used as the explanatory variable to investigate the effect of the indicator’s sensitivity on baseline results. The “total CO2 intensity” can be expressed as the percentage of the thermal power plant’s CO2 emissions to the province’s total power generation (kgCO2/kWh).
(4) One period lags the control variables. To mitigate the endogeneity problem caused by potential two-way causality. (5) Excluding the interference of energy-use rights trading policy. The energy-use rights trading policy implemented at the same time as the CETS in pilot provinces can also have an impact on the power sector’s CO2 emissions, causing a skewed evaluation of the CETS’s influence on lowering the power sector’s CO2 emissions.
The first three robustness tests can be seen in Table 6. Columns (1)-(2) are the results of excluding the three most economically influential provinces, and columns (3), and (4) are the results of excluding Fujian. Beijing, Shanghai, Guangdong, and Fujian are not included in the non-CETS pilot provinces of WEPT, so excluding the above provinces will not affect the regression results of non-CETS pilot provinces of WEPT. Columns (4)-(6) show the results after replacing the explanatory variables measurement indicators. Most estimated coefficients β are substantially negative, so the benchmark results are reliable.
Columns (1)-(3) in Table 7 are the results of one period lagging the control variables. Other columns in Table 6 display the outcomes when excluding the pilot provinces of energy-use rights trading policy. Similarly, the core estimated coefficients β are all significantly negative, and the benchmark results remain stable.
Mechanism Tests
Based on the theoretical analysis above, the CETS reduces the power sector’s CO2 emissions by promoting the cleanliness of the power structure. The cleanliness of the power structure can be expressed by the thermal power and hydropower utilization hours [52].
In Table 8, the CETS’s influence on the thermal power utilization hours of the CETS pilot provinces, non-CETS pilot provinces of WEPT, and primary provinces of WEPT are depicted in columns (1)-(3), respectively. From the regression results, despite varying degrees of significance, the coefficients β are all significantly negative for the CETS pilot province, the non-CETS pilot provinces of WEPT, and the primary provinces of WEPT. The CETS declined the power sector’s thermal power utilization hours not only in CETS pilot provinces but also in non-CETS pilot provinces of WEPT. While in the primary provinces of WEPT, the decreasing effect is also valid.
The effect of the CETS on the hydropower utilization hours of the CETS pilot provinces, non-CETS pilot provinces of WEPT, and primary provinces of WEPT are depicted in columns (4)-(6). The coefficients β for the CETS pilot provinces and the primary provinces of WEPT are both positive at the significance degree of 1%; While the coefficient β for the non-CETS pilot provinces of WEPT is positive but fails the significance. Although the CETS generally increases the number of hydropower utilization hours in the primary provinces of WEPT, this effect is limited to the CETS pilot provinces.
Overall, the CETS can promote the cleanliness of the power structure in the power system, Hypothesis 3 is verified. Specifically, The CETS can promote the cleanliness of the power structure in CETS pilot provinces, as well as valid in the primary provinces of WEPT. However, the impact of the CETS on hydropower utilization hours of the non-CETS pilot provinces of WEPT is not significant, indicating that the non-CETS pilot provinces of WEPT have more capacity to increase hydropower utilization hours to meet power demand and further achieve greater CO2 emission reduction. The possible reason is that by renovating existing thermal power generation equipment, the power sector can achieve CO2 emission reduction at lower costs, and obtain greater benefits from the CETS. For the construction of hydropower equipment, more costs need to be invested. The CETS has promoted the construction of hydropower equipment in the power sector of CETS pilot provinces, but currently there is no effective pressure or guidance for the hydropower construction of the power sector in non-CETS pilot provinces of WEPT.
Table 9.
Heterogeneity analysis (1).
Table 10.
Heterogeneity analysis (2).
Heterogeneity Analysis
Based on China’s WEPT and the power sector’s characteristics, we study the heterogeneous effects of the CETS on the power sector’s CO2 emission reduction of the three channels of WEPT, as well as the electricity net inflow and net outflow. Additionally, we also discuss the CETS’s influence on the power sector’s CO2 emissions under different CO2 emission rights transaction volumes and environmental regulatory intensity.
Heterogeneity Analysis of the Three Channels of WEPT
The WEPT realizes the cross-province electricity transmission through the construction of three major channels in the northern, middle, and southern. From Table 9, Columns (1)-(3) represent the CETS’s influence on lowering the power sector’s CO2 emissions in the northern, central, and southern channels of WEPT. From Table 8, in the southern and central channels, the CO2 emission reduction impact of CETS is significantly negative. The northern channel is not significant but negative. The electricity inflow provinces of Tianjin and Beijing in the northern channel are limited by energy resources and are typical energy-consuming provinces, with high demand and dependence on cross-provincial power transmission and limited local power generation, consequently, the CETS had no significant impact on reducing power sector’s CO2 emissions; The electricity outflow provinces of Shanxi and Inner Mongolia in the northern channel mainly focused on thermal power generation, as they are coal-rich areas. Under the influence of the CETS, Shanxi and Inner Mongolia would reduce thermal power supply. However, to meet the electricity demand of the northern channel, coupled with the fact that the construction and grid connection of clean power sources need a longer period. In the short run, thermal power generation is still dominant, so the CETS’s impact on lowering the power sector’s CO2 emissions in the northern Channel during the sample period is insignificant. The conditions for decreasing the power sector’s CO2 emissions are better in the central and southern channels than in the northern channel. On the one hand, Guangdong and Fujian provinces developed nuclear power earlier than Beijing, thereby decreasing CO2 emissions by increasing the proportion of nuclear power. On the other hand, Yunnan, Guizhou, and Hubei, in contrast to Shanxi and Inner Mongolia, have abundant hydropower and wind power resources, allowing them to meet electricity demand while reducing CO2 emissions from thermal power.
Heterogeneity Analysis Between Net Electricity Inflow and Outflow Provinces
In Table 9, Columns (4), and (5) show the CETS’s impact on declining the power sector’s CO2 emissions in electricity net inflow and outflow provinces of WEPT, respectively. From Columns (4), and (5), We can conclude that there is no obvious variation between the electricity net inflow and outflow provinces of WEPT, which are all substantially negative, demonstrating the reliability of the benchmark results from the standpoint of power supply and demand. In addition, column (6) indicates the power sector’s CO2 emissions reduction effects of CETS in the CETS pilot electricity net outflow provinces of WEPT is negative but not significant. As developed provinces for exporting electricity, Fujian, and Hubei may be under greater environmental pressure, and early implementation of thermal power technology upgrading and clean energy development, resulting in the CETS not forming an effective pressure to decrease the power sector’s CO2 emissions. while CCER does not include the hydropower projects, further weakening the enthusiasm for decreasing CO2 emissions in the CETS pilot electricity net outflow provinces of WEPT.
Heterogeneity Analysis Between Different CETS Activities and Environmental Regulatory Intensities
CETS induces the power sector to reduce CO2 emissions through the marketplace in CETS. Whether the CETS is active or not will have a different impact on the power sector’s CO2 emission reduction. We use the average daily transaction volume of the CETS in each pilot province during the sample period as a proxy for CETS activity and categorize the sample into high CETS activity and low CETS activity through the median. The provinces with high CETS activity are Guangdong, Hubei, Chongqing, and Fujian. The provinces with low CETS activity are Shanghai, Beijing, and Tianjin. Columns (1) and (2) of Table 10 show the impact of CETS on the power sector’s CO2 emissions under different CETS activities. In provinces with high CETS activity, CETS can significantly promote CO2 emission reduction in the power sector, while in provinces with low CETS activity, CETS does not have a significant effect in promoting the reduction of the power sector’s CO2 emissions. This indicates that the increase in CETS activity is conducive to promoting the CETS to reduce the power sector’s CO2 emissions.
In addition, under different environmental regulatory intensities, CETS may show different effects on CO2 emission reduction in the power sector. By collecting the number of administrative penalties for environmental protection cases from 2009-2019 in the Database of national laws and regulations in each pilot province, the pilot provinces were categorized into two groups of high and low environmental regulatory intensity by median. The high environmental regulatory intensity provinces include Fujian, Guangdong, Beijing, and Tianjin; The low environmental regulatory intensity provinces include Shanghai, Chongqing, and Hubei. Columns (3) and (4) of Table 10 show the CETS’s impact on the power sector’s CO2 emissions under different environmental regulatory intensities. Whether in high or low environmental regulation regulatory intensity provinces, CETS can significantly promote CO2 emission reduction in the power sector. However, compared with low environmental regulatory intensity regions, high environmental regulatory intensity regions can more effectively promote the CETS to reduce CO2 emissions in the power sector. It shows that the government’s environmental regulatory policy can promote the CETS to reduce the power sector’s carbon emissions, and the higher the environmental regulatory intensity, the better the effect.
Conclusions
Reducing the Chinese power sector’s CO2 emissions via CETS is critical to achieving the environmental goals of the world and China. From a viewpoint of the power system, a time-varying DID model was utilized to determine whether the CETS reduced the power sector’s CO2 emissions of the CETS pilot provinces, the non-CETS pilot provinces of WEPT, and the primary provinces of WEPT, respectively. Then, the mechanism and heterogeneity were discussed. Key findings:
(1) The CETS reduces the power sector’s CO2 emissions in CETS pilot provinces, the CETS in pilot provinces has formed a spillover effect on lowering the power sector’s CO2 emissions in the non-CETS pilot provinces of WEPT, and the CETS lower the power sector’s CO2 emissions in the primary provinces of WEPT overall. So, the CETS has achieved the power system’s CO2 emission reduction. (2) The CETS can accomplish the power sector’s CO2 emission reduction by influencing the cleanliness of the power structure, but in the non-CETS pilot provinces of WEPT, the reduction effect is mainly achieved by reducing thermal power utilization hours rather than hydropower utilization hours. Hence, the CO2 emission reduction potential of renewable energy remains to be explored. (3) In the three major channels of the WEPT, the power sector’s CO2 emission reduction effect is ranked from high to low: the southern channel, the central channel, and the northern channel; the power sector in the primary provinces of WEPT can achieve CO2 emission reduction in both the net inflow and net outflow provinces. However, the impact on the CETS pilot electricity net outflow provinces of WEPT is negligible. With high CETS activity and environmental regulation intensity, the CETS can effectively reduce the power sector’s CO2 emissions.
Combined with research results, we propose three recommendations: (1) Opening up the CCER market. By releasing the CCER market, enterprises in the power sector can obtain free CO2 emission rights by constructing clean power projects such as hydropower and trade CO2 emission rights at a profit on CETS, which in turn can accelerate the cleaner transformation of the power structure and further reduce CO2 emissions from the power sector. (2) Expand the CETS and enhance CETS activity. Both the CETS in pilot provinces and the national CETS need to include more companies and sectors. By incorporating more companies and industries, the CETS can be made more active, which in turn will reduce CO2 emissions across the country, including the power sector. In addition, the government can also increase CETS activity by providing financial subsidies or tax incentives to companies that participate in the CETS. (3) Expansion of the WEPT. The establishment of the CETS has provided opportunities for the power sector in the electricity net outflow provinces of WEPT, driven by the benefits of the CETS, the power sector in the electricity net outflow provinces of WEPT tends to develop clean power and use ultra-high voltage transmission technology to expand the capacity of the WEPT, ultimately reducing CO2 emissions from the national power sector. (4) Explore appropriate environmental regulatory policies. The level of environmental regulation intensity will affect the CETS effect, the government needs to explore appropriate environmental regulation policies to promote the healthy development of the CETS, the formation of CETS and other environmental regulation policies to jointly promote the benign development of CO2 emission reduction in the power sector and other sectors.

