

Introduction
As the most populous developing country in the world, China is undergoing a historic moment, transforming from high-speed development to high-quality development. Though facing the pressure of an economic slowdown, China actively participates in governance to deal with the serious global issue of climate warming and proposes the goal of achieving the carbon peak by 2030 and carbon neutrality by 2060. Since the majority of China’s traditional industries supporting economic growth have high energy consumption, strict environmental regulations are necessary to solve the market failure caused by irresponsible polluting behaviors. As claimed by numerous researchers, the optimal path for traditional industries to overcome the financial difficulties under regulatory pressure is green innovation, which can offset part or all of the compliance costs and help to achieve a win-win situation of environmental protection and profitability. However, it is impractical to assume that traditional industries can focus on R&D while struggling to survive. The thriving environmental industries are crucial in providing the material basis and technical supports for pollution treatment, ecological improvement, and intensive use of resources [1]. China’s environmental industries have been growing at an astonishing speed in recent years. According to data released by the Ministry of Ecology and Environment, from 2015 to 2022, the total operating revenue of the environmental industries increased from 960 billion yuan to 222 million yuan, with an average annual growth rate of 12% [2, 3].
Compared with the extensive studies about whether traditional industries are dedicated to innovating under enhanced environmental regulations, it is surprising to find that only a handful of studies are about the behaviors of environmental industries [4, 5] and their symbiotic relationship with traditional industries [6, 7]. Inferring from existing literature, a strong regulatory environment is beneficial for environmental enterprises to innovate since they achieve profitability through selling specialized products and services that comply with the regulations, but they also suffer from the quick upgrading of technologies and the decline of the customs’ industries. Tons of theoretical and empirical work is still needed to learn about the related driving forces and outcomes since the conclusions are inconsistent based on various research objects. As is known, law construction is the most fundamental and effective kind of environmental regulation since all parties involved must assume responsibility [8]. In 2015, the New Environmental Protection Law (NEPL) was officially released, which is regarded as a sign of the government starting to strengthen environmental regulations since the first version of the Environmental Protection Law was introduced 25 years ago in 1989 and mainly served the industrialization demand in China back then. So, this article attempts to fill part of the research gap by testifying whether environmental regulation stimulates green innovation in environmental enterprises in China by using this landmark event to construct a quasi-natural experiment. And our analysis goes deeper by exploring how internal R&D decisions and external government green subsidies affect the impact of the law. Given that lots of environmental enterprises in China rely on technology imports to do their business, investing in R&D is an essential but risky way to escape from homogeneity competition, and small firms often remain cautious about doing so [9, 10]. Meanwhile, a large number of green subsidies are designed by the Chinese government to support low-carbon development, but it is worth discussing if receiving green subsidies makes firms favored by the government get slack at innovation since they can survive without obvious technological improvement. Internal R&D decisions and external government subsidies are taken as moderating variables in our analysis.
The marginal contributions to this article are as follows: Firstly, this article, for the first time, adopts major changes in legislation to analyze the influence of environmental regulations on innovations in environmental enterprises. Our work not only supplements the small amount of existing literature regarding environmental enterprises’ innovation reactions under regulatory pressure, but also provides references for the subsequent formulation of relevant systems. Secondly, so far, no international consensus has been achieved about which specific sub-sectors are included in the environmental industry since it is constantly enriching. Based on research and the environmental stock indexes set by fund companies in China, this article conducts a detailed screening and ultimately identifies 13 sub-sectors, which is of great importance to expand the micro database for studies related to the environmental industry. Thirdly, this article creatively selects the moderating variables based on the internal and external resources held by environmental enterprises in China. Related findings are inspiring for detecting the channels through which more targeted policies can be formed to motivate innovations in environmental enterprises.
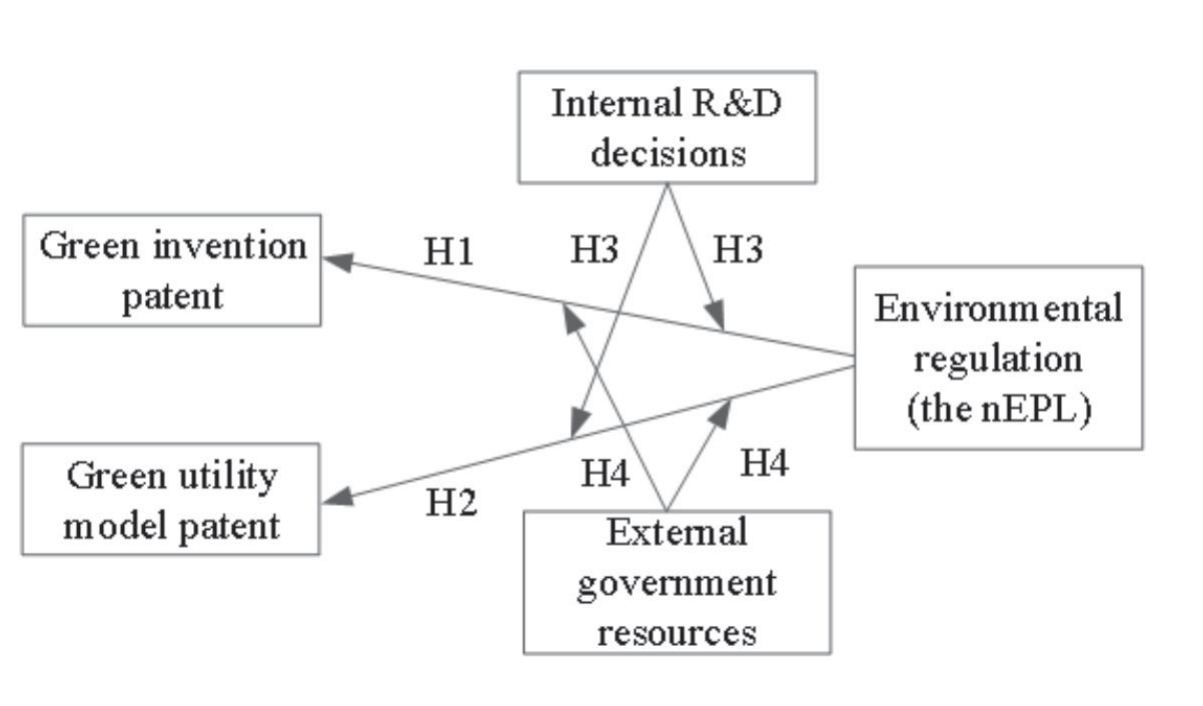
The remainder of this article proceeds as follows: The second part provides a detailed literature review and hypotheses (see Fig.1). The third and fourth parts provide the research design and empirical results. The fifth part presents further study based on moderating and heterogeneous analysis. The sixth part summarizes conclusions and limitations.
Literature Review and Hypothesis
Environmental Regulation and Green Innovation
Research on the relationship between environmental regulation and green innovation can be traced back to the 1980s. It is argued that concise regulation design provides support and guidance for green innovations [9]. Then the Porter Hypothesis is proposed, indicating that environmental regulations have not only a negative impact on firms’ performance because of increased compliance costs but also a positive impact on motivating firms to innovate and introduce efficient frameworks [10]. The weak version of it explains the promoting effect of environmental regulations on innovation [11]. In its stronger form, “innovation compensation” can offset the increase in pollution control costs, enabling polluting enterprises to achieve profitability [12]. Porter’s viewpoint is questioned by neoclassical environmental economists for the misleading information provided to authorities that environmental regulations are essentially costless [13, 14]. Besides compliance costs, the administrative burden that comes with regulations cannot be ignored [15]. Subsequently, scholars who are interested in the Porter Hypothesis have supplemented it from both theoretical and empirical perspectives, most of which confirm the positive or U-shaped impact on innovations [16-18]. The flexibility of environmental regulations is emphasized. Environmental regulations such as natural resource rent, environmental policies, and environmental taxes can be divided into three categories: command-and-control, market-based, and voluntary. Under command-and-control regulations, enterprises must adopt specific technologies, which results in limited space for innovation. The other two kinds generally only ask for pollution reduction without requiring how to do so, maximizing the flexibility for enterprises to innovate according to their own advantages [19-21]. Meanwhile, crucial influencing factors are concluded. Shareholder involvement, a mature institutional system, internationalization, and stringent enforcement of local authorities all contribute to the realization of the Porter hypothesis [8, 22, 23], but the existence of pollution havens abroad provides enterprises with a third way of survival besides paying for increased costs and exploring technological innovations [24].
Porter’s hypothesis and related theories are important because most of the impact of environmental regulations is passed down from polluting enterprises to environmental enterprises [7]. The environmental industries are generally divided into two sub-sectors: resource management and pollution control. The former one focuses on the improvement of resource utilization efficiency and producing alternative products, while the latter one focuses on end-of-pipe pollutant control services and equipment [1, 25]. For the resource management sub-sector, accompanied by restrictions on products that harm the environment, consumption of environmentally friendly alternatives is simulated. At the same time, the importance of nature resource intensification and standardization management is released by the state and the public, giving rise to related green projects. Environmental enterprises are generally a light asset; thus, reforming existing technologies and developing new production lines can help enterprises establish a foothold quickly in the market. In the pollution control sub-sector, driven by regulatory pressure, consumption of efficient technologies increases, providing the motivation and resources to innovate in environmental enterprises. However, it is noteworthy that old technologies are phased out during this process since the application scenarios for them are narrowing, which leads to the situation that some environmental enterprises with weak technical capabilities fall into intense homogeneous competition.
In this paper, since we take the implementation of the NEPL as a quasi-natural experiment to testify whether the beneficial effect of green innovations exists in China’s environmental enterprises compared to the original version, the main improvements of the NEPL are summarized as follows: Firstly, the NEPL has increased the punishment for illegal polluting enterprises and local governments, adding a daily cumulative fine system and introducing the punishment of administrative detention. Secondly, the NEPL stipulates the legal responsibility of environmental enterprises, which means institutions engaged in environmental impact assessment and environmental monitoring, maintenance, and operation of environmental equipment and facilities shall bear joint and several liability with other responsible parties for environmental pollution and ecological damage if they engage in united fraud. Thirdly, the NEPL provides mandatory information disclosure and public supervision. It requires important pollution discharge enterprises to truthfully disclose the construction and operation of pollution prevention and control facilities. Inferring from these improvements, efficient technologies strictly in compliance with environmental standards are needed. Also, the information about applied environmental protection facilities helps market entities forecast the prospects and possible profit of related technologies, thereby supplying more financial support [26]. Thus, we assume the NEPL promoted green innovations in environmental enterprises. – Hypothesis 1: The implementation of the NEPL can
promote green innovation.
Substantive and Symbolic Innovation
Green innovations refer to innovations dealing with environmental problems and can be applied in products, processes, and management [27, 28]. Environmental innovations can not only reduce pollution emissions but also upgrade technological capital quality in the long term [29]. However, not all innovations are invented for substantive uses; some of them are just symbolic actions to gain reputations or cope with institutional/legal pressures [30-32]. Innovations invented for promoting technological development and obtaining competitive advantages are defined as substantive innovation, and innovations applied only for the purpose of seeking other benefits are defined as strategic or symbolic innovations, which can be carried out quickly in large quantities [33]. Based on the applications of innovation outputs, scholars often take invention patents as high-quality substantive innovations, while utility model patents and design patents are low-quality symbolic innovations [34, 35]. According to the green patent innovation data released by the China Research Data Service (CNRDS), green patents are classified into green invention patents and green utility model patents. Currently, most scholars also use the former one as a proxy variable for substantive innovations, and the latter one as a proxy variable for symbolic innovations [33, 36].
Although China’s environmental industries are developing quickly, there is a lack of original theories and technologies. Only the technologies of air pollution control are running parallel to the international level, while the technologies of water pollution control, soil pollution control, and environmental monitoring equipment are in a state of keeping up with the international levels [37, 38]. Overall, the independent R&D abilities of the firms are still weak. Meanwhile, the supporting duration of China’s industrial policies is relatively short, and financial support is provided afterwards. Considering the long cycle, large upfront investments, and uncertainty of major substantive green innovations [39], lots of environmental enterprises lack the motivation to do so.
A symbolic greening strategy is adopted by plenty of firms, assuming it can bring significant benefits at a low cost [40], which probably also happens after the implementation of the NEPL. Specifically, the NEPL stipulates environmental performance as an important part of the assessment of local government officials and explicitly constructs support for technological research. Besides traditional ways, including subsidies and preferential taxation, government procurement is also mentioned, which means products, equipment, and facilities labeled environment-friendly are prioritized by government agencies and other organizations using fiscal funds. Considering that the average tenure of local officials is currently 3-4 years, local officials have the motivation to encourage environmental enterprises within their jurisdiction to increase their innovations in the short term, enabling them to obtain political achievements and reputations [41]. Therefore, the implementation of the NEPL may lead some environmental enterprises to focus on symbolic innovations that are quicker and easier to apply (applications of green utility model patents) rather than substantive innovations (applications of green invention patent innovation) in order to gain the benefits above. – Hypothesis 2: The promoting effect of the NEPL on
applications of green invention patents is lower than
that on applications of green utility model patents.
Internal Decisions and External Resources
Facing severe uncertainties from environmental regulations, firms tend to figure out their competencies and resources first to deal with the problems. Based on the dynamic capabilities view (DCV), the competitive advantages lie in the firm’s developing processes, shaped by its asset position and evolution path [42]. Considering the current development status and trends of China’s environmental enterprises, the differences in competencies and resources can be inferred from the R&D investments and government green subsidies of the firms.
Enterprises with high R&D investments have been keeping their footing in the market based on technological capabilities for a long time, forming stable cooperative relationships with related centers or universities. Besides market pull and regulatory push, intra-organizational and managerial factors are also determinants of triggering environmental innovations [43]. The internal R&D experiences of the firms and external knowledge acquisition from research centers and universities are complementary and bring out high-quality innovations. However, for some small and medium-sized environmental enterprises, they have limited patents and depend on imported high-tech equipment for a long time, so increasing R&D investments cannot be produced quickly. In addition, these enterprises are more vulnerable to increased financial costs [15], and the dual externalities of environmental innovations are unacceptable for them, which means R&D spillovers and reducing negative environmental influences for other firms without compensation [44]. Taking these into consideration, small and medium-sized enterprises tend to hold a cautious attitude towards changing their internal R&D strategies and still anchor the original goal of homogeneous competition.
Normally, environmental subsidies are crucial for eco-innovation activities, especially in less affluent countries [45]. Existing studies have verified the positive impacts of government R&D subsidies on environmental innovations in China [46, 47], but R&D subsidies are only part of environmental subsidies [48]. Sometimes excess environmental subsidies have a negative effect on innovation activities in listed firms because the allocations of these subsidies are not market-oriented, which means immature market mechanisms and rent-reeking are involved, and the ownership of the firms are the main reasons to gain subsidies [49, 50]. In China’s case, some provincial-level environmental groups have become a new rising type of market entity trading through regional platforms, and they actively cooperate with the local government [2]. In addition, according to the “Provisions on Strengthening the Management of Environmental Protection Subsidies” issued by the Environmental Protection Agency and the Ministry of Finance, the subsidies for environmental protection should be used for the control of key pollution and comprehensive environmental governance and cannot be diverted for other purposes. Therefore, innovations funded by the subsidies are often byproducts of environmental governance, the number and quality of which are not required by the government. Benefiting from constant projects with environmental subsidies, these enterprises achieve stable profits and have no motivation to wait for a long period to get uncertain returns from R&D. Thus, we assume that constant government green subsidies, obtained by environmental enterprises can also be taken as moderating variables, which, contrary to internal R&D investments, crowd out the promoting effect of green innovations from the NEPL. – Hypothesis 3: High R&D investments by enterprises
accelerate the promotion of green innovations under
the NEPL. – Hypothesis 4: The government green subsidies
obtained by enterprises crowd out the promoting
effect on green innovations under the NEPL.
Experimental Procedures
Sample Processing and Data Sources
This article takes A-share listed companies in environmental industries from 2012 to 2021 as research samples and uses the implementation of the NEPL as a quasi-natural experiment to explore the impact of it on green innovations in environmental enterprises. The data sources mainly include the following parts:
(1) The green patent data is taken from the China Research Data Service (CNRDS) database. Green patents are divided into green invention patents and green utility model patents based on the applied range. An invention patent refers to a new technology proposed for a product or method, while a utility model patent refers to one proposed for the shape, structure, or recombination of a product to improve its practicability. The former ones are generally considered to have more R&D difficulty and potential value.
(2) Financial data for A-share listed companies comes from the Wind Database.
(3) Referring to the previous study [51], the data on government green subsidies comes from the details of government aid projects publicly disclosed by listed companies, extracting those with labels related to energy conservation and environmental protection.
(4) For the definition of environmental enterprises, this article refers to the studies of Wen, Shi, and Guo [52], and the settings of environmental industry indices by major fund companies, then selects low-carbon and energy-saving, sewage treatment, new energy vehicles, exhaust gas treatment, hydrogen energy, charging stations, wind power generation, garbage classification, photovoltaic, garbage power generation, new energy, beautiful China construction, and carbon neutrality. These enterprises serve as representatives of energy-saving and environmental protection enterprises.
(5) This article processed the data of listed enterprises as follows: financial, ST, and PT listed enterprises are excluded, and samples missing main variables are eliminated. By matching and merging the above data, 419 environmental enterprises (the treatment group) and 3567 other enterprises (the control group) are ultimately obtained. In order to eliminate the influence of extreme values, the main continuous variables are subjected to tail reduction at the 1% level. Technically, to improve accuracy, the propensity score matching (PSM) method is suitable to reduce the group differences. The matching method is based on Wang, Liu, and Zhao [53], using the control variables as covariates and performing a 1:4 annual nearest neighbor matching with the replacement method.
Model Setting and Variable Definitions
On April 24, 2014, the 8th meeting of the NPC (National People’s Congress) Standing Committee approved the “Amendment to the Environmental Protection Law”, which was officially implemented on January 1, 2015. At this point, the fundamental law in the field of environmental protection has completed its first revision in 25 years. This article takes the implementation of the New Environmental Protection Law (NEPL) in 2015 as an exogenous event and uses a difference in difference with propensity score matching model [54] to examine the impact of the NEPL on the green innovations of environmental enterprises. The model design is as follows:
Where Patit denotes green innovation, using the number of green patents applications as proxy variables. Among them, Gpatit denotes the total number of green patents applications by enterprise i in year t. Gipatit and Gupatit denotes the number of green invention patent applications and the number of green utility model patent applications respectively. These two are weighted differently to generate the variable GWpatit, which represents the overall green innovation performance of the enterprises. Due to the fact that green invention patents are generally considered with more R&D difficulty and potential value, a weight of 2 is set for the corresponding applications, and the weight of 1 is set for the green utility model patent applications. Treatit denotes the grouping dummy variable, with the value of environmental enterprises (treatment group) being 1 and the other enterprises (control group) being 0. Postit denotes the time dummy variable, and after the NEPL is implemented its value is 1, otherwise its value is 0. Treatit × Postit (DIDit) denotes the policy dummy variable; Controlit denotes the set of industry-level control variables; εit denotes the random disturbance term; λi, λt, λh, λp denotes fixed effects of individual companies, time, industries, and provinces respectively. In baseline regression, the result of coefficient β1 is what we are most concerned with, which reflects the impact of the implementation of NEPL on the green innovation of environmental enterprises. Significantly positive results indicate that the implementation of NEPL helps environmental enterprises improve green innovations. The definitions of the main variables and regarding measurement methods are shown in Table 1.
Results and Discussion
Baseline Results
Table 2 reports the regression results of model (1), and the results show a significant positive correlation between the implementation of the NEPL and green patent applications, indicating that environmental regulations can promote green innovations in environmental enterprises. The regression results of the total green patent applications (Gpat) and weighted total green patent applications (GWpat) are reported in columns (1) and (2), with the coefficients of the policy dummy variable being 0.208 and 0.198, respectively, and significant at the level of 1%. The regression results of green invention patent applications (Gipat) and green utility model patent applications (Gupat) are reported in columns (3) and (4), with the coefficients of the policy dummy variable being 0.188 and 0.217, respectively, and also significant at the level of 1%. Hypothesis 1 is verified, and the difference in coefficients indicates a greater promoting effect on green utility model patent applications than green invention patent applications, which means hypothesis 2 is verified. The following reasons may have caused the differences: firstly, due to the difficulty and long research cycles of green invention patents, it is difficult to achieve a large number of high-quality innovations in a short time; secondly, after the implementation of the NEPL, the demands for detection and treatment are more complicated, and environmental enterprises have innovated based on existing technologies to broaden application scenarios; thirdly, some environmental enterprises are inclined to apply for symbolic patents with little difficulty to gain other benefits.
Table 1.
Definitions and regarding measurement of the main variables.
Parallel Trend Test and Uuniqueness of Policy Time Point Test
One of the prerequisites for using the DID model is the parallel trend assumption. In this case, it means that the green patent applications of the treatment group and the control group exhibit parallel trends before the policy is officially implemented. This article conducted two tests:
(1) Set time dummy variables for years before and after the year 2015, then multiply them with the grouping dummy variables, respectively, to form fictitious policy dummy variables. As shown in Table 3, most of the coefficients before or after the actual implementation year of the NEPL are negative or not significant, indicating approximate compliance with parallel trends. The only exception is in the analysis of green utility model patent applications (Gupat) in column (4), where the Treat x Post2014 coefficient of is 0.127 and significant at 5%. Probably because the release of the NEPL is in April 2014, some environmental enterprises have slightly modified their R&D strategies before the policy is officially implemented.
Table 2.
Influence of the nEPL on green innovations of environmental enterprises.
(2) Retain the samples before 2015, the implementation year of the NEPL, and make DID estimation using the fictitious policy dummy variables one year and two years before 2015. As shown in Table 4, the regression results of all fictitious policy dummy variables are not statistically significant, indicating it is reasonable to use 2015 as the policy time point.
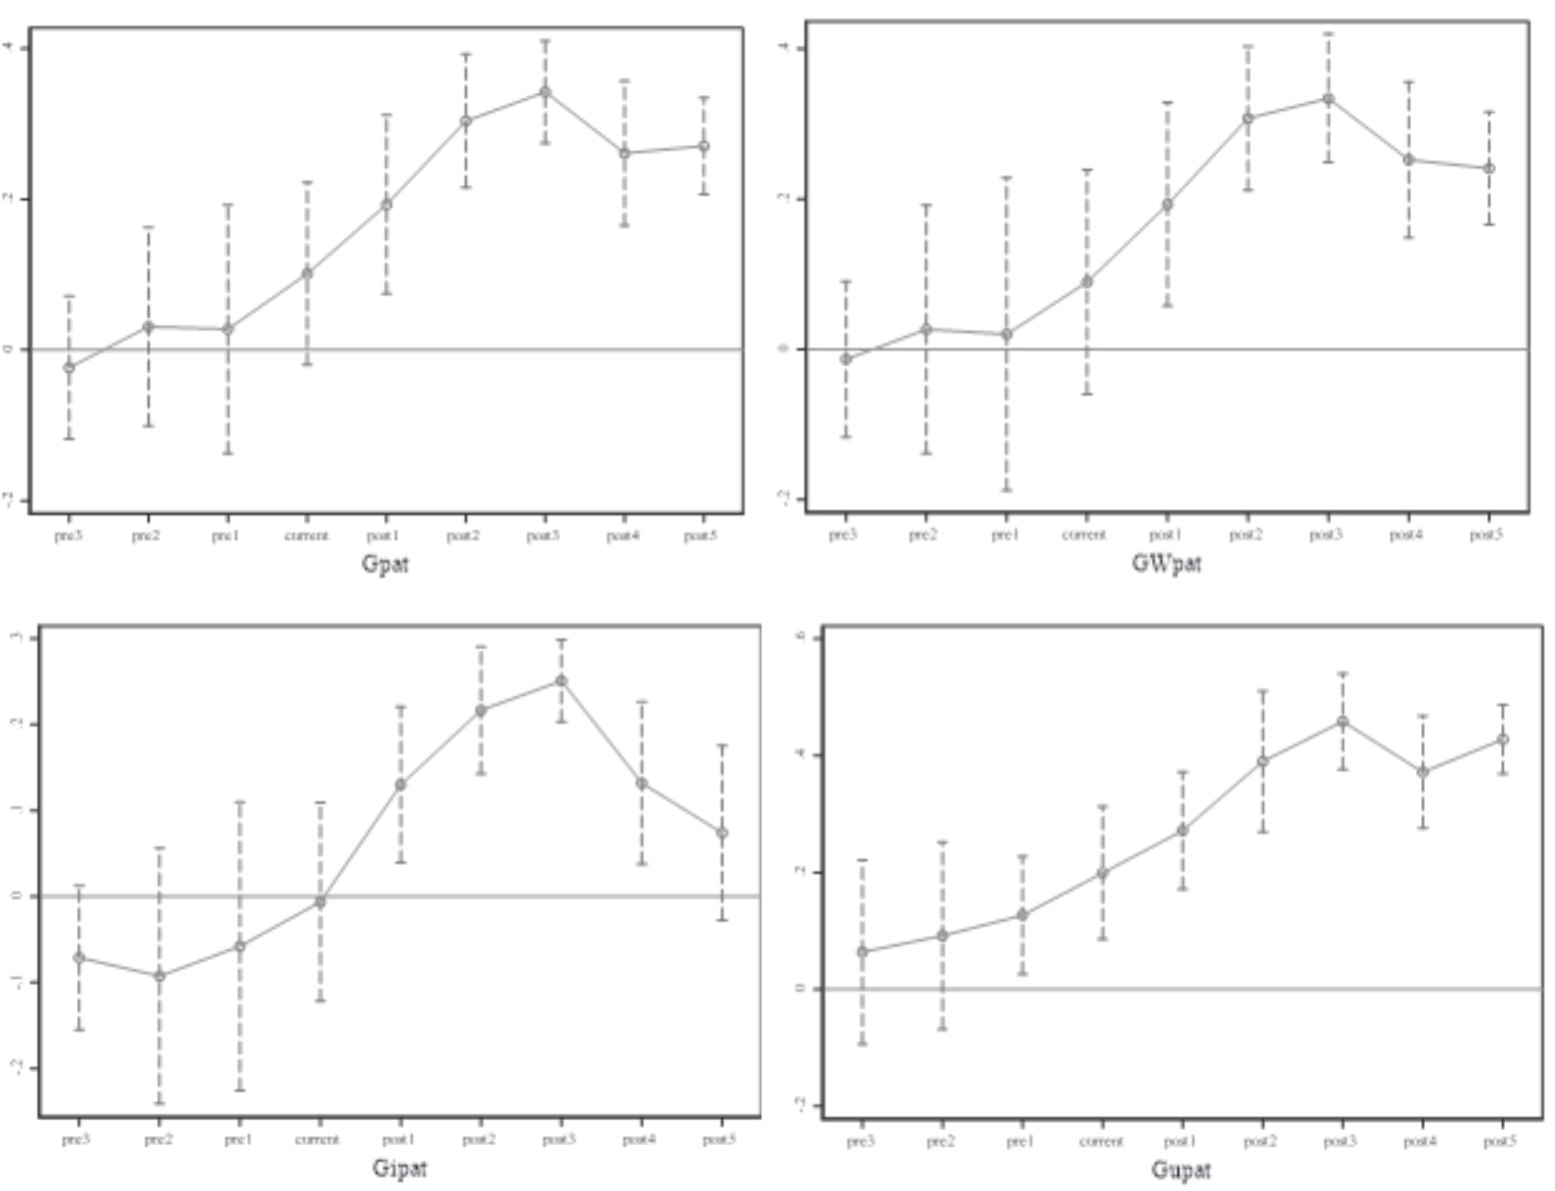
The dynamic policy effects are also shown in Fig. 2. It can be seen that before the implementation of the NEPL, the coefficient of the policy dummy variables was not significantly different from 0. In 2015, the year that the NEPL is formally implemented, there is an obvious upward trend, while for the next three years, the upward trends are becoming increasingly evident and significantly positive, indicating that policy impact is continuously promoting green patent applications in environmental enterprises.
Robustness Test
To test the robustness of the baseline regression, the following tests were carried out:
(1) Placebo test. Still taking the implementation year of NEPL as the base year and setting the time dummy variable, then randomly selecting 419 enterprises from all samples as a random treatment group to estimate the virtual policy effect according to model (1).
After simulating the above process 500 times, it can be seen from the probability density distributions that the coefficients of the virtual policy dummy variables are distributed around 0. Since the coefficients using factual data are significantly positive, it indicates that there is no other unobservable factor contributing to the increasing number of green patent applications in environmental enterprises.
Table 3.
Parallel trend test.
Table 4.
Uniqueness of policy time point test.
(2) Reducing special samples. ① Excluding other policy impacts. In 2017, the country-selected provinces of Zhejiang, Jiangxi, Guangdong, Guizhou, and Xinjiang were selected as pilot areas to conduct green finance reform and innovation. Considering that the development of green finance will affect the financing conditions for environmental enterprises and thus promote green innovation activities, this paper excludes the impact of this policy by eliminating these samples from the above provinces after 2017. The regression results show that the coefficients all decrease slightly, and the regression results are still significant. ② Excluding heavily polluting enterprises. The implementation of the NEPL also has a significant impact on heavily polluting enterprises. Referring to the “Guidelines for Environmental Information Disclosure of Listed Companies” released by the Ministry of Environmental Protection in 2010, 14 industries, including steel, chemical industry, metallurgy, and others, are listed as heavily polluting ones. After excluding these industries, the regression results show that the coefficients increase slightly, but are still significant.
(3) Controlling industry trends and macroeconomic factors. In order to solve this problem, some literature has constructed empirical models with industry or macroeconomic variables at the province level as control variables. The drawback of this method is that it cannot fully consider factors at all levels, so this article constructs interactive fixed effects between industry and time trends, as well as interactive fixed effects between provinces and time trends, to refine the model. After controlling for industry trends and macroeconomic factors, the regression results show that the coefficients increase by varying degrees and are still significant.
Further Analysis
Moderating Analysis
The implementation of the NEPL has a varying promotion effect on green patents in environmental enterprises, influenced by both internal R&D strategies and external government resources. This article constructs the following model to examine the moderating effect using data on R&D investment and government green subsidies.
Where DIDit denotes the policy dummy variable; RDit denotes the R&D investment measured by the ratio of R&D investment to operating income of enterprise i in year t, indicating whether the enterprise takes promoting technology as their competitive edge; Greensubit denotes the government environmental subsidies. Referring to the study by Yu Zhimai [51], we manually extracted data on special subsidies and reward funds for environmental projects from detailed information on government subsidies disclosed by listed enterprises through keyword selection.
Table 6 reports the regression results of moderating effects, verifying hypothesis 3. The statistical results in Panel A indicate that R&D investments significantly promote applications of green patents. The statistical results in Panel B indicate that government green subsidies significantly reduce the application of green patents. Although government subsidies can alleviate the financing constraints for enterprises, focusing on meeting the requirements of the government crowds out attention and resources for green innovation. While considering the R&D difficulty and long cycle of green invention patents, when taking the green invention patent applications (Gipat) as the explained variable, the interaction terms between the moderating variable and the policy dummy variable are not statistically significant in columns (3) of Panel A and Panel B, indicating important substantive innovations are not influenced.
Table 5.
Robustness test.
Table 6.
Moderating analysis of R&D investment and government green subsidies.
Heterogeneity Analysis
Considering that the implementation of NEPL may have an asymmetric influence on green innovations in environmental enterprises, we discuss the possible heterogeneous effects as follows and the results are shown in Table 7.
(1) Differences in regional environmental governance. Though the NEPL is implemented nationwide, the intensity of regional environmental governance may have influenced its effectiveness. Referring to previous studies [55], we use the ratio of completed investments in industrial pollution control to the added value of the secondary industry in 2015 as a proxy variable (REG) for the intensity of environmental governance in various provinces and divide samples into two groups according to their location. We set a dummy variable that has a value of 1 if the enterprise’s REG is larger than the median REG; otherwise, its value is 0. The regression results in Panel A show that all coefficients are significant. Compared to other enterprises, enterprises in provinces with strong environmental governance have a greater promoting effect on green invention patent applications (Gipat) and a weaker promoting effect on green utility model patent applications (Gupat). The explanation is that after the implementation of the NEPL, provinces with strong environmental governance strictly follow regulation standards, so environmental enterprises located in these provinces attach greater importance to high-quality green innovations and engage less in symbolic innovations. Meanwhile, provinces with strong environmental governance are usually industry-developed areas with a rich reserve of talents and solid funds, which indicates that high-quality green innovations have sufficient resources to be carried out.
(2) Differences in asset scale. We differentiate sample enterprises by calculating the median enterprise’s asset for various industries every year. A dummy variable is set with a value of 1 if the enterprise’s asset is larger than the median; otherwise, its value is 0. The regression results in Panel B show that the implementation of the NEPL has no significant impact on the green invention patent applications (Gipat) of small enterprises, but a significant positive impact on the green utility model patent applications (Gupat) of small enterprises. The coefficients of large enterprises are significant and basically equal, much bigger than the Gupat coefficient of small enterprises. This is because small enterprises pay less attention to innovations, and the limited attention is mainly on green utility model patents with lower R&D difficulty and more practicality, some of which can also be seen as symbolic innovations to obtain other benefits.
Table 7.
Heterogeneity analysis.
(3) Differences in ownership. A dummy variable is set with the value being 1 if the enterprise is state-owned; otherwise, its value is 0. The regression results in Panel C show that, compared to non-state-owned enterprises, the implementation of the NEPL has a slightly stronger impact on green invention patent applications (Gipat) in state-owned enterprises, while having a weaker impact on green utility model patent applications (Gupat). It is because state-owned enterprises usually follow the guidance of national policy tightly and focus on developing major green invention patents to help narrow the technical gap between China and developed countries. Non-state-owned enterprises, on the other hand, adopt short-term profit maximization as their primary goal and tend to focus on green utility model patents, which can be applied and certified in the short term. Also, some of the green utility model patents can effectively assist in output expansion to meet diversified market demands.
Conclusions
This article constructs a quasi-natural experiment based on the implementation of the NEPL in 2015 and uses both the propensity score matching method and the difference in difference model (PSM-DID) to quantitatively evaluate the impact of the exogenous event on green innovations in environmental enterprises. Our findings are succinctly summarized as follows: Firstly, the implementation of the NEPL has promoted the applications of both green invention patents and green utility model patents in environmental enterprises, and the promoting effect on green utility model patents is stronger, indicting the existence of some symbolic behaviors. Secondly, for the next approximately three years after the implementation of the NEPL, the promotion impact increased year by year, which confirms the accumulated impact of the NEPL on innovations. Thirdly, based on the capabilities of every enterprise, internal high R&D investments accelerate the promoting effect on green innovations under the NEPL, while government green subsidies obtained by enterprises crowd out the promoting effect. Fourthly, by categorizing the samples based on the intensity of regional environmental governance, size, and ownership type of enterprises, empirical results show that the implementation of the NEPL has stronger impacts on the green innovations of state-owned enterprises, large enterprises, and enterprises in areas with strong environmental governance.
Our research mainly confirms that there is still room for strengthening environmental regulations to motivate innovations in environmental enterprises. Additional policy implications are as follows: Firstly, based on the technical capability differences of the firms, the government needs to provide appropriate guidance and reasonable support to strengthen innovations in small and medium-sized non-state-owned enterprises. These enterprises work on the expansion of low-end markets and hold a cautious attitude towards enhancing R&D investment since it’s difficult for them to collect sufficient resources and bear R&D risks. Therefore, the government needs to provide targeted technological funds and talent support to reduce or share some of the R&D uncertainty. In addition, the improvement of innovation quality in these enterprises is noteworthy. Heterogeneity analysis shows that major innovations rarely occur in small or medium-sized enterprises and that strong environmental governance helps enhance innovation quality. Thus, it is also necessary to monitor the use of the provided resources in the supporting process.
Secondly, in response to the symbolic innovation behaviors of some enterprises under environmental regulations, the evaluation system for green patents should be refined. The research results show that the implementation of the NEPL has a smaller promoting effect on green invention patent applications than on green utility model patent applications. The latter is, to some extent, symbolic behavior taken by enterprises to gain market attention and government support. These by-product innovations usually cannot be converted into actual output. At present, it’s hard to find a detailed and standardized evaluation of the difficulty, depth, and potential value of green patents from public channels. Also, few enterprises are willing to disclose unbiased evaluations of their own technologies. A systematic and unified evaluation system should be established to provide a basis for government tax incentives and other supporting policies. The system can also help to enhance the information transparency of green innovations in the market and provide a better financing environment for related projects.
Thirdly, considering the crowding-out effect on innovations due to the casual distribution of government subsidies, the transparency of subsidy distribution and related green project bidding procedures should be strengthened, which is also convenient for public supervision. And before every formal implementation, the social networks and fund flows between leaders and their relatives in government departments and environmental enterprises are supposed to go through a penetrating investigation. A comprehensive evaluation mechanism established according to market rules is also indispensable, in which requirements for technological capabilities and progress in recent years should be contained. In this way, the effectiveness of government green subsidies can be improved, and stable cooperation between the government and enterprise, if any, can be built up based on benign market competition.
The limitations of this study and future research directions are as follows: (1) This study takes the applications of green patents as proxy variables for green innovation and estimates the innovation quality based on the patent type. The patent sale price can more accurately reflect the innovation quality. However, the available data currently only includes the total sales amount of patents in each enterprise every year, and the proportion of green patents is unknown. Therefore, we are looking forward to extending the study if related data is updated. (2) We adopt China’s first environmental legislation in 25 years to establish the quasi-natural experiment. Though fully illustrating the impacts over the past few years, this study is short on a comparative analysis of various environmental laws. However, considering the large time span since the original version of the Environmental Protection Law was released, it is unrealistic to do so now based on China’s cases. In future studies, we will pay attention to the major legislative events affecting environmental enterprises abroad and the policy reforms interacting with the NEPL.

