

Introduction
Globally, the intensification of human activities and the impacts of climate change are triggering profound changes in ecosystems [1, 2]. These changes pose unprecedented challenges to the health and stability of ecosystems, potentially threaten biodiversity, and can lead to ecological degradation and economic loss [3-5]. As a core measure of ecosystem productivity [6], the net primary productivity (NPP) of vegetation is essential for assessing the Earth's biological carrying capacity and is a cornerstone for understanding the global carbon cycle and ecosystem health [7, 8]. Currently, NPP is widely used to estimate the Earth's carrying capacity and evaluate the sustainable development of terrestrial ecosystems [9, 10].
Research on NPP is a popular topic, and academic research on NPP has become more detailed [11, 12]. Researchers have used a variety of methods to analyze the spatial and temporal distribution patterns [13] and evolutionary mechanisms of NPP [8] in detail and to explore the factors driving NPP changes [11]. These studies not only involve the innovation and optimization of NPP estimation methods but also include the quantitative analysis of their influential factors, with the aim of more accurately understanding and predicting the dynamic changes in NPP [4]. Among the many research results, the identification and analysis of the driving factors are particularly crucial [14, 15].
Shi et al. [4] analyzed the drivers of NPP in mainland China from 2000 to 2020 and reported that land use and precipitation were the main factors contributing to changes in NPP, whereas elevation and temperature were the dominant factors in southwestern China; Yang et al [16]. found that the correlation between vegetation NPP and temperature was greater in Anhui Province, China. Zhao and Liu's study [17] revealed that in arid and semiarid regions, precipitation plays a decisive role in NPP changes, and human activities have a positive effect on NPP changes in these regions. However, in some regions, human activities have a significant negative effect on changes in vegetation NPP [18]. These results suggest that there are significant differences in the sensitivity and characteristics of the response of NPP to factors such as land use type, soil, climate change, and human activities in different regions with different driving mechanisms. Currently, the increasing impact of human activities on ecosystems has reached a level that cannot be ignored [19]. Therefore, it is crucial to accurately quantify the impacts of climate change and human activities on NPP, which not only helps us understand how these external factors change the ecological balance but also provides a scientific basis for the development of effective adaptive management strategies to mitigate the negative impacts of climate change and human activities on ecosystems [20].
Guizhou Province is located in a subtropical region at low latitudes, with one of the most typical karst landscapes in the world, and is also a key part of the ecological barrier of the Yunnan–Guizhou Plateau, with a complex and fragile ecosystem. Rocky desertification is particularly prominent in this region [21]; rocky desertification, in general, is extremely sensitive to climate change, responds to key aspects of global climate change, and has important regulating and indicative roles in global climate change [22]. Human policies or engineering projects have significant impacts on the environment and ecosystems [23]. Since 2000, a series of ecological projects, including returning farmland to forest and grassland projects, rocky desertification management, and forestation, have been implemented in Guizhou Province, and these measures have led to large-scale changes in vegetation coverage [24]. Although numerous scholars have studied NPP in Guizhou Province, these studies have focused mainly on the spatial and temporal evolution of NPP and the impacts of climate change [21, 25]. The characteristics of NPP changes, as well as the characteristics of the response of NPP changes in the context of human activities and climate change, are still issues that deserve further exploration.
In summary, in this study, Guizhou Province was selected as the study area, and multiple linear regression analysis and residual analysis models were constructed to isolate the impacts of climate change and human activities on NPP via meteorological data and NPP time series data from 2000 to 2020. The characteristics of the response of NPP to climate change and land cover change were revealed through partial correlation analysis, a land cover transformation matrix, and analysis of NPP transformation quantity, aiming to provide a scientific basis for ecological environmental protection and governance in Guizhou Province, as well as theoretical support for regulating regional climate change and promoting the sustainable development of regional ecosystems.
Materials and Methods
Study Area
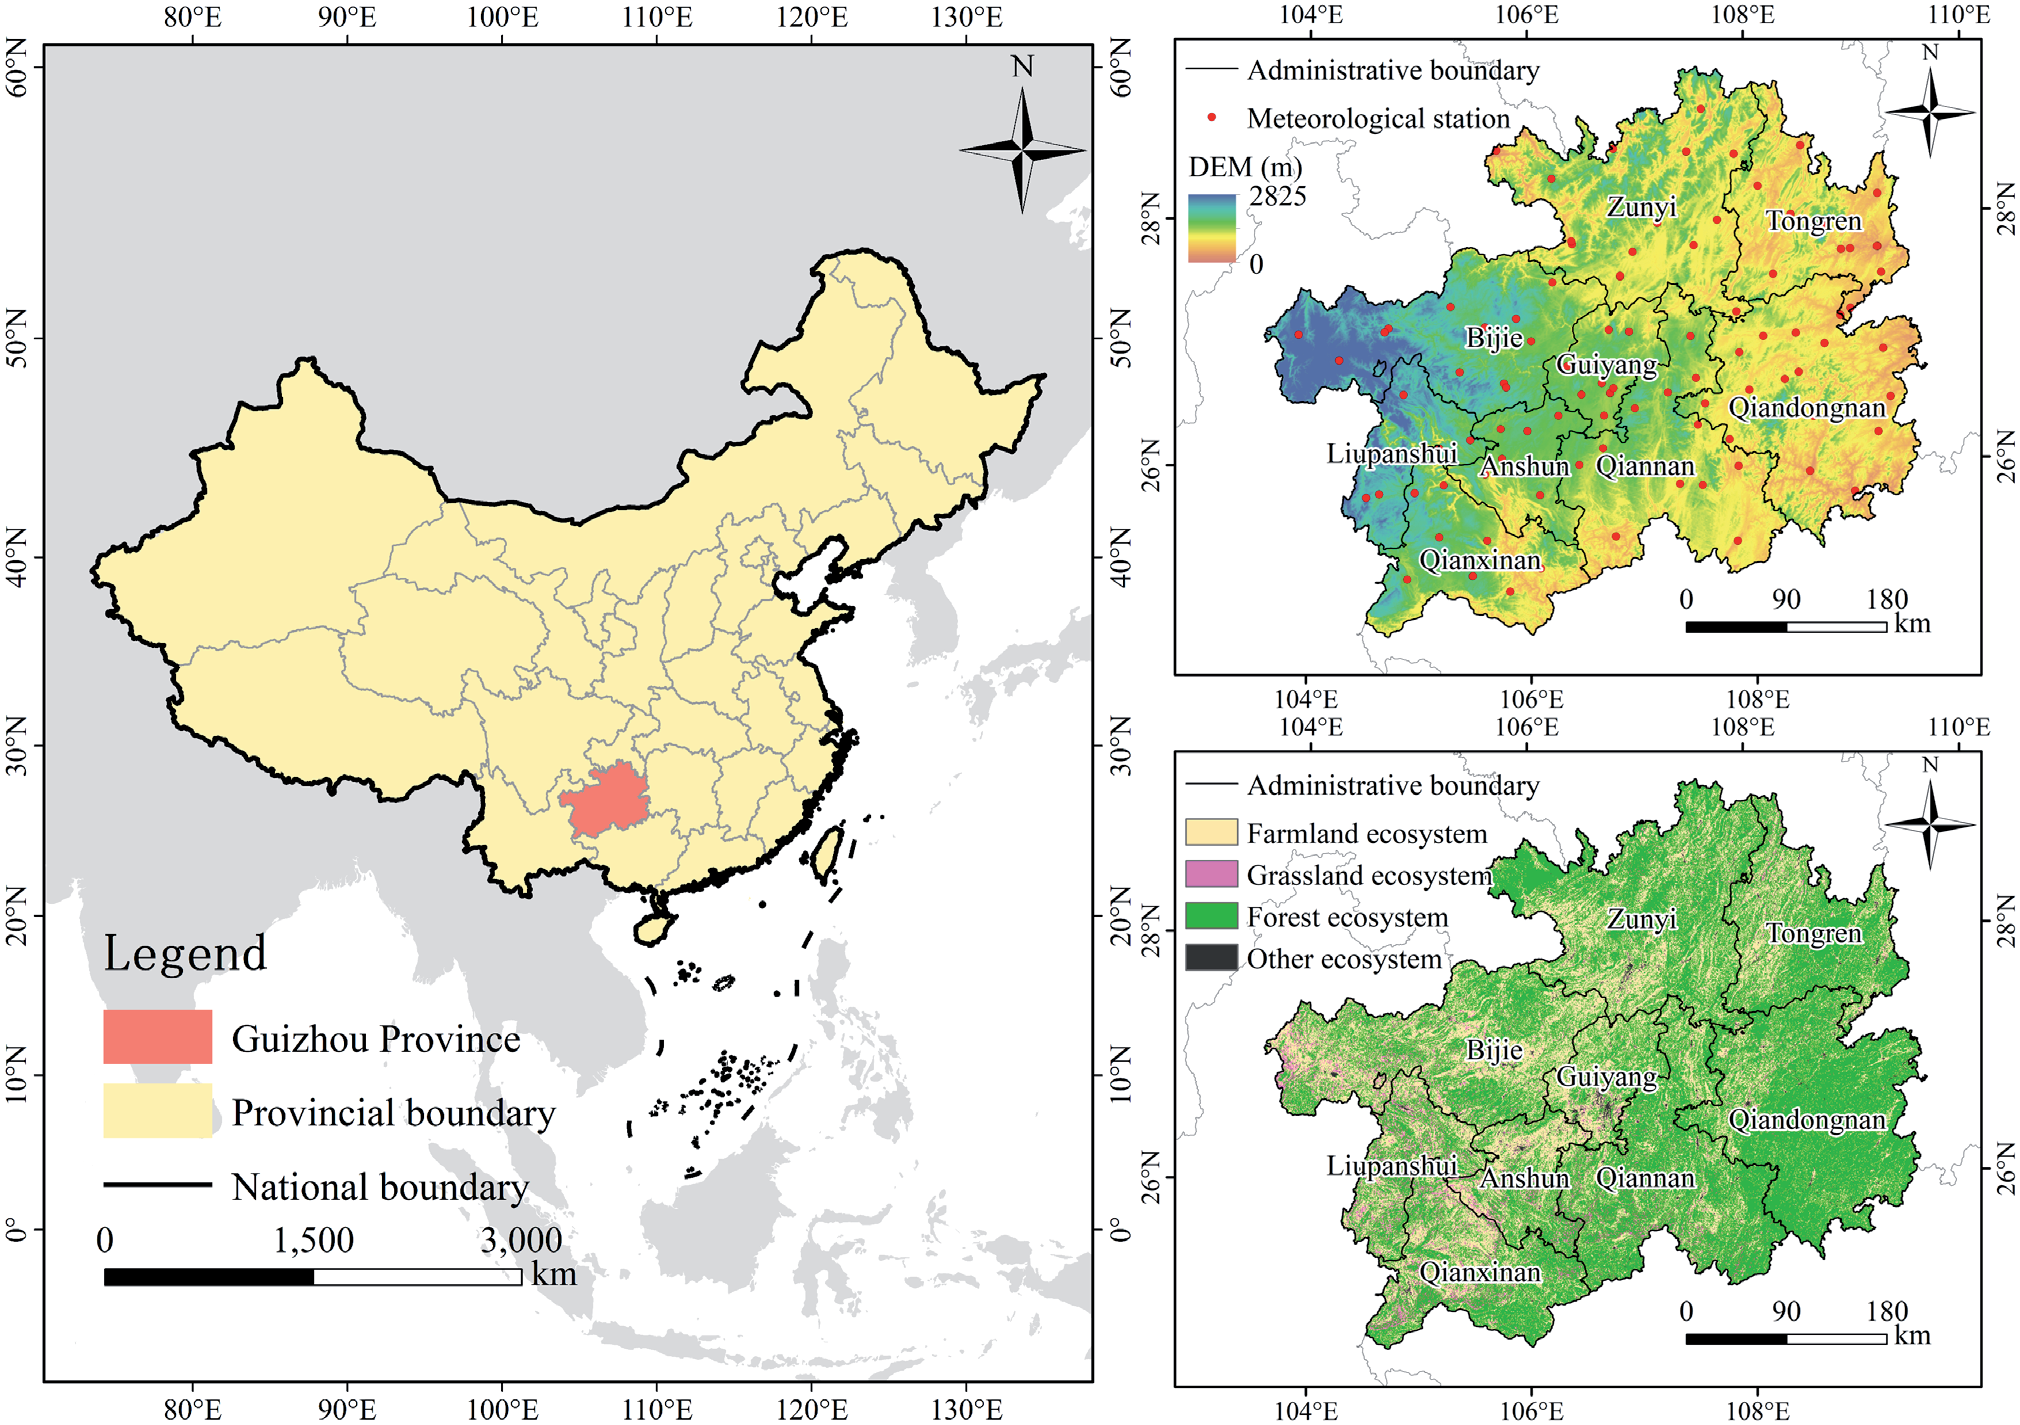
Guizhou Province (103°36′ ~ 109°35′E, 24°37′ ~ 29°13′N) is located in the transition zone between subtropical and temperate zones in southwestern China and has a population of approximately 38,000,000 people, a total area of 176,167 km2, and a subtropical monsoon climate (Fig. 1). The region has abundant vegetation types with high coverage, and according to the 2020 land cover data, the vegetated ecosystems in Guizhou Province account for 98.85% of the total area of the province, of which forests, grasslands, and farmland ecosystems account for 61.38%, 4.16%, and 33.31% of the total area of the province, respectively. Farmland ecosystems are distributed mainly in western and central Guizhou, grassland ecosystems are distributed mainly in western Guizhou, and forest ecosystems are concentrated mainly in eastern Guizhou. Guizhou Province is located in an area where karst plateaus and hilly mountains are intertwined; the area has a unique natural environment and topography, with complex topography, i.e., mainly hills, mountains, etc.; and most of the area is in an alpine zone with an altitude of more than 1,000 m, which is one of the largest karst geomorphological zones in China and one of the ecologically fragile zones.
Fig. 1.
Geographical location maps of the study area: the locations of (a) Guizhou Province in China’s administrative zoning map; (b) digital elevation model (DEM) of Guizhou Province and the locations of the meteorological stations; (c) ecosystem overview of Guizhou Province (based on 2020 land cover dataset classification).
Data
NPP Data
The NPP data involve the National Aeronautics and Space Administration’s (NASA) Moderate Resolution Imaging Spectroradiometer (MODIS) MOD17A3 product. The raw data were stored in HDF format with a spatial resolution of 500 m and a temporal resolution of once per year, covering the period from 2000 to 2020. After the data were downloaded, they were reprojected and formatted via the MODIS Reprojection Tool (MRT) projection tool and finally converted to TIFF format data in the WGS 1984/UTM48N coordinate system.
Meteorological Data
The meteorological data were obtained from the National Meteorological Science Data Center of China (https://data.cma.cn/), and the original format was text-based station data. After a series of preprocessing steps, such as outlier removal and time interpolation, the digital elevation model (DEM) was introduced as a covariate, and data interpolation was carried out by using ANUSPLIN to convert the station data into raster numbers, where the DEM data were from the ASTER GEDEM 30M product. Finally, we resampled the data so that the spatial resolution was 500 m and the temporal resolution was once per year, covering the period of 2000–2020.
Land Cover and Ecosystem Distribution Data
For the land cover data, the China Land Cover Dataset (CLCD) dataset published by Prof. Xin Huang's team at Wuhan University was used [26]. This dataset is a land cover dataset for China with a high spatial and temporal resolution, with an overall accuracy of 80%, and has been widely used in Chinese and regional studies [27, 28]. The dataset is divided into nine categories: cropland, forest, shrubland, grassland, water, ice, barren, impervious/built-up land, and wetland. The spatial resolution of the data is 30 m, and the temporal resolution is once per year, covering the period of 2000–2020. Moreover, in this study, a total of four ecological types of forest, grassland, farmland, and other ecosystems in Guizhou Province were extracted on the basis of land cover data.
Methods
Analysis of Trends in NPP Changes
The Theil–Sen median method, also known as Sen slope estimation, is a robust nonparametric statistical method for calculating trends. The method is computationally efficient, insensitive to measurement error and outliers, and is often used for analyzing trends in long time-series data [29]. Sen slope estimation is used to compute the trend value and is usually used in conjunction with the Mann‒Kendall nonparametric test. That is, the Sen trend value is calculated first, and then the MK method is used to determine the significance of the trend via the following formula.
where xj and xi represent the data values of year j and year i, respectively; the median is the median function; a slope greater than 0 indicates that the time series shows an increasing trend; and a slope less than 0 indicates that the time series shows a decreasing trend.
The Mann‒Kendall test is a nonparametric statistical test with the advantage that it does not require measurements to follow a normal distribution, it does not require that the trend be linear, it is not affected by missing values and outliers, and it is very widely used in significance tests of trends in long time-series data [30]. Its statistical test method is as follows:
where Z is the result of the standardized test statistic; xj and xi are the data values for year j and year, respectively; and n is the number of years of data.
At a given significance level, when the absolute value of Z is greater than 1.65, 1.96, and 2.58, the trend of the change passes the 90%, 95%, and 99% significance tests, respectively. In this paper, on the basis of the results of Theil–Sen trend analysis and the Mann‒ Kendall test results, the changes in the NPP trend in Guizhou Province from 2000 to 2020 were categorized into seven categories according to the criteria in Table 1.
Quantitative Stripping of the Impacts of Climate Change and Human Activities on NPP
On the basis of previous studies, the combination of regression and residual analyses is also generally recognized as an effective method for separating the relative impacts of climate change and human activities on vegetation [25]. Considering the main climatic characteristics affecting vegetation [31], in this study, precipitation (P), temperature (T), sunshine hours (SH), and relative humidity (RH) were selected as representative meteorological factors, and the real NPP calculated on the basis of the model was used as the response variable, denoted as the actual NPP (ANPP). The potential natural vegetation NPP, which is not disturbed by human activities in the ideal situation, is denoted as the potential NPP (PNPP), which is affected only by climate. The residual of the ANPP and PNPP, which represents the amount of NPP change caused by human activities, is denoted as the human NPP (HNPP). Their formulae for calculation are as follows:
where xi denotes the value of the meteorological factor; ki denotes the regression coefficient corresponding to each meteorological factor (i ranges from 1 to 4, denoting the temperature, precipitation, sunshine hours, and relative humidity, respectively); and β is a constant term.
Partial Correlation Analysis
NPP is subject to the combined effects of several meteorological factors, and the use of partial correlation analysis can reveal the effects of each meteorological factor on NPP while controlling for the effects of other meteorological variables on the partial correlation coefficients to obtain more accurate and reliable results. The formula is as follows:
where rab,c~p denotes the partial correlation coefficient between variables a and b, R2a(b,c...p) denotes the coefficient of determination for the regression analysis of variables a and (b ~ p), and R2a(b,c...p) denotes the coefficient of determination for the regression analysis of variables a and (c ~ p). After the maximum partial correlation coefficient was calculated, a t test was performed to determine whether the correlation was significant. The significance of NPP and meteorological factors were categorized into three levels of significance on the basis of the range of p values of the test results: insignificant correlation (p ≥ 0.05), significant correlation (0.01<p<0.05), and extremely significant correlation (p≤0.01).
Calculation of NPP Transformation Quantities
The land cover transformation matrix is an effective tool for analyzing land type transformation and obtaining quantitative data on the transformation of each land type. In this work, the land cover classification data in the study area were calculated and counted to derive the land cover transformation matrix from 2000 to 2020 in Guizhou Province. On the basis of the 2020 and 2000 land cover data, the amount of NPP change due to land cover transformation was calculated for each image element via the following formula:
where ΔNPP denotes the amount of NPP transformed, NPPout denotes the amount of NPP after the land cover change, and NPPformer denotes the amount of NPP before the land cover conversion.
Results and Discussion
Results
Spatial Distribution of NPP
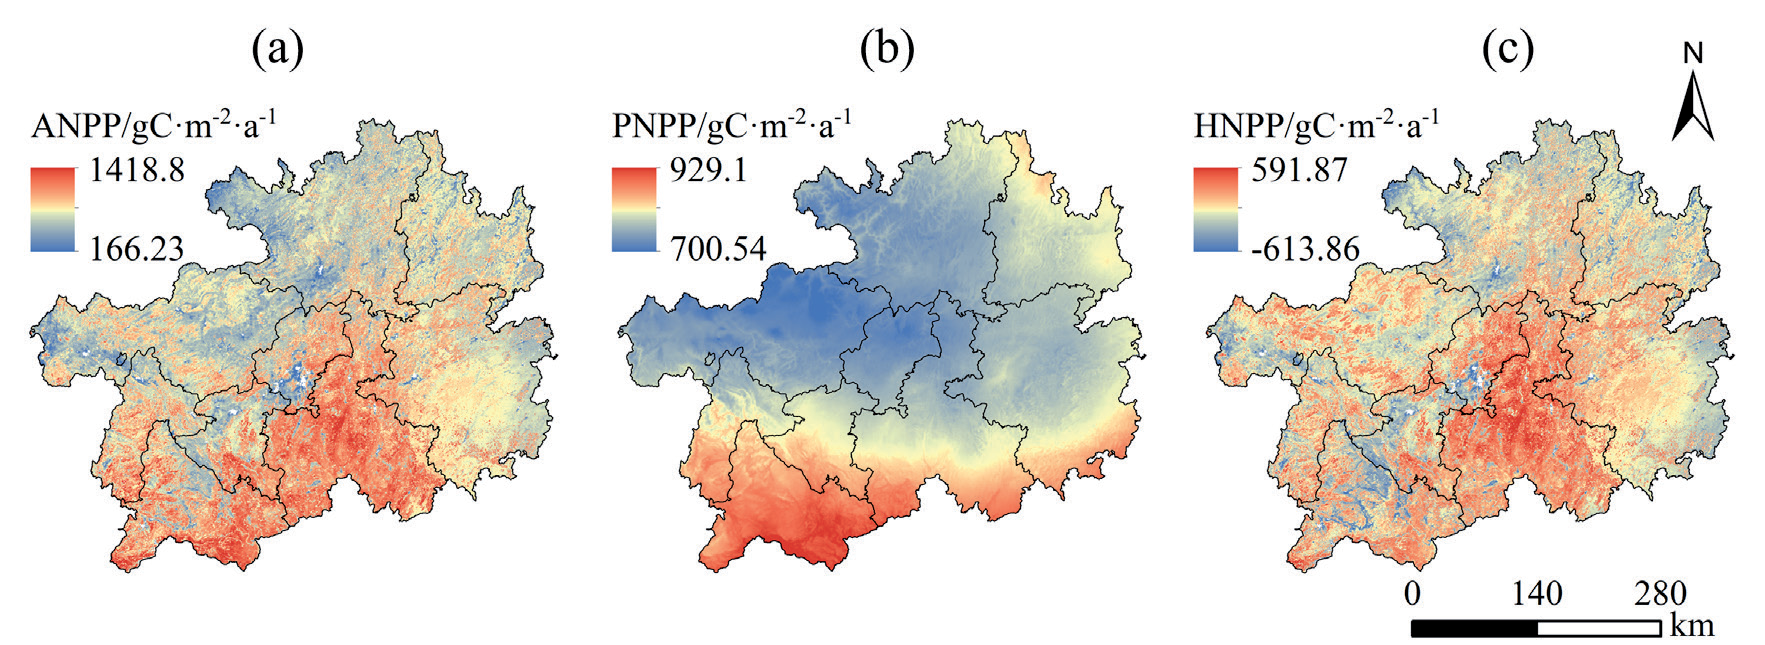
As shown in Fig. 2(a), the multiyear average NPP value in Guizhou Province was 785.32 gC/(m2·a), the highest value was 1418.8 gC/(m2·a), and the lowest value was 166.23 gC/(m2·a). From the viewpoint of spatial distribution, the overall NPP of Guizhou Province was high in the south–central and southwestern parts and low in the northern, eastern, and western parts. In terms of administrative divisions, the high-value areas were mainly concentrated in Qiannan, Qianxinan, and Liupanshui, which have abundant vegetation resources and a localized NPP of more than 800 gC/(m2·a); however, the low-value areas were mainly located in Guiyang, Bijie, and Zunyi, which are the most densely populated cities in Guizhou and are therefore subject to a greater influence of human activities and severe vegetation degradation, with a localized NPP of less than 200 gC/(m2·a).
As shown in Fig. 2(b), under the influence of climate change, the multiyear average PNPP value in Guizhou Province was 787.16 gC/(m2·a), with the highest value of 929.1 gC/(m2·a) and the lowest value of 700.54 gC/ (m2·a). In terms of the overall spatial distribution, the NPP under the influence of climate had a high distribution in southern and southwestern China and a low distribution in central, northern, and northwestern China. Given that climate is a large-scale factor, the overall difference in NPP under the influence of climate within the province fluctuated little, fluctuating above and below the multiyear mean value of 100 gC/(m2·a), affected by regional microclimate characteristics, and its standard deviation was 43.14 gC/(m2·a).
As shown in Fig. 2(c), the multiyear mean HNPP value in Guizhou Province under the influence of human activities was -1.88 gC/(m2·a), with the highest value of 591.87 gC/(m2·a) and the lowest value of -613.86 gC/ (m2·a). Positive values indicate that human activities have a promoting effect on NPP, negative values indicate that human activities have an inhibitory effect on NPP, and the absolute magnitude of the values indicates the intensity of the impact. Overall, the areas with the greatest impacts were distributed mainly in the central and south–central parts of Guizhou Province and in the areas around major cities, and the areas around cities were more affected by human activities, such as urbanization, which led to the degradation of vegetation and thus basically had an inhibitory effect.
Temporal Changes in NPP
As shown in Fig. 3(a), the NPP in Guizhou Province from 2000 to 2020 exhibited obvious interannual changes, with an overall fluctuating increasing trend in the NPP in the study area during the 21-year period and a large fluctuation from 2004–2012, with a rate of increase of 3.65 gC/(m2·a), and a multiyear average NPP of 785.32 gC/(m2·a). During the period from 2000–2020, forest, grassland, and farmland ecosystems all showed fluctuating increasing trends, with grassland ecosystems showing the highest rate of increase of 5.91 gC/ (m2·a), followed by farmland ecosystems, while forest ecosystems showed the lowest rate of increase. The average multiyear NPP values of the three ecosystems were ranked in descending order, with forest ecosystems having the highest value (807.94 gC/(m2·a), followed by grassland ecosystems, and farmland ecosystems having the lowest value.
Fig. 2.
Map of the average NPP distribution of Guizhou Province for 2000–2020. (a, b, c) Spatial distributions of the multiyear means of the ANPP, PNPP, and HNPP, respectively.
As shown in Fig. 3(b), the overall PNPP in Guizhou Province under the influence of climate change exhibited a fluctuating increasing trend, with a rate of increase of 1.14 gC/(m2·a). Forest, grassland, and farmland ecosystems all showed fluctuating increasing trends, and farmland ecosystems presented the highest rate of PNPP increase of 1.35 gC/(m2·a). Forest ecosystems were more stable than farmland ecosystems and grassland ecosystems in the 21-year period, and the overall change in the PNPP was smaller.
As shown in Fig. 3(c), the overall HNPP in Guizhou Province under the influence of human activities exhibited a fluctuating, increasing trend, with a rate of increase of 2.51 gC/(m2·a). The forest, grassland, and farmland ecosystems all showed fluctuating, increasing trends, with the grassland ecosystems showing the most significant rate of increase of 4.78 gC/(m2·a), whereas the forest and farmland ecosystems presented lower and closer increasing rates of 2.2 gC/(m2·a) and 2.86 gC/ (m2·a), respectively.
In summary, the NPP of all ecosystems in Guizhou Province showed a fluctuating increasing trend from 2000 to 2020. Among them, grassland ecosystems presented the most significant increasing trend, followed by farmland ecosystems, whereas forest ecosystems presented the least significant increasing trend. Under the influence of climate factors, all ecosystems showed fluctuating increasing trends. Among them, agricultural ecosystems showed the most significant increasing trend, while forest ecosystems were the most stable, but the overall range of change was not significant. Under the influence of human activities, all ecosystems showed fluctuating increasing trends, with grasslands showing a significantly greater increasing trend than forest and farmland ecosystems.
Characteristics of Spatial Changes in NPP
As shown in Fig. 4(a) and Fig. 4(d), the rates of change in NPP in Guizhou Province from 2000 to 2020 ranged from -42.16 to 114.71 gC/(m2·a). The province's NPP showed an increasing, decreasing, and stable trend, accounting for 51.44%, 6.42%, and 42.14%, respectively, with an overall increasing trend. In terms of the increasing trend, the percentages of significantly increasing and extremely significantly increasing areas were 14.06% and 31.38%, respectively, which were mainly distributed in the western part of Guizhou Province, especially in Bijie, while a small number of areas was also found in the Tongren area in the northeastern part of Guizhou Province. At the ecosystem scale, forest, grassland, and farmland ecosystems were dominated by insignificant changes and increasing trends. The areas of forest, grassland, and farmland ecosystems with insignificant changes accounted for 48.31%, 24.46%, and 32.71% of the total area, respectively, whereas the area with an increasing trend was much larger than that with a decreasing trend, accounting for 46.15%, 69.07%, and 60.09%, respectively. The percentages of areas with significantly increasing and extremely significantly increasing trends were 39.99%, 64.03%, and 54.12%, respectively.
Fig. 3.
Characterization of temporal changes in NPP in Guizhou Province and across ecosystems from 2000–2020. (a, b, c) Multiyear changes in the ANPP, PNPP, and HNPP, respectively.
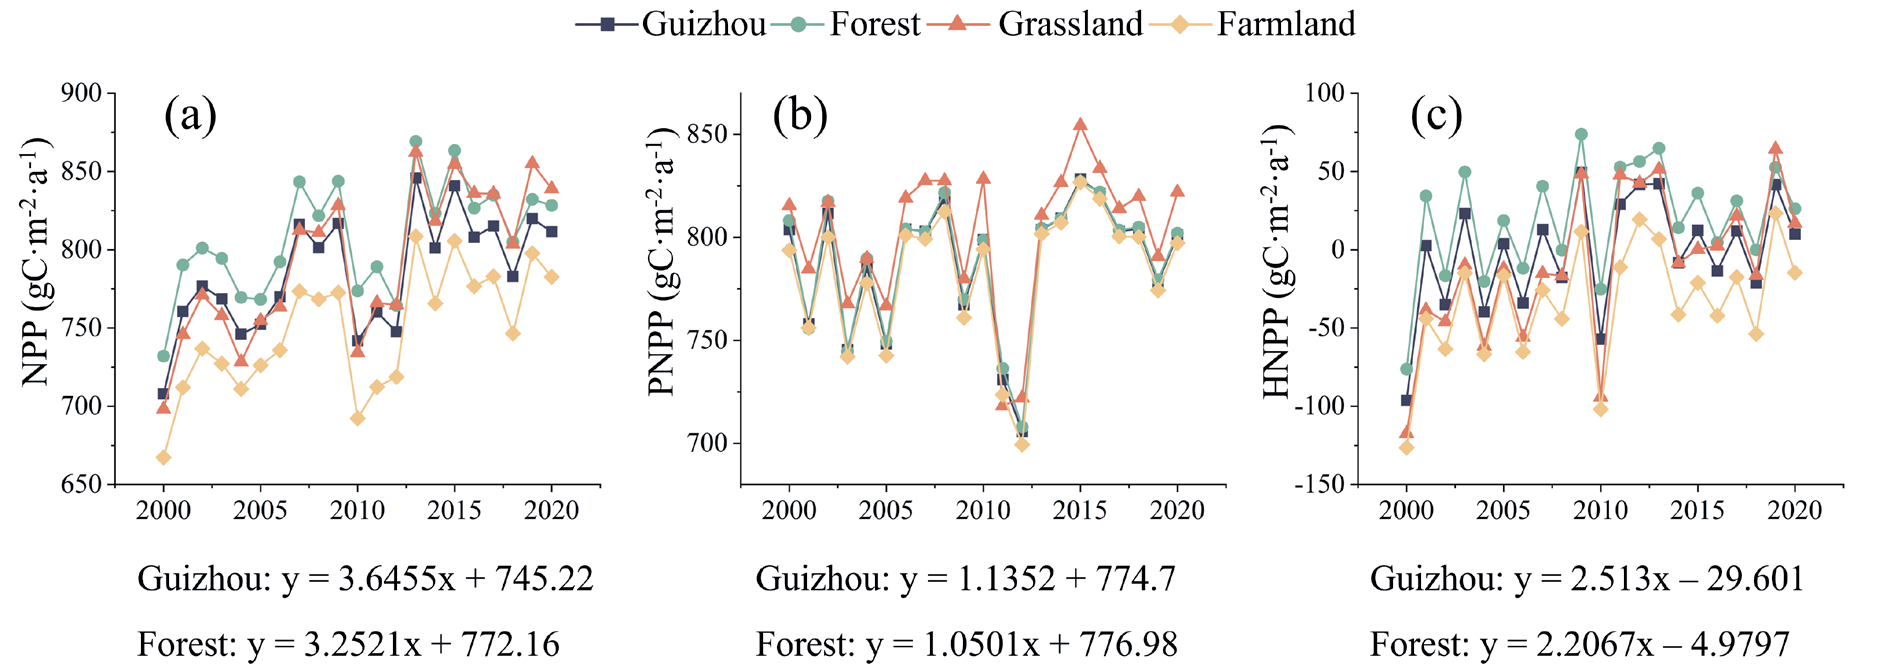
Fig. 4.
Characteristics of spatial changes in NPP in Guizhou Province from 2000–2020. (a, b, c) Rates of change in the ANPP, PNPP, and HNPP, respectively, based on spatial pixels. (d, e, f) Significance levels of the ANPP, PNPP, and HNPP, respectively, on the basis of spatial pixels, where ESD, SD, ID, S, II, SI, and ESI represent extremely significant decreases, significant decreases, insignificant decreases, stable, insignificant increases, significant increases, and extremely significant increases, respectively.
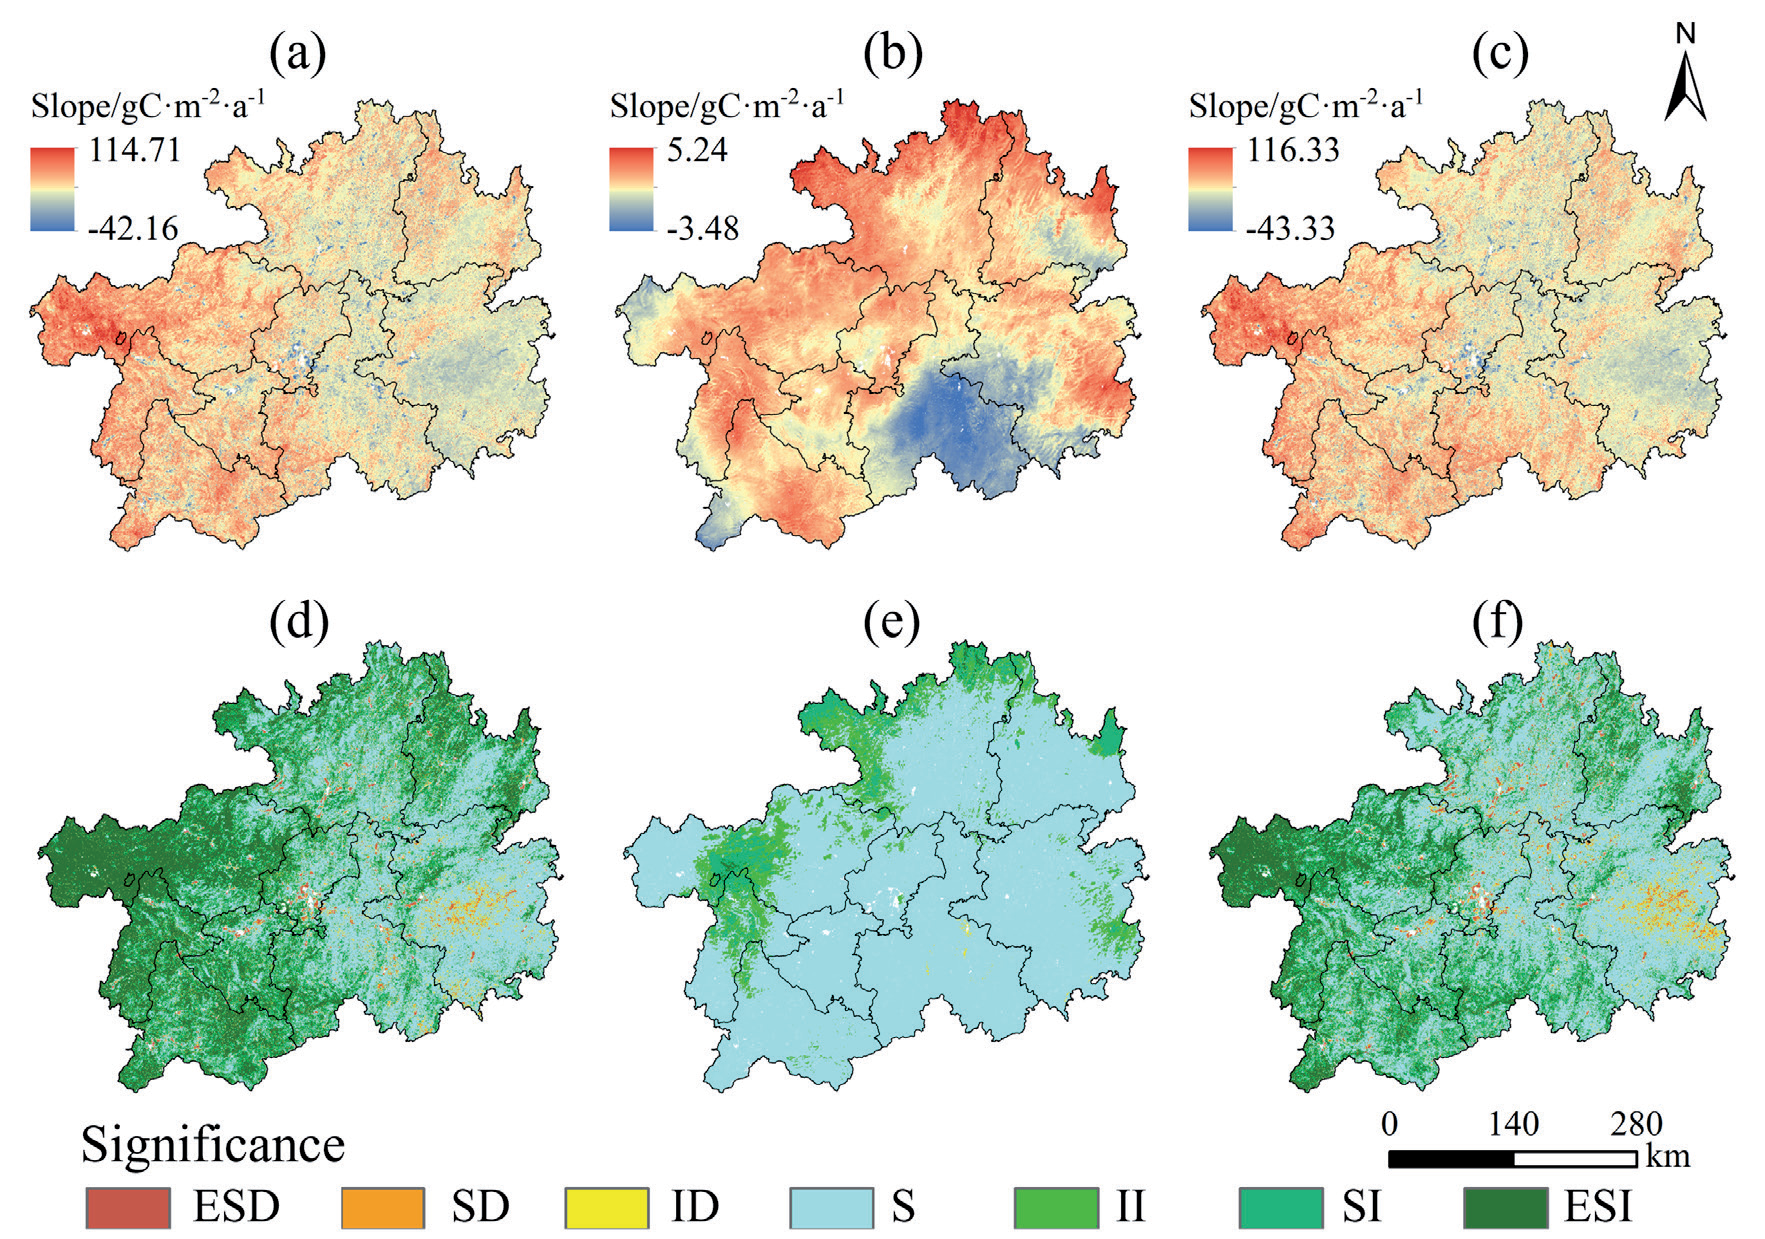
Fig. 4(b) and Fig. 4(e) show that the rates of change in the PNPP in Guizhou Province under the influence of climate change ranged from -3.48 to 5.24 gC/(m2·a) from 2000 to 2020. The percentages of areas with increasing, decreasing, and stable trends in the PNPP in the province were 14.87%, 0.06%, and 85.07%, respectively, with an overall stable and unchanging trend. Among the increasing trends, a slight growth trend dominated at 8.37%, while the percentages of areas with significant and extremely significant growth were only 6.2% and 0.3%, respectively. The overall growth trend was distributed mainly in the northern and eastern fringes of Guizhou Province and the border zone between Bijie and Liupanshui. Under the influence of climate change, forest, grassland, and farmland ecosystems also presented insignificant changing trends, accounting for 85.21%, 83.89%, and 84.75% of their respective total areas, whereas the increasing trends accounted for 14.72%, 16.1%, and 15.18% of their respective total areas.
Fig. 4(c) and Fig. 4(f) show that under the influence of human activities, the rates of change in the HNPP in Guizhou Province from 2000 to 2020 ranged from -43.33 to 116.33 gC/(m2·a). The areas with increasing, decreasing, and stable trends in the HNPP accounted for 37.37%, 7.97%, and 54.66%, respectively, of the total area. The areas with significant and extremely significant increases in the HNPP accounted for 31.08%, which were mainly distributed in the western part of Guizhou Province, among which the western part of Bijie contained the largest number of areas. The areas of forest, grassland, and farmland ecosystems with insignificant trends under the influence of human activities accounted for 60.11%, 34.86%, and 47.22% of the total area, respectively, and the areas with increasing trends accounted for a much larger proportion than those with decreasing trends, which accounted for 32.88%, 57.93%, and 43.86%, respectively. Among them, the proportions of areas with significant and extremely significant increasing trends were 26.84%, 51.2%, and 37.05%, respectively.
The above analysis revealed that the NPP in Guizhou Province tended to increase in most areas. Among them, the area and magnitude of the increase in NPP in the grassland ecosystems were greater than those in the forest and farmland ecosystems, while those in the farmland ecosystems were the second highest. Overall, climate change and human activities had greater facilitating effects than inhibitory effects on NPP in Guizhou Province, but climate change in general did not have a significant effect on NPP. Both climate change and human activities had the largest percentage of the area with facilitating effects on grassland ecosystems, followed by farmland ecosystems, indicating that grassland ecosystems were more susceptible to the effects of human activities.
Partial Correlation between NPP and Meteorological Factors
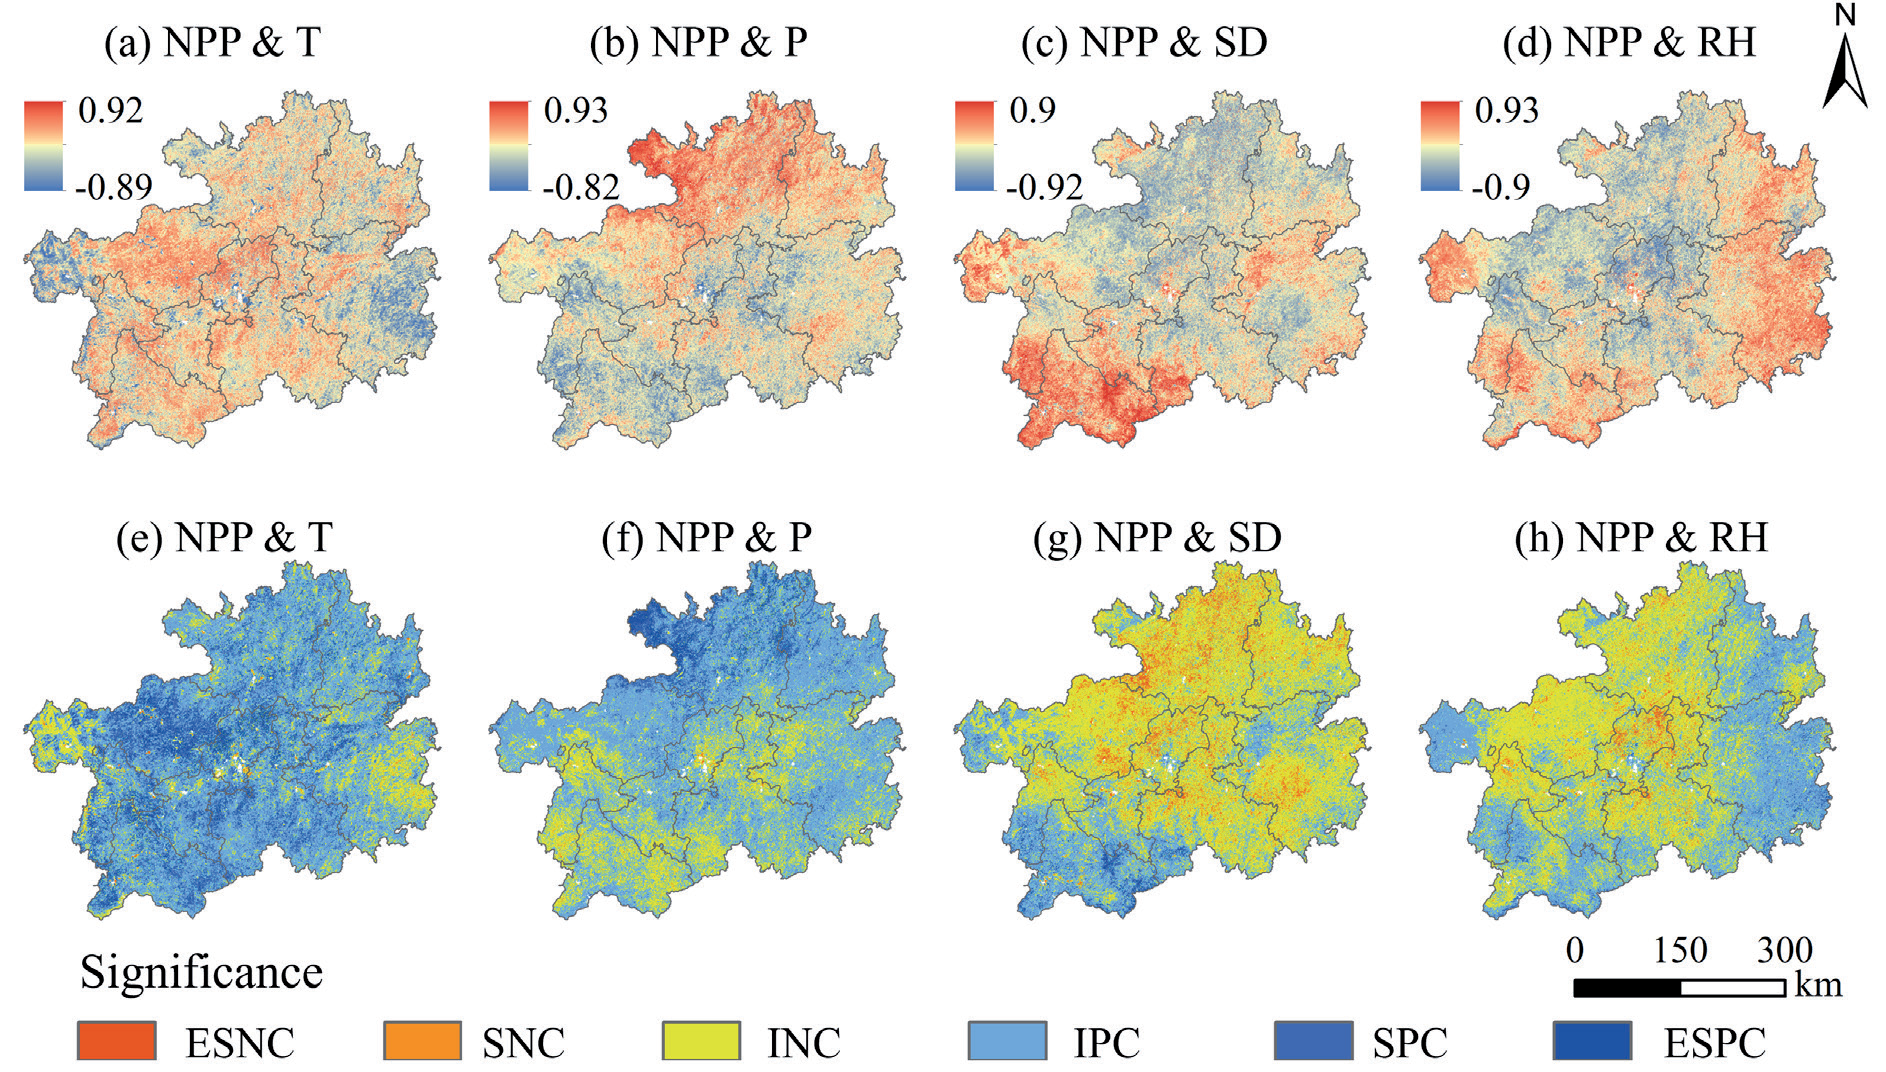
As shown in Figs. 5(a) to Fig. 5(d), the partial correlation coefficients between NPP and temperature in Guizhou Province from 2000 to 2020 ranged from -0.89 to 0.92. The positive high values were distributed mainly in Bijie and Guiyang, and the negative high values were distributed mainly in the western parts of Bijie and Qiandongnan; the maximum partial correlation coefficients between NPP and precipitation ranged from -0.82 to 0.93. The positive high values were distributed mainly in the northern part of Guizhou Province, whereas the negative high values were distributed mainly in the southeastern and central regions. The maximum partial correlation coefficients between NPP and relative humidity ranged from -0.92 to 0.9, with positive high values distributed mainly in the southwestern part of Guizhou Province, whereas the negative high values were distributed mainly in the central and northern parts of Guizhou Province. The maximum bias correlation coefficients between NPP and sunshine hours range from -0.9 to 0.93, with positive high values distributed mainly in the western, southwestern, and southeastern regions of Guizhou Province, whereas the negative high values were distributed mainly in central and northern Guizhou Province.
Figs. 5(e) to Fig. 5(h) show that at the regional scale, Guizhou Province had the largest percentage of the area where NPP was positively partially correlated with temperature and precipitation, the values of which were 82.83% and 72.8%, respectively. The largest percentage of the area was negatively partially correlated with the relative humidity and sunshine hours, the values of which were 67.9% and 53.39%, respectively. For the positive correlation factors, specifically, the area of NPP was significantly positively and extremely significantly positively correlated with temperature, accounting for as much as 23.37%, which was much greater than that with precipitation of 9.4%. The regional distribution was relatively uniform, with only small differences in the western part of Bijie and the eastern part of Qiannan. For the negative correlation factors, the percentage of areas with significant and extremely significant negative correlations between NPP and relative humidity was 9.19%, which was much greater than that between NPP and sunshine hours (3.63%). The distribution of this correlation was mainly concentrated in the central and northern regions of Guizhou Province.
At the ecosystem scale, except for the forest ecosystem, where the proportion of the area that was positively correlated with sunshine hours (51.06%) was slightly greater than that negatively correlated (48.94%), the results were similar to those at the regional scale, and the proportion of the area that was positively correlated with temperature and precipitation was greater than that negatively correlated with relative humidity and sunshine hours, whereas the proportion of the area that was negatively correlated with relative humidity and sunshine hours was greater than that negatively correlated. The proportion of the area that was negatively correlated with relative humidity and sunshine hours was greater than the proportion of the area that was positively correlated. The percentages of areas in the forest, grassland, and farmland ecosystems where NPP was positively correlated with temperature were greater than those with other meteorological factors, which were 82.59%, 80.76%, and 84.31%, respectively, and the percentages of areas where NPP was significantly positively correlated and extremely significantly positively correlated were as high as 20.73%, 27.38%, and 28.12%, respectively. The percentages of areas where NPP was positively correlated with temperature and precipitation were all greater than those of other ecosystems, and the percentages of areas where NPP was positively correlated were all greater than those of all ecosystems. The area proportion of farmland ecosystems where NPP was positively correlated with temperature and precipitation was the largest among all ecosystems, and the area proportion where NPP was negatively correlated with the maximum partial correlation of sunshine hours was greater than that of other ecosystems. The area proportion where NPP was negatively correlated with relative humidity was slightly smaller than that of forest ecosystems (67.56%), but the area proportion where NPP was significantly negatively correlated with precipitation and extremely significantly negatively correlated with sunshine hours was 9.56%, which was slightly larger than that of forest ecosystems (9.15%).
In summary, at the regional scale, climate change had a dual effect on NPP in Guizhou Province, and there were significant geographical differences. Temperature and precipitation were the main factors contributing to the increase in NPP, with temperature playing a more significant role; relative humidity and sunshine hours played an inhibitory role in the increase in NPP, with relative humidity playing a more significant inhibitory role. At the ecosystem scale, temperature had a significant effect on NPP changes in all ecosystems, whereas sunshine had a slightly greater effect on forest ecosystems than on forest ecosystems and a more obvious inhibitory effect on farmland and grassland ecosystems. Overall, farmland ecosystems were the most significantly affected by climate change.
Fig. 5.
Partial correlation coefficients (a, b, c, d) and significance levels (e, f, g, h) between NPP and meteorological factors in Guizhou Province. ESNC, SNC, INC, IPC, SPC, and ESPC represent extremely significant negative correlations, significant negative correlations, insignificant negative correlations, insignificant positive correlations, significant positive correlations, and extremely significant positive correlations, respectively.
Relationship between NPP and Land Cover Change
Changes in land cover respond to the transformation process of nature by human activities at the macro level. Using the land cover classification data of Guizhou Province in 2000 and 2020, the land cover transformation matrix of Guizhou Province from 2000 to 2020 can be derived, as shown in Table 2. During this period, the total area of land cover change in Guizhou Province was 32,121.08 km², accounting for 18.23% of the total area of the province. The most important land cover change was the conversion between cropland and forest, with farmland to forest accounting for 30.53% of the total change and forest to cropland accounting for 30.19% of the total change, followed by shrubland to cropland and forest and, again, grassland to cropland and forest.
During the 21-year period, the areas of cropland, forest, water, and built-up land in Guizhou Province all showed increasing trends, increasing by 724.68 km2, 3022.18 km2, 263.18 km2, and 929.25 km2, respectively. In contrast, the areas of shrublands and grasslands decreased, decreasing by 3,295 km2 and 1,644 km2, respectively. Overall, land cover change was characterized by the occupation of shrublands and grasslands and increases in the areas of cropland, forest, water, and built-up land. Land cover changes also led to changes in the total amount of NPP. On the basis of the land cover data from 2000 and 2020, as well as the NPP data, in this study, the amount of NPP transformed during land cover changes was evaluated by calculating the amount of NPP in the process of changes in land cover, as shown in Table 3. The results revealed that the total amount of NPP in Guizhou Province generally increased by 3.6801 TgC. Among the land cover changes, the conversion of cropland, forest, and shrubland to water and built-up land led to a decrease in the total amount of NPP, whereas the conversion of cropland and forestland to each other, the conversion of shrubland to cropland and forest, and the conversion of grassland to cropland and forest led to an increase in the total amount of NPP. The increase in the total amount of NPP was derived mainly from the increase in the areas of forest and cropland, and the total decrease in NPP was due mainly to the conversion of other land to water and built-up land.
Table 2.
Land cover transformation matrix (km2).
Table 3.
NPP transformation during land cover changes (TgC).
Discussion
Characteristics of the Spatial and Temporal Distributions of NPP and Its Changes
The spatial and temporal evolution of ecosystem NPP and driving factors in Guizhou Province were analyzed via the NPP product of MODIS MOD17A3, which yielded a multiyear average NPP of 785.32 gC/ (m2·a) from 2000 to 2020, which was higher than the 2000–2015 average NPP of 481.2 gC/(m2·a) estimated via the CASA model by Chen[32]. This indicates that there were some differences between the model-estimated and remote sensing-monitored NPP values, but the trends and distributions were similar. The overall spatial distribution was characterized by higher values in the south–central and southwestern parts and lower values in the northern, eastern, and western parts. The low-value areas were located mainly in Guiyang, Bijie, and Zunyi.
Temporally, Guizhou Province showed an overall fluctuating increasing trend during the 21-year period and a decreasing trend from 2004–2010. The decreasing trend between 2004 and 2010 was due mainly to the global natural disaster that occurred in 2003, as well as the major drought in the southwest region from 2009 to 2012 [33]. Under drought conditions, vegetation can cause a sharp decline in photosynthetic activity to better control water loss and may also cause vegetation degradation, thus inhibiting NPP [34]; therefore, NPP in Guizhou Province showed a decreasing trend between 2004 and 2010. During this 21-year period, the NPP of all types of ecosystems in Guizhou Province showed a fluctuating increasing trend, among which grassland ecosystems presented the greatest increase in NPP, followed by farmland ecosystems and forest ecosystems. This was due mainly to the success of scientific farmland management, returning farmland to forests and grasslands, and carrying out green management and ecological restoration during this 21-year period [35].
At the spatial scale, the trend of the change in NPP in Guizhou Province over the 21-year period was mainly an increase, and these areas were mainly distributed in the western region of Guizhou Province, with Bijie being significant, and the remaining areas were also distributed in the Tongren region in the northeastern part of Guizhou Province. The decreasing areas were distributed mainly in the central and eastern parts of Guizhou Province. The areas with decreasing trends were mainly distributed around large cities, such as Guiyang, Zunyi, Anshun, and Qiandongnan. Due to the influence of urbanization, the surrounding cropland, grassland, shrubland, and forest have been continuously eroded and occupied as urban areas have advanced, and the vegetation cover has declined [36], which has led to a decreasing trend in the NPP near these cities.
Characteristics of Spatial and Temporal Changes in NPP under the Influence of Climate Change and Human Activities
Under the influence of climate change, the overall PNPP in Guizhou Province from 2000 to 2020 showed a fluctuating increasing trend, in which the farmland ecosystem had the fastest rate of increase, the grassland ecosystem had the greatest fluctuation, and the forest ecosystem had the smallest increasing trend and fluctuation. The main reason is that forest ecosystems are more stable and more resistant to climate change, so their changes are small, while grassland ecosystems are small in area and have the weakest ecosystem stability, so their fluctuations are the strongest due to the influence of climate. In terms of spatial distribution, the PNPP tended to increase in the fringe area between western and northern Guizhou Province, probably because of the influence of Guizhou Province’s topography, which decreased in a step-like manner from west to east. Guizhou Province has a subtropical monsoon climate, and the summer winds are impeded by the topography as they advance, thereby increasing the precipitation on the windward slopes of the mountains, which makes the PNPP increase steadily [37].
Under the influence of human activities, the overall HNPP in Guizhou Province from 2000 to 2020 showed a fluctuating increasing trend, in which the grassland had the fastest rate of increase, mainly because, in recent years, in Guizhou, the protection and restoration of grasslands have been continuously strengthened; degraded grasslands have been restored through artificial grass planting, grassland improvement, fence construction, and other technological means; and grassland protection and ecological demonstration zones have been actively established [38, 39], which has caused the grassland PNPP to continue increasing. In addition, the grassland area is small, so the average rate of increase is the highest. Overall, as the national government continues to emphasize the concept of "green mountains are golden mountains" and pursue green development, it has vigorously promoted the transformation of economic development to a green economy in recent years [40, 41]; and continuously strengthened the protection of ecosystems as well as environmental governance; and comprehensively managed mountains, water, forests, fields, lakes, and grasses, which have together contributed to the continuous growth of the overall HNPP. In terms of spatial distribution, the decreasing trend was found mainly near major cities and their satellite cities in Guizhou Province, primarily due to the advancement of urbanization, which has led to the destruction of nearby vegetation.
Characterization of the Response of NPP to Drivers
At the regional scale, temperature and precipitation were the main contributors to NPP in Guizhou Province from 2000–2020. Among them, the proportion of areas with a positive correlation between temperature and NPP in Guizhou Province was greater than that of other meteorological factors. This is mainly because Guizhou Province has a subtropical monsoon climate with sufficient precipitation; the annual average precipitation is between 845.2 and 1826 mm, and the abundant precipitation reduces the sensitivity of the NPP response [42]. The rugged terrain of Guizhou Province increases the geographical difference in temperature so that the temperature increases the NPP of Guizhou Province more strongly than the other meteorological factors do.
The inhibitory effect of sunshine hours and relative humidity on NPP was slightly greater than the promotional effect, in which the slight inhibitory effect produced by sunshine hours may be because water resources are more limited in some areas and the lower water supply limits its productivity [43]. The increase in sunshine hours accelerates the increase in ground temperature, which may lead to local drought and then cause the NPP to decrease [44]. Relative humidity inhibits NPP more than promotes it, mainly because the relative humidity in Guizhou Province is between 76.7% and 82.84% over many years, and the higher humidity may weaken the evapotranspiration of some plants; the ability of plants to transport minerals decreases, which may also lead to the closure of the stomata of some plants, thereby slowing photosynthesis and then decreasing the NPP [45].
At the ecosystem scale, the effects of temperature and precipitation and the promotional effect on the NPP of farmland ecosystems are more significant and stronger than those on forest ecosystems and grassland ecosystems. The main reason for this is that the spatial distribution of precipitation and temperature in Guizhou Province is high in the northwest and low in the southeast. Grassland is distributed mainly in the western part of Guizhou Province, forest is found primarily in the southeastern part of Guizhou Province, and farmland occurs mainly in the northwestern part of Guizhou Province; thus, farmland ecosystems are more sensitive to the response of temperature and precipitation, and the promotion of NPP by temperature and precipitation in farmland ecosystems is more pronounced. This finding is consistent with the results of previously published studies. In addition, the protection and management of forests and grasslands have been continuously strengthened since 2000, and forests and grasslands have been restored by means of returning farmland to forests and grasslands, establishing ecological protection and restoration pilot programs, and improving grasslands, etc., which has made their ecosystems more stable under artificial intervention; thus, their response to climate change is less sensitive than that of farmland ecosystems [46].
Land cover transformation in Guizhou Province from 2000 to 2020 had a dual effect on NPP. The analysis revealed that the area of changes in land cover in Guizhou Province during the 21-year period accounted for 18.23% of the total area of the province, which was manifested mainly in the occupation of cropland, forest, and grassland via construction land; the transformation between cropland and forest; and the transformation of large amounts of shrubland and grassland to cropland and forest. In the transformation process, when other types are transformed into construction land, a decrease in NPP occurs, mainly because as urbanization develops, cities continue to expand and occupy arable land and forest and grassland, which damages the nearby ecological environment and then leads to a decrease in NPP. Since 2000, the Chinese government has continuously emphasized the protection of the ecological environment and the building of an ecological civilization and has actively promoted green development. This process has resulted in the effective protection and restoration of the ecosystem through a variety of means, including afforestation, the return of farmland to forests and grasslands, and scientific management. In addition, the implementation of the regional integration strategy of the Yangtze River Economic Belt has also positively contributed to the improvement of the ecological environment in the study area [47]. As a result, overall, the NPP of Guizhou Province has continuously improved.
Conclusions
(1) The multiyear average NPP in Guizhou Province from 2000 to 2020 was 785.32 gC/(m2·a), and the spatial distribution was characterized by high values in the south–central and southwestern parts and low values in the northern part, eastern, and western parts. Temporally, the overall NPP in Guizhou Province showed a fluctuating increasing trend, with a rate of 3.65 gC/(m2·a). The NPP of each ecosystem also showed a fluctuating increasing trend, among which the grassland ecosystem presented the most significant increasing trend, with a rate of 5.91 gC/(m2·a), followed by the farmland ecosystem. At the spatial scale, the area of Guizhou Province with an increasing trend in NPP was 51.44%, which was much larger than the area with a decreasing trend of 6.42%. The distribution mainly showed an increasing trend in the west and north and a basically stable and decreasing trend in the central and eastern regions.
(2) Climate change has had a dual effect on NPP in Guizhou Province and has shown obvious geographical differences but has generally had a facilitating effect. Temperature and precipitation were positively correlated with NPP, accounting for 82.83% and 72.8% of the area, respectively, and the promoting effect was greater than the inhibitory effect. Sunshine hours and relative humidity were negatively correlated with NPP, accounting for 67.9% and 53.39% of the area, respectively, with a slightly greater inhibitory effect than a promotional effect. Among the meteorological factors, temperature had the most significant promoting effect, and among the ecosystems, the farmland ecosystem was the most significantly affected by climate change.
(3) Human activities have had a dual effect on NPP in Guizhou Province but have generally had a facilitating effect, in which the transformation of forest and cultivated land was the main factor influencing the increase in NPP. With the advancement of urbanization, construction land has been constantly expanding outwards to occupy croplands, forests, grasslands, etc., which has damaged the ecological environment and has led to a decline in NPP. However, owing to a large amount of forest and cropland being transformed in the area, NPP has been increasing, and the government has been strengthening ecological environmental protection and management; thus, the NPP of each ecosystem has also been increasing. Among the ecosystems, the grassland ecosystem was most significantly affected by human activities.

