

Introduction
Rivers harbor a rich diversity of life and are pivotal in performing critical ecosystem services on Earth. In the past decades, hydraulic engineering has played a crucial role in flood control, irrigation, water supply, and power generation. However, it has also disrupted river connectivity, thus profoundly impacting the structure and function of river ecosystems [1, 2]. As human activities intensify and climate change progresses, numerous rivers globally are facing the loss of biodiversity and the degradation of ecosystem functions [3-5]. Consequently, it is increasingly crucial to conduct ecological monitoring and assessments of rivers. Biological monitoring is a vital method for assessing aquatic organisms and environments, capable of accurately reflecting the condition of water quality [6]. Conducting biological monitoring not only helps in assessing the adverse impacts of human activities on river ecosystems, but also aids in supporting the restoration of important aquatic biological resources and the reconstruction of damaged ecosystems.
Aquatic ecosystems are composed of diverse biological groups. Traditionally, the health of aquatic ecosystems is assessed by the presence of specific indicator species. However, relying exclusively on these indicator species may not always provide an accurate representation of the overall ecological state, potentially resulting in skewed evaluations [7]. The index of biotic integrity (IBI), introduced by Karr in 1981 [8], offers a more comprehensive approach to evaluating aquatic ecosystems. Over the past four decades, the IBI has been extensively applied to various biological groups, including fish, benthic macroinvertebrates, aquatic plants, and plankton, establishing itself as a widely embraced method for aquatic ecosystem health assessment [9-12].
Benthic macroinvertebrates and fish play a pivotal role in maintaining the structure and function of aquatic ecosystems. Benthic macroinvertebrates, characterized by their rich diversity, sensitivity to environmental changes, and prevalence in nearly all aquatic habitats, are considered effective indicators of aquatic ecosystems [13]. Furthermore, macroinvertebrates with varied sensitivities to human disturbances can respond to rapid ecosystem changes like environmental pollution [14]. As apex consumers in the food chain, fish are not only easy to collect, process, and identify, but also highly sensitive to habitat loss and various environmental stresses [15]. Their population structure changes can directly indicate the health of the entire ecosystem [16]. Additionally, their strong mobility and longer lifespans allow them to reflect the comprehensive condition of aquatic ecosystems over wider spatial and temporal scales. Therefore, benthic macroinvertebrates and fish have become primary focuses in biological assessments, widely used in evaluating the health of aquatic ecosystems [15, 17, 18]. However, the application of IBI is constrained by methodological limitations, notably in addressing the nuances of regional environmental variations and uniqueness. Assessments based on a single biological group may not fully capture the complex impacts of human activities on entire ecosystems. Thus, a combined evaluation of both fish and benthic macroinvertebrates is anticipated to offer more comprehensive and effective strategies for the protection and management of river ecosystems.
The Yellow River, as one of China’s most important rivers, bears immense social, economic, and cultural value while simultaneously maintaining a rich biodiversity and providing essential ecosystem services. However, due to rapid industrialization, urbanization, and the escalating impacts of global climate change, the hydrological regime of the upper Yellow River basin has shown remarkable variations, leading to numerous issues [19]. Since the construction of the Liujiaxia Dam in the 1950s, the section of the upper Yellow River from Longyangxia to Liujiaxia has developed 13 hydropower stations, making it a key center for hydropower activities in the upper reaches of the Yellow River. Affected by human activities, especially the construction of large-scale hydraulic projects, the river habitat in the upper reaches of the Yellow River has undergone significant changes, posing serious threats to biodiversity. This study focuses on the section from Longyangxia to Liujiaxia in the upper Yellow River. By synthesizing historical data with field surveys, it delves into the composition and dynamics of key aquatic communities, including benthic macroinvertebrates and fish. Integrating the benthic index of biotic integrity (B-IBI) and fish stocking index (FSI), it comprehensively assesses the biotic integrity of the river, providing a scientific basis for undertaking ecological protection and restoration in the upper reaches of the Yellow River.
Materials and Methods
Site Description
The upper reaches of the Yellow River have a concentrated gradient, making it one of China’s important hydropower bases. The section of the Yellow River extending from Longyangxia to Liujiaxia in the upper reaches covers approximately 420 kilometers and features a significant elevation drop of 795 meters, boasting rich hydrological resources. A total of 13 hydroelectric stations have been constructed in this segment, making it the most concentrated area of developed hydropower on the upper Yellow River. Due to extensive development, only 11.4% of the total length remains as natural river segments. The construction of reservoirs and the development of cascade hydropower stations have led to habitat fragmentation in this stretch, severely impacting the habitats of many native species.
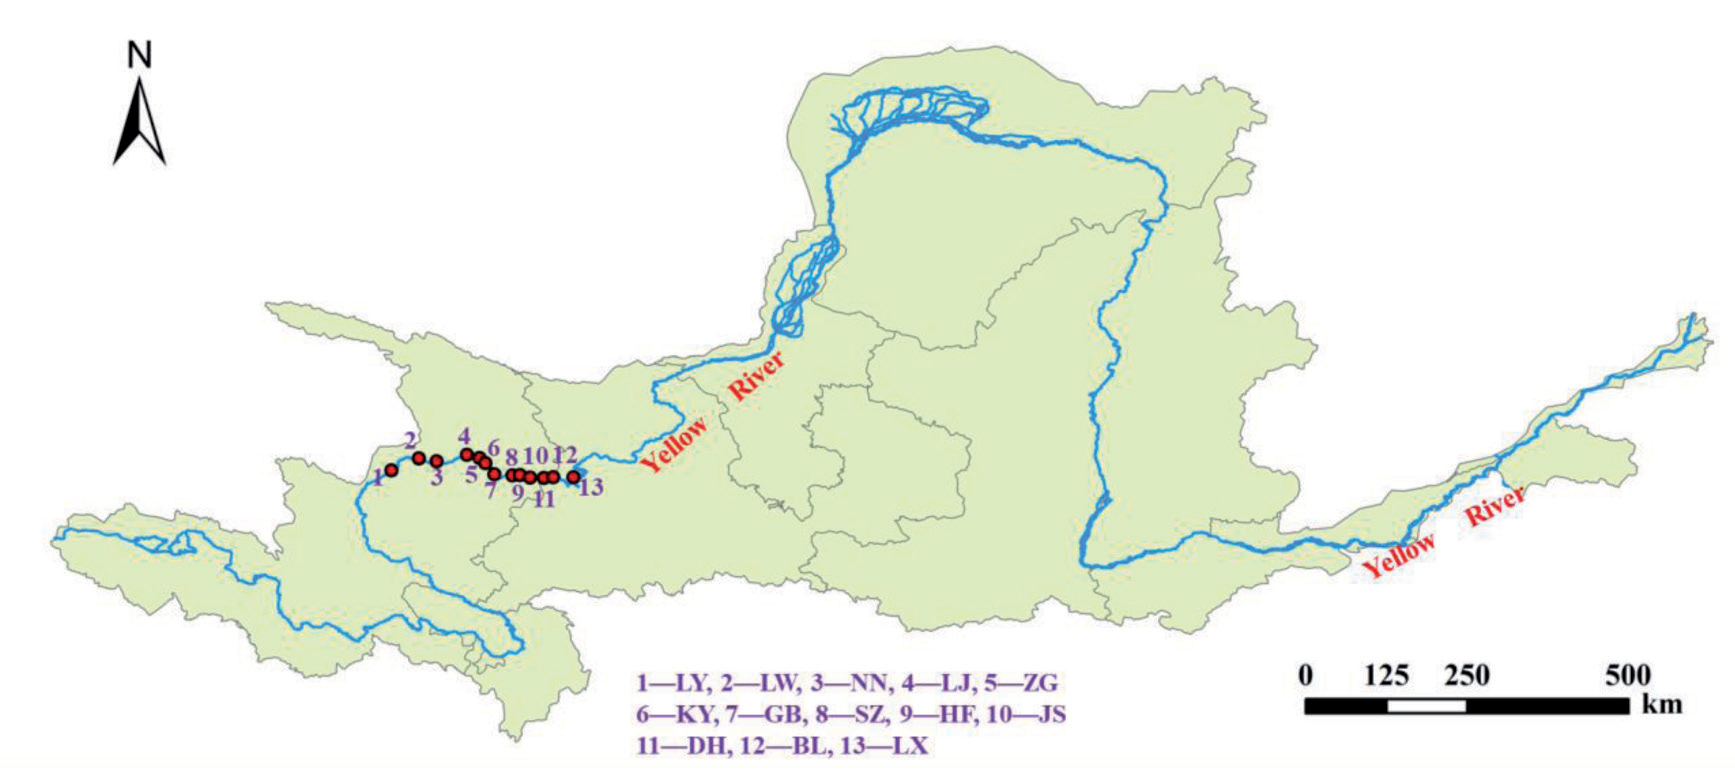
Table 1.
Overview of reservoirs from Longyangxia to Liujiaxia section
To evaluate these impacts, survey areas were established in 13 reservoirs along this river segment from June to September 2019. These reservoirs include Longyangxia (LY), Laxiwa (LW), Nina (NN), Lijiaxia (LJ), Zhiganglaka (ZG), Kangyang (KY), Gongboxia (GB), Suzhi (SZ), Huangfeng (HF), Jishixia (JS), Dahejia (DH), Bingling (BL), and Liujiaxia (LX), as shown in Figure 1 and Table 1. In the surveyed reservoirs, pH ranged from 7.9 to 8.6, indicating slightly alkaline conditions with minimal variation between sites. Moreover, dissolved oxygen levels varied from 7.2 to 12.6 mg/L, suggesting high oxygenation across all sections. In terms of water temperature, there was a significant variation, with the lowest recorded in Dahejia Reservoir at 6.5°C and the highest in Lijiaxia Reservoir at 18.4°C. Additionally, the riverbed was primarily composed of silt and gravel. The main aim of this study was to assess river ecological conditions by monitoring the composition and changes in the communities of fish and benthic macroinvertebrates.
Sample Collection and Analysis
Based on the specific conditions at the sampling sites, benthic macroinvertebrates were collected using either a Petersen grab sampler or a hand net. The collected samples were first filtered through a sieve on-site. Then, the macroinvertebrates were carefully picked out and preserved in 10% formalin. These samples were meticulously transported to the laboratory for detailed identification, counting, and weighing. The identification process was conducted at the most precise level possible, typically to the genus or species level. All organisms were systematically counted, and their biomass was measured accurately using an electronic balance with a precision of 0.0001. The biomass measurements of all samples were then converted to a per unit area basis [20, 21].
The fish survey primarily employed comprehensive field investigation methods and meticulous data collection techniques. These included on-site surveys, gathering detailed statistical data from fisheries management departments, and compiling extensive local records. Field investigations of fish utilized tools like gill nets and scoop nets to efficiently collect fish samples. Additionally, catches from local fishermen were gathered to gain a deeper understanding of the status of fish resources [22, 23]. All collected specimens were identified to the species level, following taxonomic monographs [24].
Development of the Index of Biotic Integrity
Benthic Index of Biotic Integrity
The development of the B-IBI primarily involved selecting reference sites, screening candidate metrics, and calculating index scores. In the process of selecting reference sites, the ideal approach would have been to choose locations free from human disturbance. However, due to the near-extinction of natural river segments in the study area, five reservoirs with relatively less disturbance, namely LY, LW, NN, LJ, and ZG, were selected as reference sites based on practical survey conditions. The remaining eight reservoirs were considered impacted sites. Taking into account regional characteristics, 19 sensitive metrics were selected as candidate parameters, divided into four categories: Diversity, Composition, Tolerance, and Function (Table 2). These parameters were aimed at reflecting the impact of human activities on the structure and function of benthic communities. The final selection of candidate metrics was determined through rigorous analyses, including interference response, discriminative ability, and correlation analysis [25]. Each evaluation metric was scored using a ratio method, with scores ranging from 0 to 1. The cumulative value of these metrics constituted the IBI value. The B-IBI index value was then obtained by summing the scores of each assessment parameter [25, 26]. The B-IBI values of the reference sites were ranked from high to low, and the 25th percentile value was selected as the optimal expected value, assigning the B-IBI index a score of 100.
Table 2.
Candidate biological parameters for B-IBI
In this formula, B-IBI represents the current monitoring value of the Benthic Index of Biotic Integrity for the evaluated river section. B-BIBO was the expected value of the river’s original B-IBI, and B-IBIS referred to the scoring of the B-IBI for the assessed section. Based on this formula, the B-IBIS values for each section of the river were calculated.
Fish Stocking Index
The assessment of biotic integrity in rivers was conducted using the fish stocking index (FSI) method. This index evaluated the disparity between the current and historical reference numbers of native fish species within the river, serving as an indicator of the loss of top predator species in the river ecosystem. The historical background for fish species was based on surveys from the 1980s, which were used as a baseline to determine the number of native fish species in the upper Yellow River above the Liujiaxia Dam during that period. Employing data from recent surveys and monitoring, the number of native fish species and the FSI were calculated for different sections of the reservoir. The Fish Stock Index was scored out of a total of 100.
In this formula, FCS represents the number of current native fish species, as determined from recent surveys. FOS referred to the original number of native fish species, based on counts from assessments conducted before the 1980s. FSI, the Fish Stocking Index, was utilized to assess the condition of fish species loss.
Biotic Integrity Assessment
The biotic integrity score for the studied river section was determined based on the assigned scores of the B-IBIS and FSI indices. The lower score of these two assessment indices was used as the biotic integrity score. The B-IBIS was assigned a score of 100.
In this formula, IBIS represents the final score for the river’s biotic integrity. The scoring range from 0 to 100 was divided into five evaluation levels: 80-100 was classified as healthy, 60-80 as sub-healthy, 40-60 as common, 20-40 as poor, and 0-20 as very poor.
Results and Discussion
Composition and Distribution of Benthic Macroinvertebrates
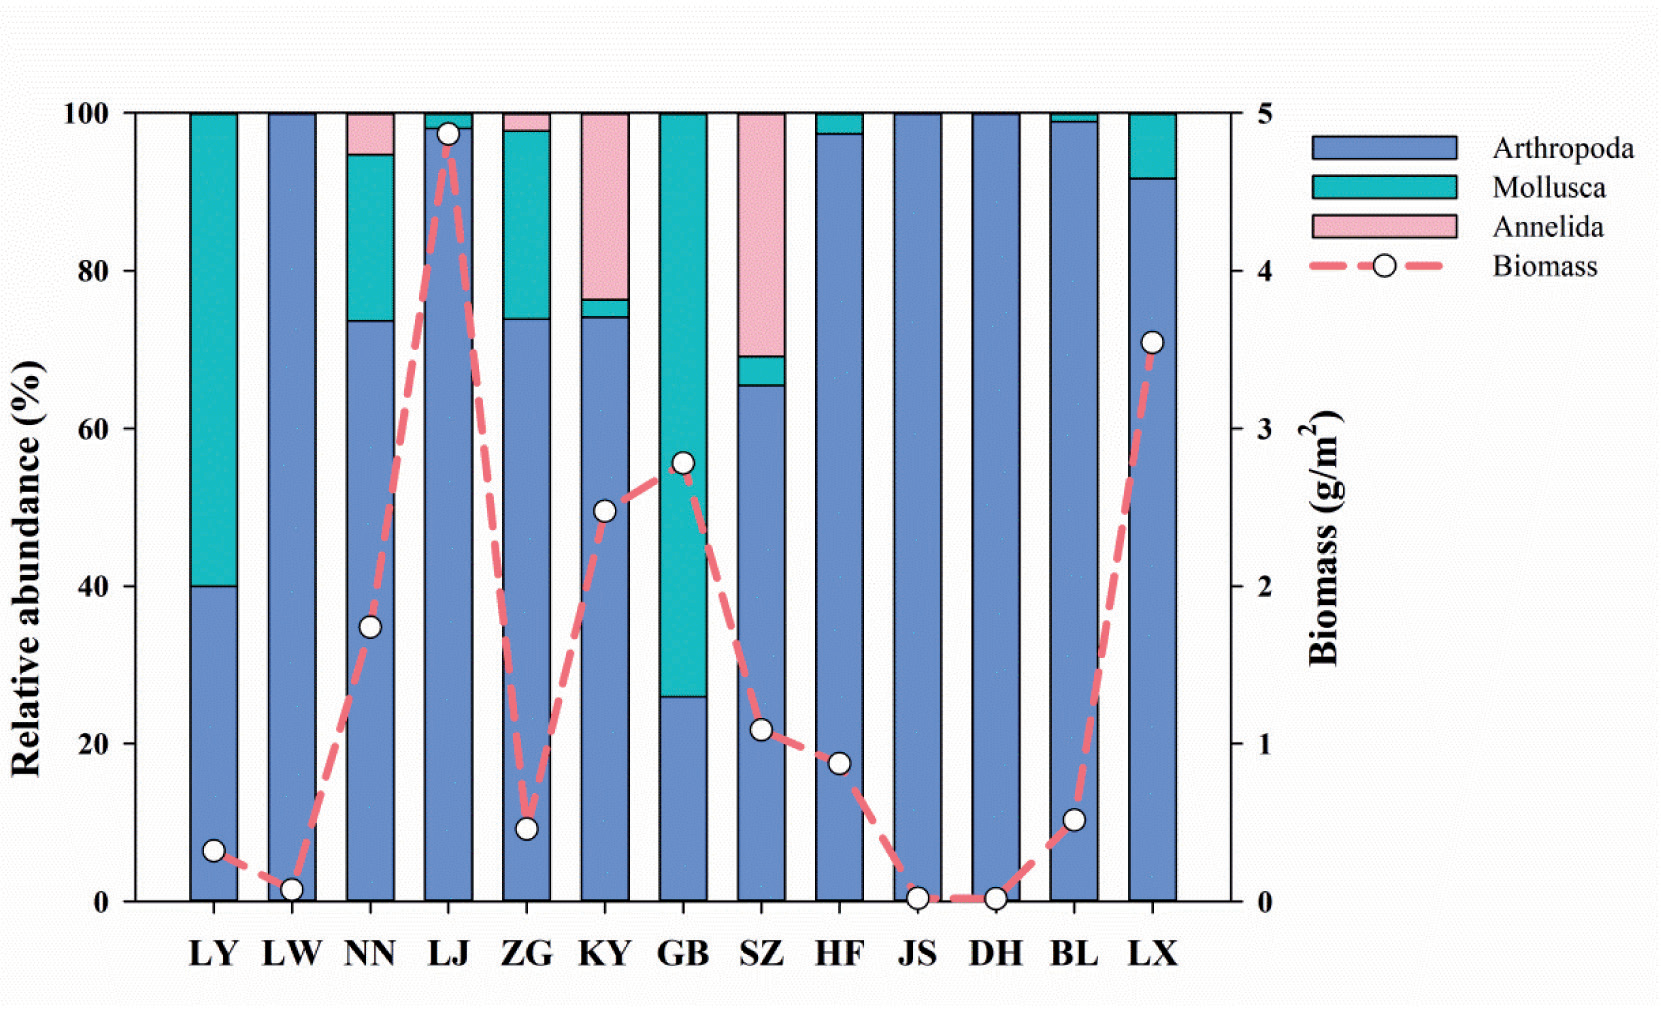
Spanning the Longyangxia to Liujiaxia river segment, we identified 54 benthic species across 3 phyla and 18 families. The Arthropoda phylum dominated with 12 families and 43 species, contributing 79.92% to the relative abundance. Key species included Gammarus sp. and Palaemon modestus. Mollusca, with 5 families and 9 species, represented 15.3% of the relative abundance, with Radix swinhoei and Galba pervia as prevalent species. Annelida, comprising 1 family with 2 species, accounted for 4.78% of the relative abundance, predominantly Limnodrilus sp. The average macroinvertebrate abundance was 51.84 ind./m², with a mean biomass of 1.44g/m². As shown in Figure 2, the Lijiaxia Reservoir exhibited the highest biomass at 4.87 g/m², primarily attributed to the abundance of Palaemon modestus. Conversely, the Laxiwa Reservoir demonstrated the lowest biomass, at a mere 0.072 g/m², characterized by a composition exclusively of Arthropoda, with Gammarus sp. and Cryptochironomus sp. being especially prominent.
Historically, surveys of benthic macroinvertebrates in the Yellow River, especially in its upper reaches, have been limited. The first systematic study was conducted as part of the Yellow River Fisheries Biological Resources Survey in 1958. According to the survey report [27], macroinvertebrates in the Yellow River mainstream were sparse, with an average biomass of less than 0.3 g/m² in the upper regions, predominantly comprising Chironomid larvae. This was mainly attributed to the turbid waters and significant gradient of the mainstream, rendering it unsuitable for bivalves and gastropods. Additionally, low plankton biomass in the water and substrates primarily composed of sediment and gravel, lacking in organic matter (humus), significantly impacts the diversity and abundance of benthic macroinvertebrates [28, 29]. Post-1980s, the Fisheries Survey in the Yellow River system identified 167 benthic species (69 of which were Chironomid larvae). Notably, a survey in the Liujiaxia Reservoir indicated a total biomass of 0.41 g/m², with Chironomid larvae dominating (accounting for 83% of the total biomass) [29]. In a 2008 survey in the Yellow River mainstream, a total of 64 macroinvertebrate species were collected. Tubificid accounted for 29.5% of the total number, while Palaemon modestus comprised 30.1% of the total biomass. In the Liujiaxia Reservoir, 17 species were recorded, averaging 648 ind./m² in number and 3.38 g/m² in biomass [20, 30]. These surveys reveal a diversification in the dominant species in the upper Yellow River in recent years, transitioning from Chironomid larvae dominance to a variety that includes Gammarus sp., Palaemon modestus, Radix swinhoei, and Limnodrilus sp., among others. The results from the late 1950s and 1980s indicated low levels of macroinvertebrate abundance and density. The 2008 survey showed a higher biomass proportion of Palaemon modestus, although Oligochaetes, especially Tubificids, remained the predominant species in terms of numbers. This study showed that species like Gammarus sp. and Palaemon modestus have become the primary dominant species, both in terms of number and biomass. This indicates that anthropogenic activities such as aquaculture and dam construction have gradually altered the dominant benthic faunal groups in the upper Yellow River.
With the increase in human activities, the community and abundance of macroinvertebrates have been significantly affected [31], and there are also notable variations in composition among regions with varying pollution levels [32]. For instance, in the mountain rivers of southern Poland, taxa considered indicators of clean water, such as Ephemeroptera, Plecoptera, and Trichoptera, were abundant and diverse. Conversely, in the heavily polluted upland rivers, taxa such as Oligochaeta, Chironomidae, Gastropoda, and Hirudinea dominate, resulting in a significant change in the composition of benthic macroinvertebrates [33]. Sensitive benthic taxa such as Ephemeroptera, Plecoptera, Trichoptera, and Odonatataxa have also demonstrated robust indicator capabilities in distinguishing disturbance gradients [13]. On the other hand, climate-induced changes in hydrological conditions may significantly impact the community structure and functional characteristics of macroinvertebrates [34]. Therefore, in assessing the B-IB, it is necessary not only to consider native species but also to focus on the presence of environmentally sensitive groups.
Fish Composition and Distribution
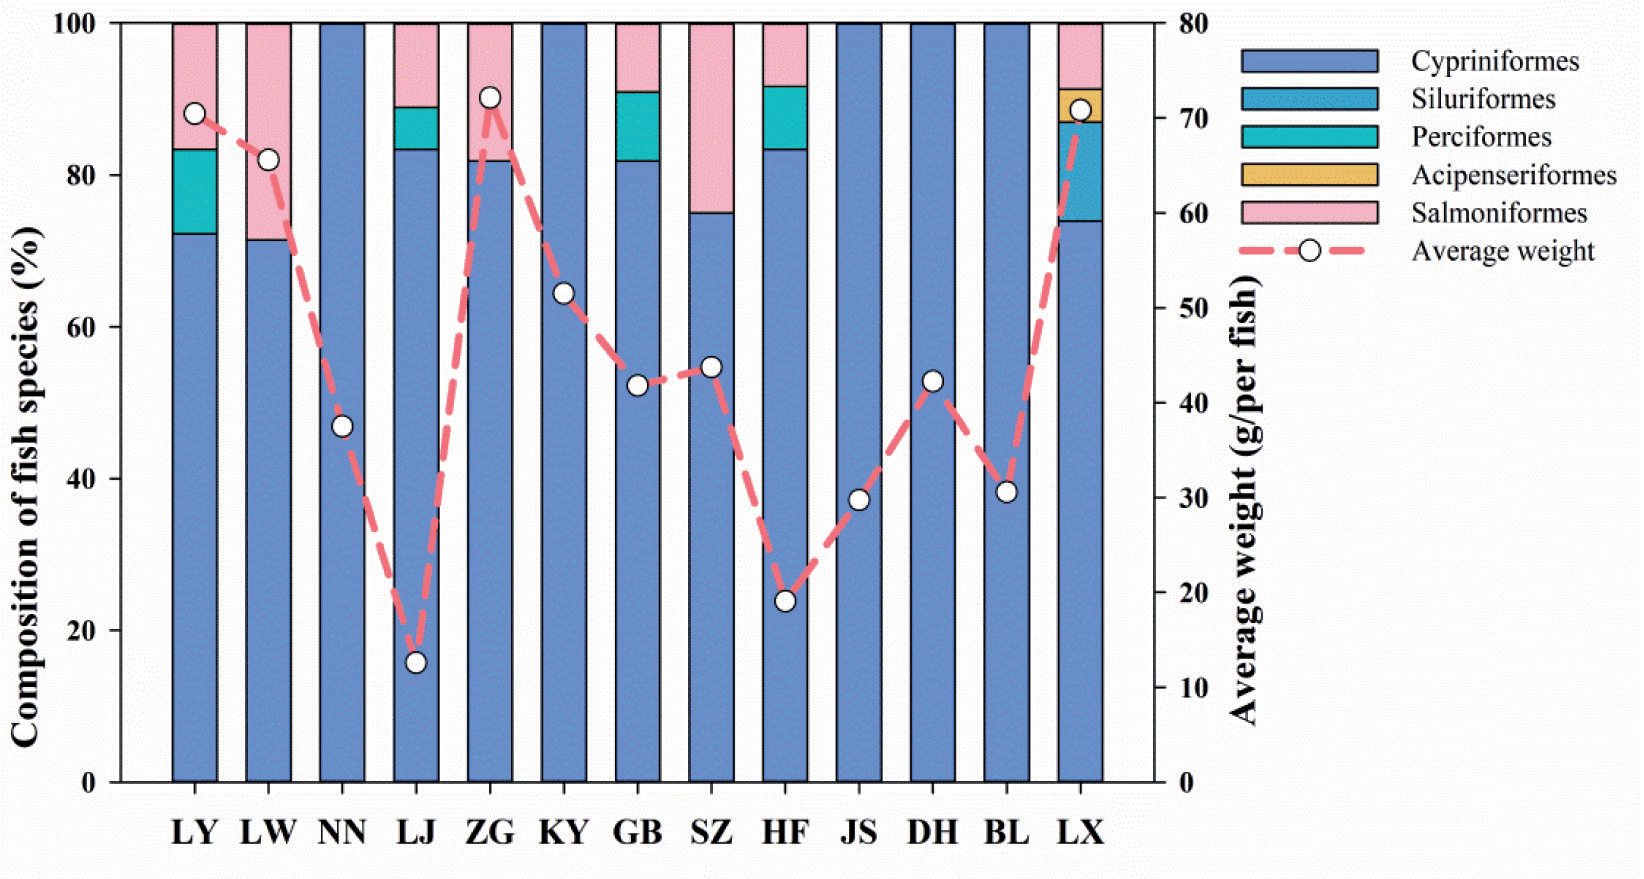
In this survey, a total of 2,425 fish were captured in the Yellow River, averaging 43.27g in weight, spanning 5 orders and 39 species. The Cypriniformes were predominant with 27 species, followed by Siluriformes and Perciformes, each with 3 species, Acipenseriformes with 1 species, and Salmoniformes with 5 species (Figure 3). The primary fish species captured in this study were Gymnocypris pylzovi, Pseudorasbora parva, and Triplophysa pappenheimi. Gymnocypris pylzovi constituted 22.97% of the total weight and 22.27% of the total number. Although Oncorhynchus mykiss only accounted for 1.49% of the total number, it represented the highest biomass proportion, at 26.43%. Spatially, the Liujiaxia Reservoir had the greatest diversity with 23 species, followed by the Longyangxia and Lijiaxia sections with 18 species each, while the Dahojia Reservoir had the fewest at 4 species. In terms of catch weight, Longyangxia recorded the highest at 25,146.27g, and Huangfeng Reservoir the lowest at 1,999.51g. The highest catch number was observed in the Lijiaxia section with 439 fish, and the lowest in Zhiganglaka with 67 fish. In terms of average fish body length, it varied from 6.95 to 15.79 cm, with an upward trend from the upper to the lower sections of the river. The Longyangxia Reservoir, with an average of 8.37 cm, had the smallest average size. The number of fish species, their weight, and their body length can reflect the survival status and functional characteristics of the fish. Our results showed that although the uppermost reservoirs, like Longyangxia, have higher diversity and weight in fish species, the smaller body size indicates that the impacts of barriers and resource limitations are still significant. These findings provide valuable insights into the fish diversity and distribution in the study area, contributing to our understanding of the aquatic ecosystem’s health.
In the 1950s, a survey of the Yellow River section above the Liujiaxia Dam identified 8 species of fish belonging to 2 families. However, due to the limitations of the survey conditions at that time, the diversity of fish species was relatively low [27]. By the 1980s, the number of fish species in this river section had increased to 26, across 3 families [29]. The native fish in the Yellow River above the Liujiaxia Dam are primarily composed of a composite of Central Asian high-mountain, late Tertiary, early period, North China Plain, and Chinese river plain faunal assemblages, exhibiting significant spatial variations in distribution. In the area above the Longyangxia Dam, the assemblage is dominated by Schizothoracinae and Noemacheilinae subfamily fishes representing the Central Asian high-mountain complex, whereas downstream, from Longyangxia to Liujiaxia, it includes the North China Plain and Chinese river plain complexes. However, between 1965 and 2015, due to anthropogenic disturbances such as dam construction, exotic fish invasions, and reduced flow, the structure of the Yellow River fish community underwent significant changes. The number of non-native species increased while native species decreased, leading to a 35.4% decline in fish species richness [35]. Additionally, introductions of non-native species through aquaculture and habitat destruction (Table 3), like Pseudorasbora parva and Misgurnus anguillicaudatus, cause a reduction in the diversity of native species and degradation of the biological integrity of the community [36]. Consequently, assessment of fish biotic integrity necessitates a focus on the shifts in native fish species, taking into account historical data to understand the changes.
Table 3.
Fish composition in the section of the Upper Yellow River above the Liujiaxia Dam
Biotic Integrity Assessment
Biotic integrity is the result of long-term evolution, enabling organisms to adapt to external environments. It denotes the stability of biotic communities in accordance with regional natural habitats [37]. Some scholars initially conducted assessments of the aquatic ecosystem of the Yellow River based on the IBI. For example, Li and Li (2023) established a planktonic index of biotic integrity that includes phytoplankton and zooplankton to assess the ecological health of the Qin River, a major tributary of the Yellow River [38]. Wu et al. (2020) assessed the aquatic ecosystem of the Weihe River basin, the largest tributary of the Yellow River, based on the integrity index of fish and benthic macroinvertebrate [39]. In this study, we established the benthic index of biotic integrity and the fish stocking index and conducted a comprehensive assessment of river ecosystem conditions.
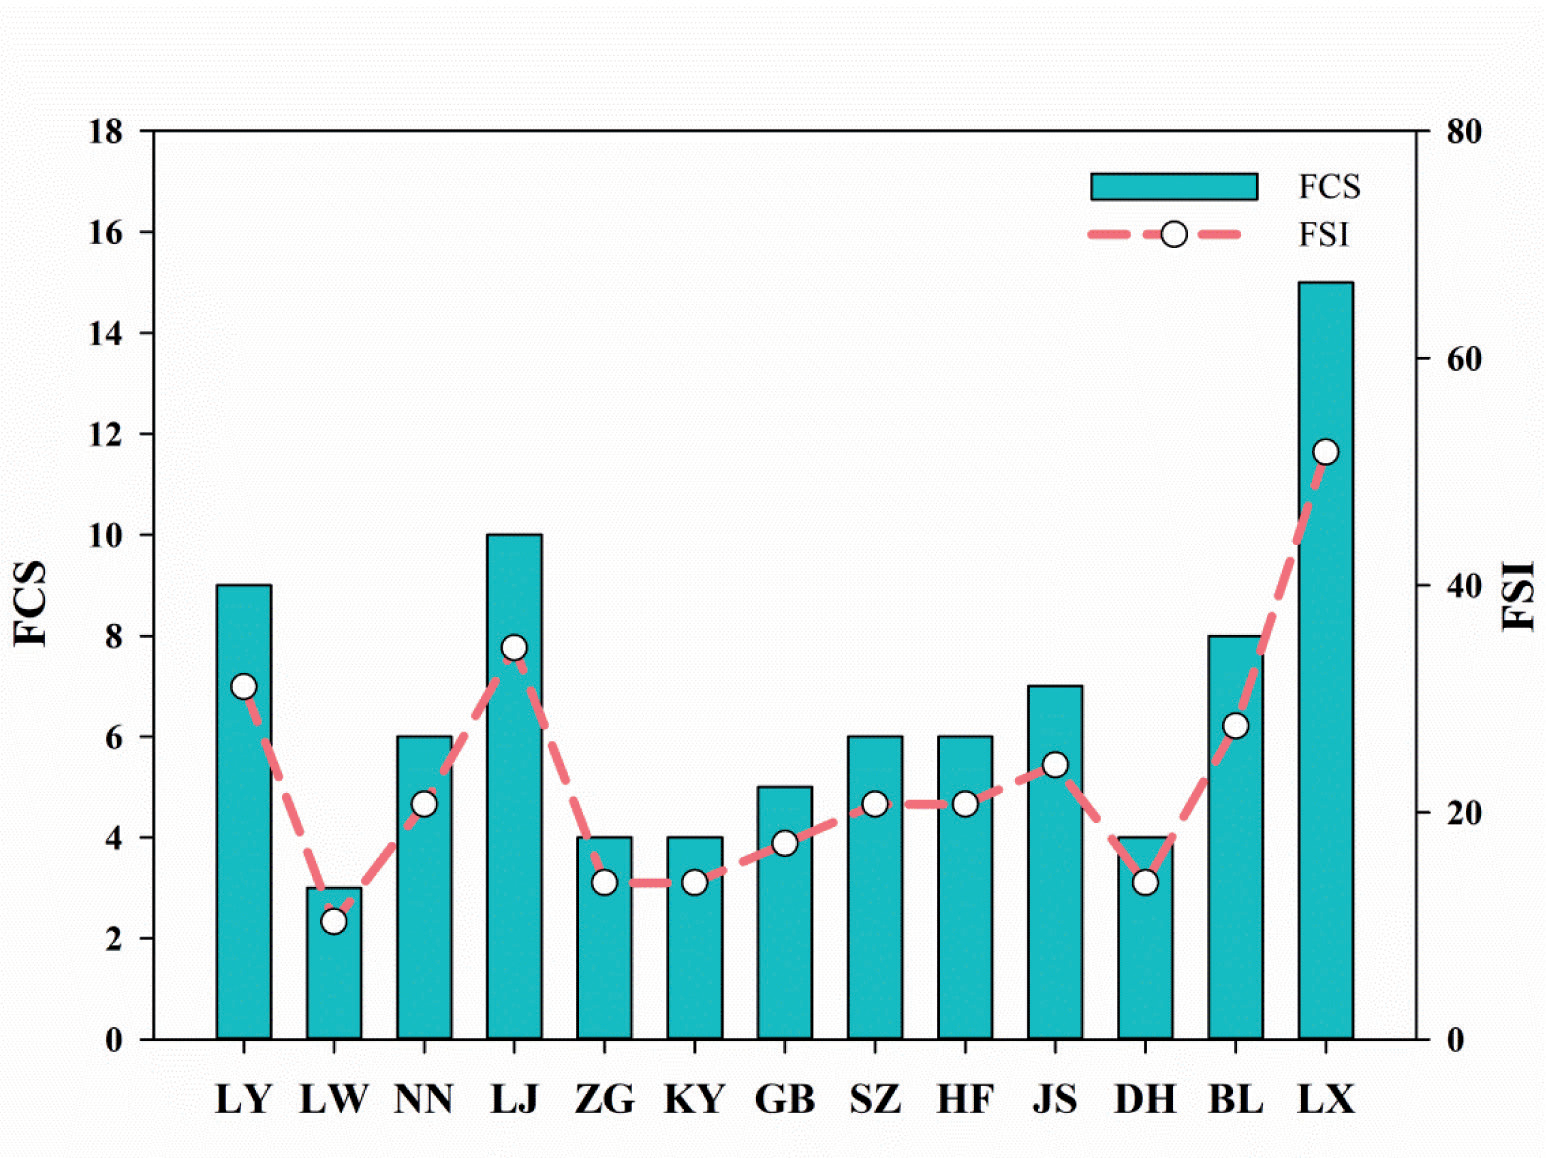
Through the screening process involving interference response, discriminative ability, and correlation analysis, five key metrics were ultimately identified for the establishment of B-IBI: total taxon number (M1), relative abundance of the highest dominant taxa (M6), relative abundance of Oligochaetes (M10), Relative abundance of Crustacean and Mollusk (M13), and relative abundance of sensitive taxa (M16) (Table 4). The scoring standards were set using a ratio method, with the desired Biotic Integrity Index (B-IBI) for minimal human disturbance pegged at 2.56. The B-IBIS varied from 41 to 100, averaging 78. Spatially, reservoir zones like LY, LW, NN, LJ, ZG, SZ, HF, and JS were less disturbed, while DH and BL exhibited lower biotic integrity. The FSI measures the difference between the current and historical numbers of native fish species in river segments, reflecting apex species loss post-watershed development. This study identified 39 fish species in the upper Yellow River, a decrease of 17 species since the pre-1980s, offset by the addition of 22 new species, including three native plateau species: Triplophysa dalaicus, Triplophysa angeli, and Triplophysa stenura (Table 3). Consequently, the historical baseline value for FOS in the upper Yellow River was adjusted to 29, with the current number of native fish species being 20, resulting in an FSI score of 69. Geographically, only the LJ and LX reservoirs harbor more than ten native fish species, while the native fish species in the LW, ZG, KY, and DH reservoirs are less than five each. Examining the FSI scores across different reservoirs reveals that only LJ exceeds an FSI of 50, with others falling below 40, indicating a significant loss of native fish species in the upper reaches of the Yellow River.
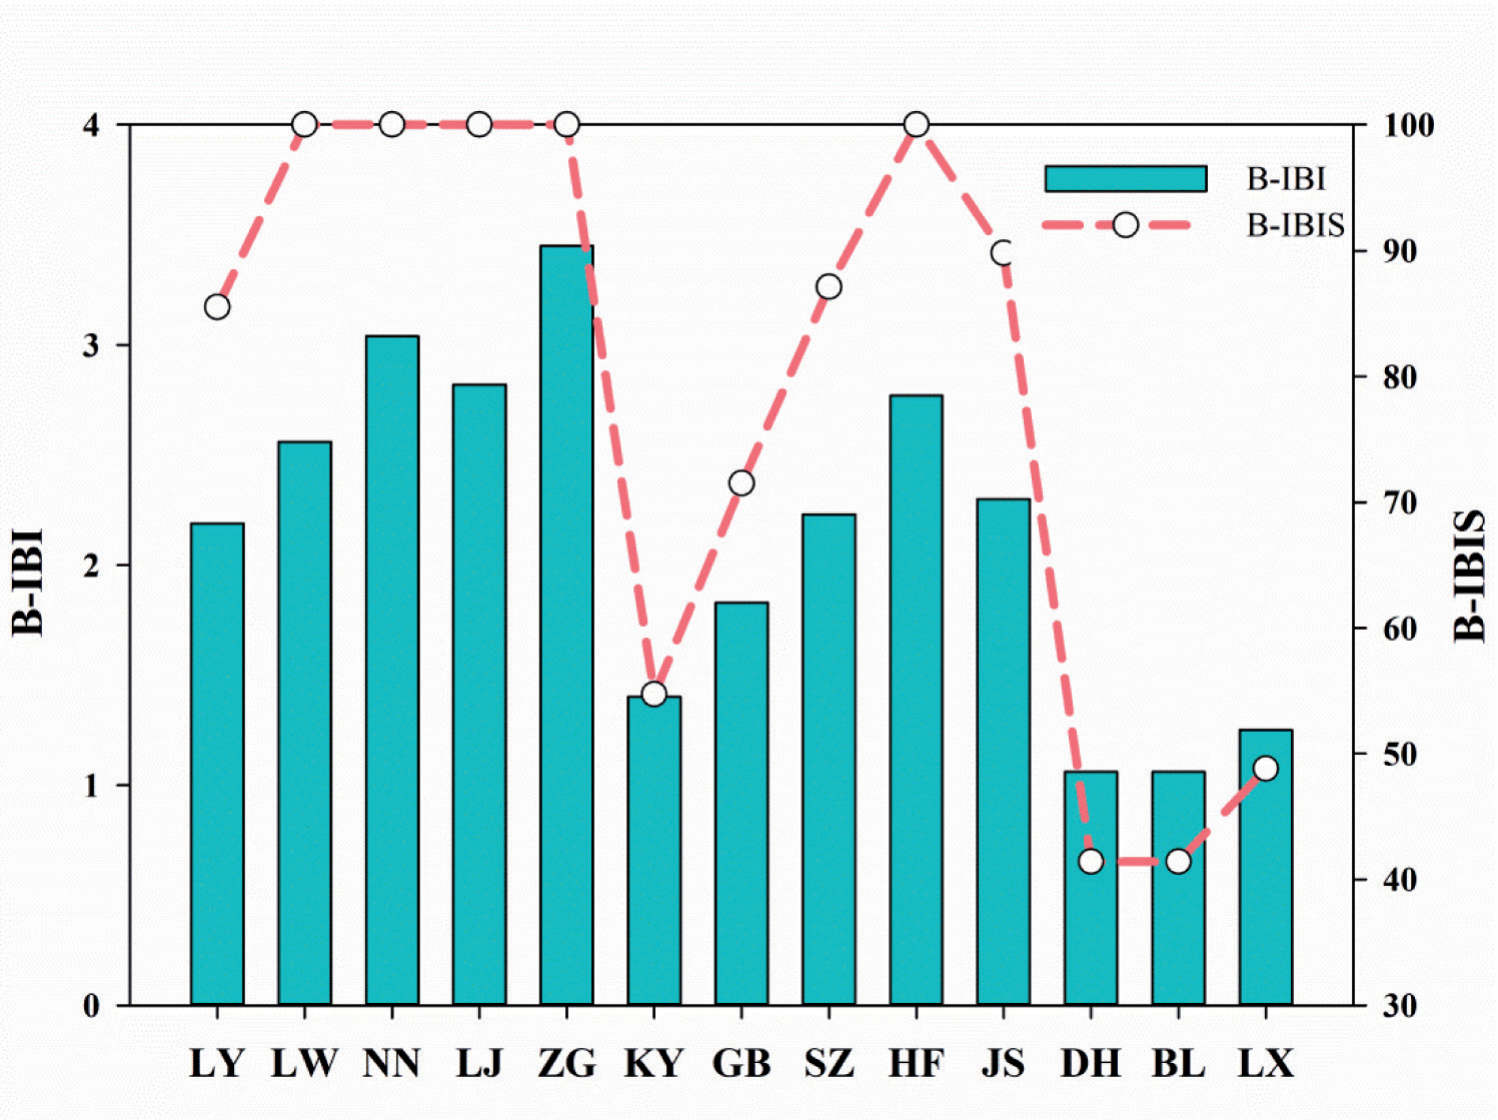
Table 4.
Results of candidate parameter selection
The fish index of biotic integrity can effectively identify the impact of reservoir cascades on fish communities [40]. In the Qin River, biotic integrity assessments based on benthic macroinvertebrates yielded better results than those based on fish [39]. By incorporating both the B-IBIS and FSI, the comprehensive IBIS score for the Longyangxia to Liujiaxia section of the Yellow River stands at 69. This score denotes a ‘Common’ level of biotic integrity, significantly influenced by human activities. Notably, the upper reaches of the river (near Longyangxia Dam) exhibit higher B-IBIS scores, in contrast to the lower reaches (near Liujiaxia Dam). Conversely, the FSI is lowest in the upper reaches, particularly in the Laxiwa Reservoir, and highest in the Liujiaxia Reservoir. These disparities likely stem from specific details of the surveys and the different biological communities involved. Utilizing both B-IBIS and FSI in tandem effectively circumvents potential biases arising from reliance on a single biological group for assessments of biotic integrity. Overall, regions such as LW, ZG, KY, and DH show relatively lower levels of biotic integrity (Figure 4 and Figure 5), primarily due to the decline in native fish species. Anthropogenic interventions, including dam construction and the introduction of exotic species, have exacerbated ecological changes, particularly the impact of invasive fish species on native populations. With the intensification of global warming and increased human activity, these impacts may further exacerbate [41].
A recent survey study across 45 countries on six continents revealed that 21% of macroinvertebrate sites and 29% of fish sites were severely impaired. Among these, dam and reservoir construction were identified as the primary causes [18]. Dams alter river morphology, material transport, and riparian vegetation, thereby changing river habitats, impeding fish migration, and leading to the displacement of aquatic organisms like macroinvertebrates [42, 43]. Additionally, river network fragmentation, changes in hydrological regimes, degradation of floodplains, and invasive non-native species have further contributed to the decline in diversity of fish and benthic macroinvertebrates [44, 45]. Preserving environmental heterogeneity and the natural connectivity of rivers should be effective measures for conserving regional biodiversity [46]. As a result, future efforts in river ecological conservation should focus more on evaluating the survival status and habitat changes of diverse representative native species, which would aid in developing more targeted conservation strategies and ecological restoration plans.
Conclusions
Our findings indicate that human activities, such as hydropower development, have had a significant impact on the biodiversity of the upper reaches of the Yellow River. Specifically, the shift in dominance of macroinvertebrates to species like Gammarus sp., along with the decline in the richness of native fish species, demonstrates major changes in the ecosystem. The average scores of B-IBI and FSI reflect a ‘Common’ level of biotic integrity, indicating substantial human impact, with particular concern needed for the loss of native fish species and the invasion of alien species. This study highlights the urgency of implementing comprehensive conservation measures that address not only the biological aspects of river health but also habitat integrity to mitigate ecological degradation. Future assessments and strategies for ecological protection and restoration in the upper Yellow River must incorporate a broader range of environmental factors to ensure a holistic approach to maintaining the river’s health.

