

Introduction
In recent years, the global community has grappled with the pressing challenges of climate change and escalating global warming [1, 2]. These phenomena, resulting primarily from human activities, have led to the release of a multitude of greenhouse gases, including carbon dioxide (CO2), methane (CH4), nitrogen oxides (NOx), chlorofluorocarbons (CFCs), and sulfur hexafluoride (SF6), profoundly amplifying the greenhouse effect [3]. Among these gases, CO2 emerges as a major protagonist, playing a pivotal role in the ongoing greenhouse effect [4]. Consequently, the Can Gio district, located in Vietnam, confronts a multifaceted threat encompassing deforestation, land-use alterations, and escalating carbon emissions due to rapid urbanization and industrialization [5].
Within this intricate ecological and climatic backdrop, the forests situated in the Can Gio district emerge as invaluable assets, intricately interwoven with the mitigation of climate change impacts. These forests, beyond their intrinsic ecological significance, function as pivotal carbon sinks, effectively sequestering substantial volumes of atmospheric CO2. As such, their preservation and judicious management assume paramount importance, not only in the context of carbon sequestration but also for the overarching sustainable development of the region [6].
In the broader international arena, global initiatives such as the Reducing Emissions from Deforestation and Forest Degradation (REDD+) program underscore the need for precise estimation of crucial forest metrics. These metrics, notably encompassing aboveground biomass (AGB) and forest carbon stocks, constitute the cornerstone for evaluating the Can Gio forest’s carbon sequestration potential, ascertaining carbon credits for emissions mitigation, and assessing the quantifiable benefits arising from its CO2 sequestration services [7]. Regrettably, conventional methodologies employed for monitoring AGB in the Can Gio district are inherently labor-intensive, costly, and constrained in scope [8]. While field-based inventories offer commendable accuracy, their implementation is marked by substantial time requirements and frequently poses challenges in the context of large-scale assessments. Consequently, a significant research void exists, underscoring the compelling necessity to explore and implement efficient, cost-effective methodologies for AGB estimation within this specific geographic domain.
Amidst this backdrop, remote sensing techniques emerge as a promising avenue to bridge this research lacuna. Leveraging data acquired from satellites and airborne sensors, remote sensing methodologies empower comprehensive, repeatable measurements over expansive geographical extents [9]. These techniques offer the capacity to indirectly estimate forest AGB by scrutinizing spectral data and vegetation indices intrinsically linked to biomass [8]. However, despite numerous endeavors dedicated to remote sensing-based AGB estimation in diverse global contexts, limited research has centered on the unique challenges posed by the Can Gio district’s specific context.
Consequently, this study assumes the crucial task of filling this research lacuna by methodically scrutinizing and synthesizing a spectrum of AGB estimation approaches predicated on remotely sensed data, with a specific focus on the Can Gio district. The primary objectives are twofold: firstly, to quantify the magnitude of CO2 absorption and biomass accumulation within the forested expanses of the Can Gio district, utilizing Over-The-Counter (OTC) plants as a comparative reference. This entails the development of an equation encapsulating the intricate relationship between biomass, CO2 absorption and the vegetation index derived from remote sensing data. Secondly, the study aims to engender a spatial map delineating dry biomass distribution and CO2 uptake across the Can Gio district’s forest plantations. These objectives align within the broader context of advancing our understanding of the region’s carbon dynamics, thereby facilitating informed, ecologically responsible management practices and contributing to the global discourse on climate change mitigation.
Methodology
Study Area
The data is collected in Can Gio District, Ho Chi Minh city, the characteristics of the area could be found in our previous study [5].
Biomass and CO2 Uptake Calculation
The methodology employed for estimating biomass and CO2 uptake adopted a comprehensive and rigorous approach called standard plotting method, comprising several steps. Initially, the study area was meticulously selected, focusing on the representative Can Gio plantation forest. To collect individual tree data, standardized Overstory Tree Crowns (OTCs) were thoughtfully established at strategic locations along the Rung Sac route. Within each OTC, precise measurements of trunk diameters were conducted at 1.3 meters above the ground, using a standardized 1.5-meter tape measure to ensure meticulous accuracy. The collected data were then utilized to estimate the Soil Carbon (SC) of trees within each OTC, with subsequent application of carbon sequestration coefficients to determine CO2 uptake in the sample plots.
Table 1.
Correlation formula for each plant species’ absorbed CO2 and dry biomass.
Biomass and Absorbed CO2 Calculation
The tree conservation approach was employed to compute the above-ground biomass and the CO2 uptake by the plants in the sample plot. This estimation was based on the growth correlation equation specific to each tree species listed in Table 1, incorporating the following parameters:
Image Preprocessing
Pham et al. (2019) [10] noted that terrestrial radiation from cosmic carriers can be affected by diffraction due to various factors such as tilt angle, sun height and atmospheric optical conditions like absorption and scattering. Hadjimitsis et al. (2010) [11] highlighted the significant impact of the atmosphere on the blackbody surface irradiance value. To address this, radiation correction was carried out during the image preprocessing stage, converting Digital Number (DN) values to actual values of radiation (B) with units of Wm-2m-1. This conversion was done using the provided default values of ML (unit conversion factor) and AL (deviation) from the metadata file of the Landsat 8 image product. To convert the numerical values of DN to surface reflectance values for Landsat 8 images, the following formula provided by the USGS was employed as Eq. (1).
This formula involves the unit conversion factor Mρ, numeric data of each pixel cell Qcal, reflection data deviation Aρ, and the sun elevation angle θSE.
Vegetation Index Calculation
To accurately estimate biomass and CO2 absorption, it is crucial to establish a robust correlation between the vegetation index derived from remote sensing imagery and the actual plant biomass obtained through ground-based survey measurements [12]. Our study employs two distinct methods for biomass calculation and estimation, which are elaborated below.
Normalized Difference Vegetation Index (NDVI), the NDVI is computed using the formula:
Where: RED denotes the reflectance value in the red spectrum channel; NIR represents the reflectance value in the near-infrared spectral channel.
The NDVI value ranges from -1 to +1, with higher values indicating denser vegetation cover, such as forests with a high density of trees and a closed canopy [13]. Mean NDVI values falling within the range of 0.2 to 0.3 are indicative of shrubs and lawns, while urban areas, bare land and water typically exhibit very low NDVI values (NDVI<0.1).
Ratio Vegetation Index (RVI):
The RVI index inversely correlates with vegetation density, with lower RVI ratios indicating higher vegetation cover [14]. The RVI is calculated using the formula:
By integrating both the NDVI and RVI methods, we can effectively account for regional variations and achieve more accurate estimations of biomass and CO2 absorption across diverse vegetation types and regions [12].
Table 2.
Correlation between soil carbon (SC), vegetative index and CO2 absorption.
Correlation Equations for Biomass, CO2 Absorption and Vegetation Index
Regression functions are constructed in Excel, utilizing vegetation index and SC values (representing CO2 absorption) obtained from field surveys within the OTCs [15].
Results and Discussion
Nexus between Vegetation Indices with Biomass and CO2 Absorption
Regarding the correlation equation results (Table 2), the quadratic equations consistently exhibit higher correlation values for both NDVI and RVI compared to linear equations. Specifically, the NDVI index shows a very high correlation with the biomass of planted forests (R2 value of 79.26%), while the RVI index exhibits a relatively lower correlation (R2 value of 41.22%). As a result, the Eq. (4) is selected as the biomass estimation equation for planted forests in Can Gio.
Similarly, the correlation between absorbed CO2 and plant indices (NDVI and RVI) also demonstrates significant associations (Table 2). Quadratic equations show higher correlation values, especially for the NDVI index (R2 value of 79.24%) corresponding to Eq. (5).
Mapping Biomass and CO2 Sequestration in the Forests
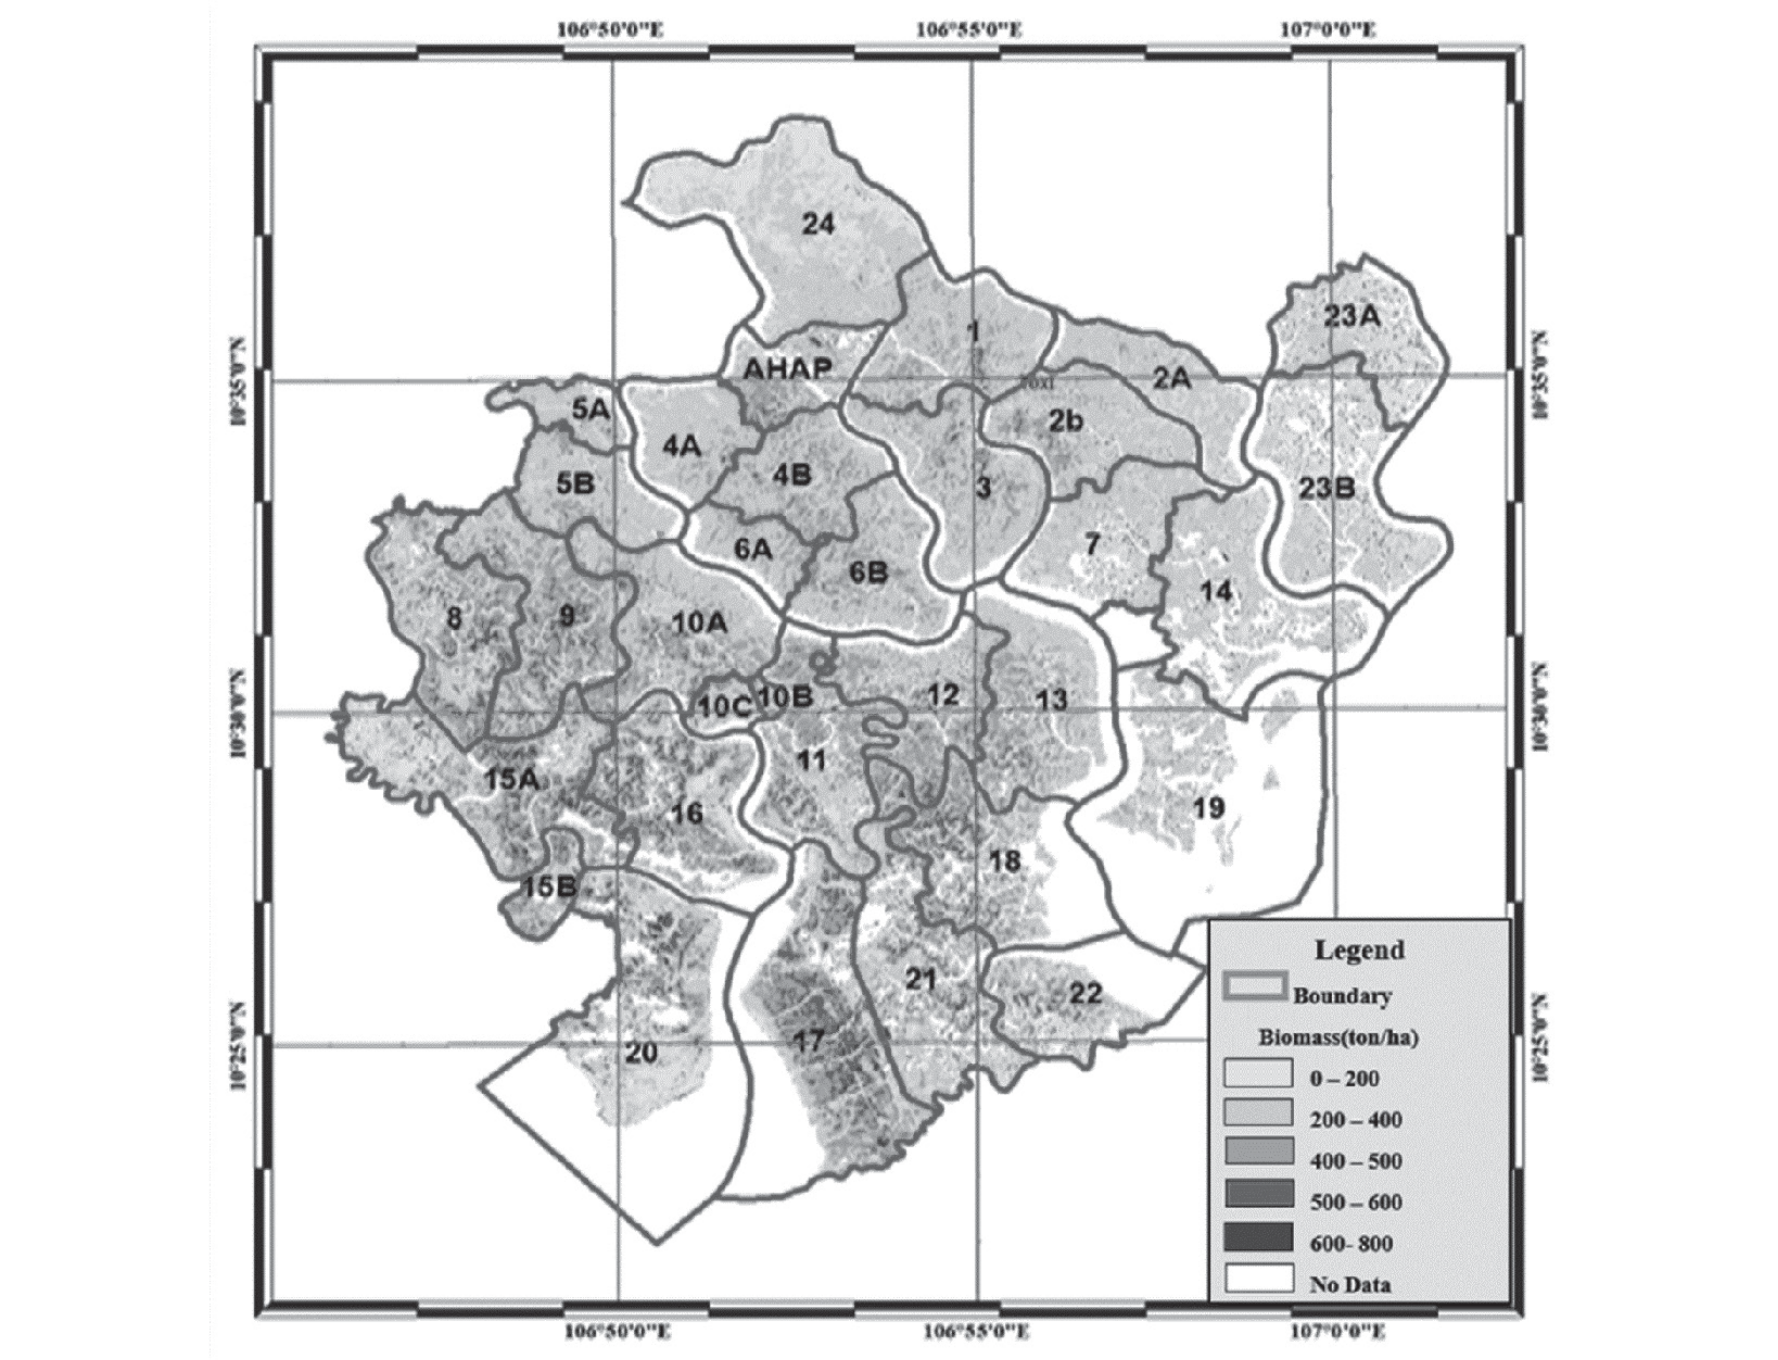
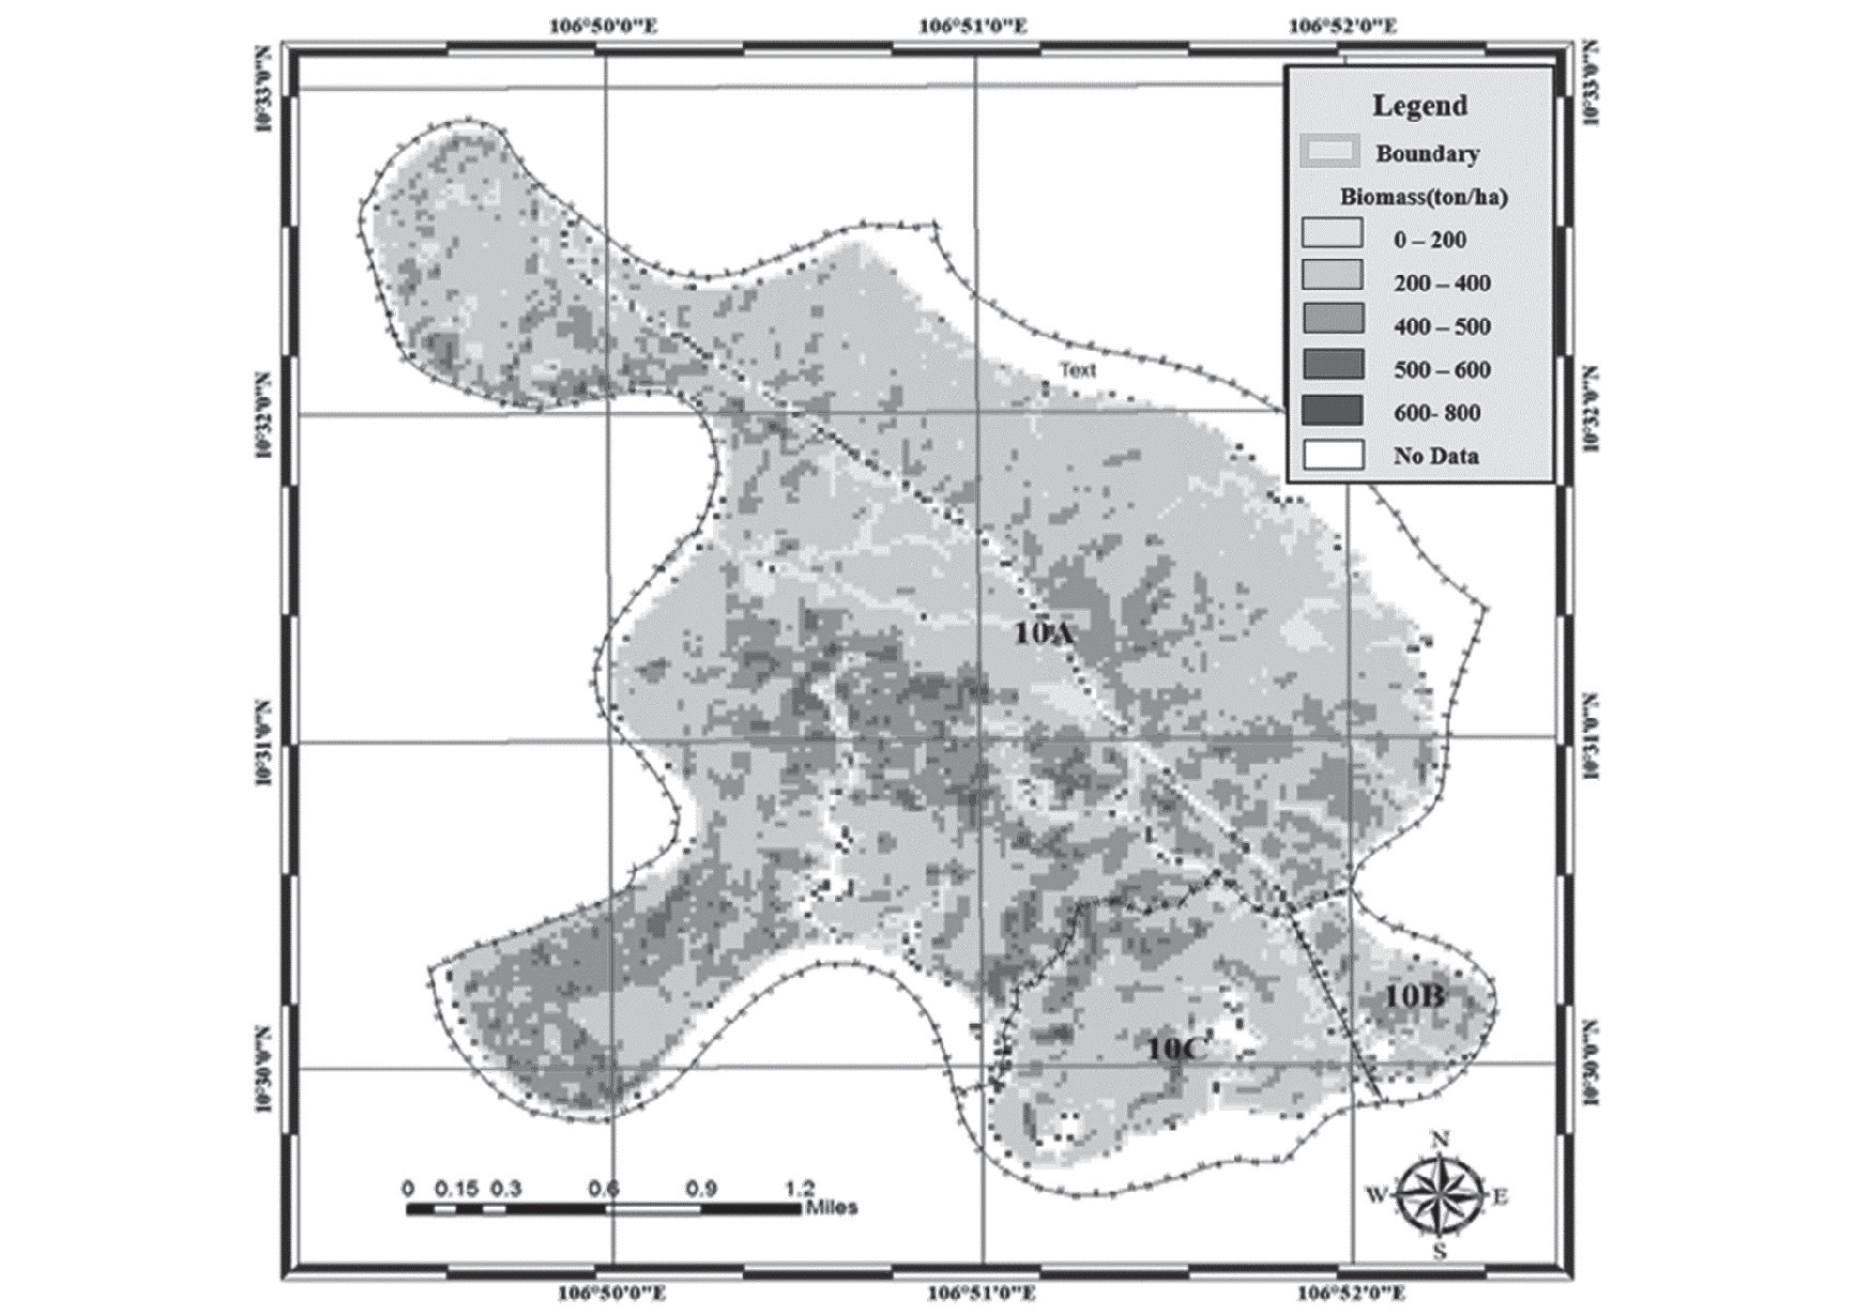
Utilizing the established correlation equation between biomass and NDVI, we generated a comprehensive biomass map covering all sub-zones within the Can Gio mangrove forest (Fig. 1). The map illustrates the distribution of biomass in different sub-zones, with varying density levels observed. Sub-zones 10B and 10C predominantly exhibit biomass levels ranging from 200 to 400 tons/ha, while Sub-area 10A showcases higher biomass density, ranging from 400 to 500 tons/ha, with certain locations exceeding 500 tons/ha. Notably, lower biomass levels are observed near the forest edge and roads, while biomass concentration is evident in the interior regions, particularly along water sources like canals (Fig. 2).
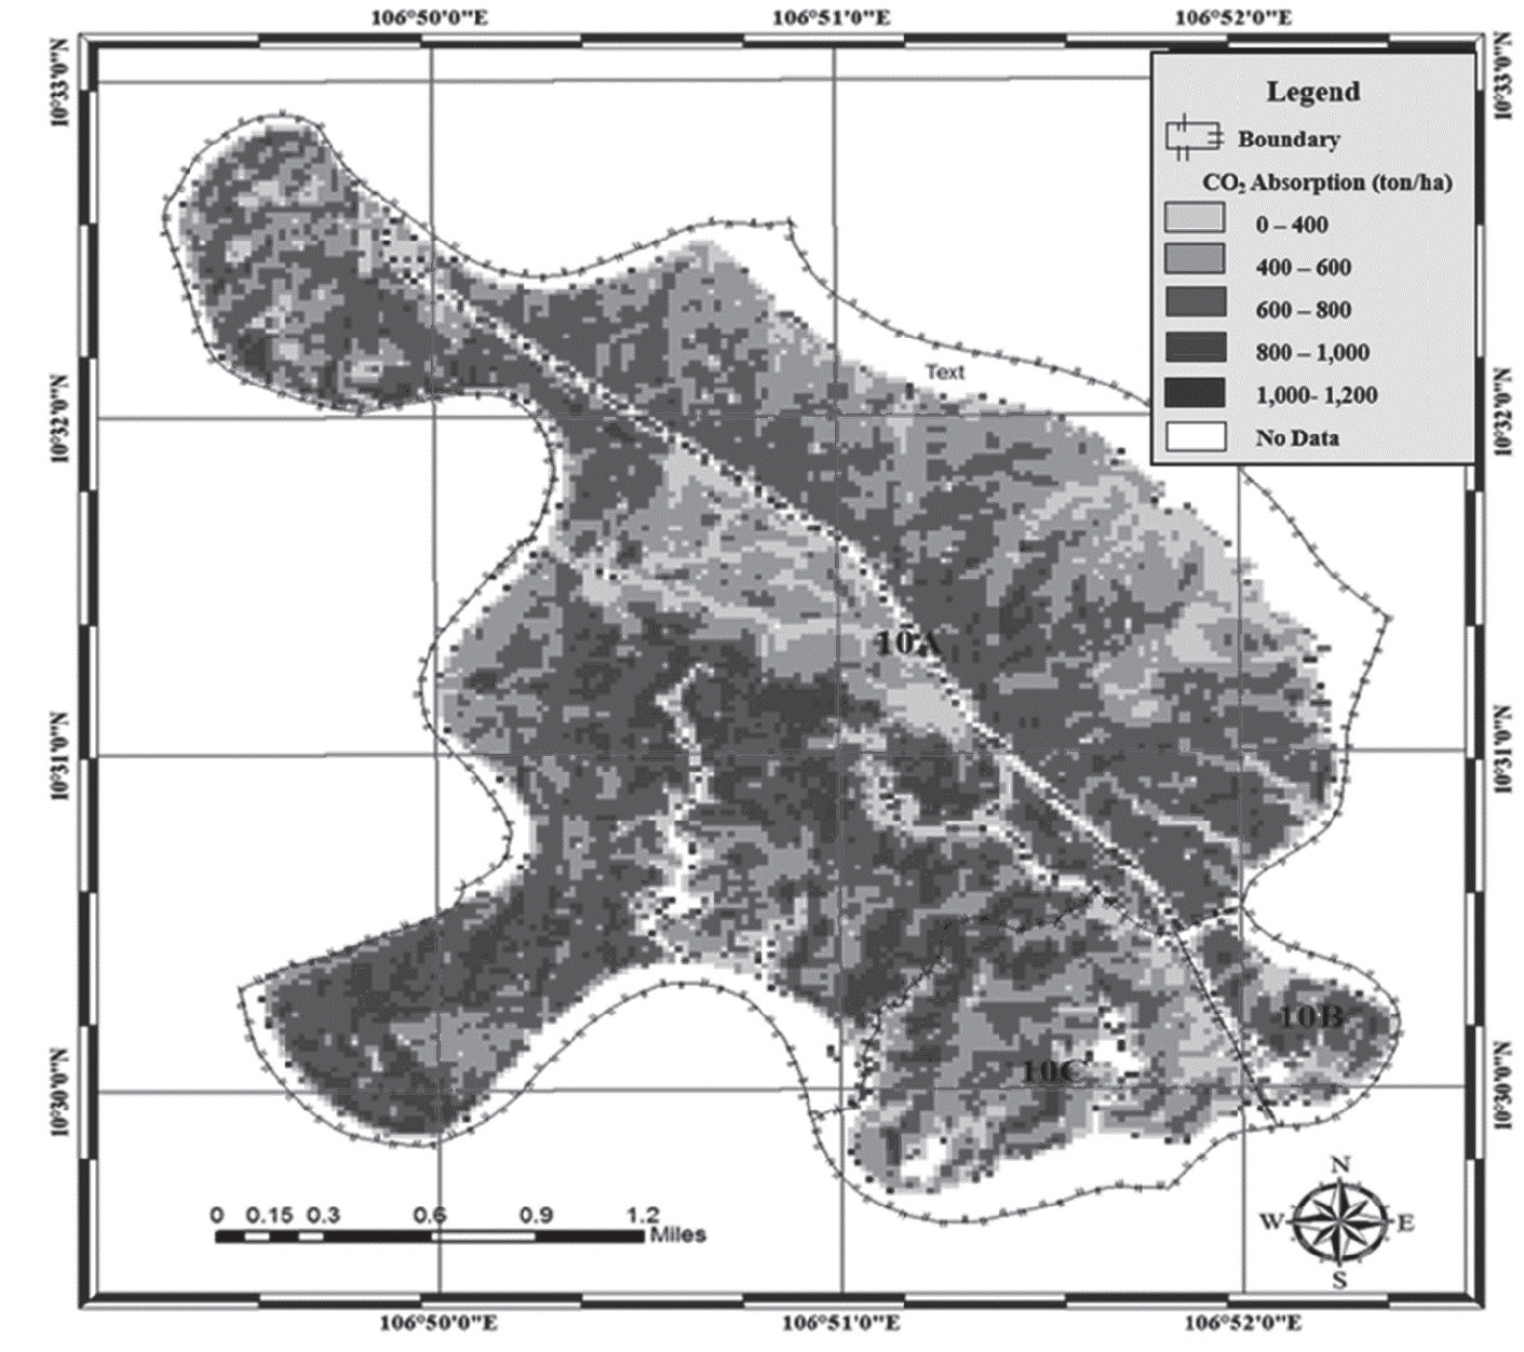
Furthermore, Fig. 3 displays the CO2 absorption levels across the sub-zones. Sub-zones 10B and 10C demonstrate CO2 absorption levels below 400 to 600 tons/ha, while sub-zone 10A exhibits multiple areas with CO2 absorption levels ranging from 600 to 800 tons/ha. As a result, the average CO2 absorption in sub-zone 10A surpasses that of sub-zones 10B and 10C, indicating variations in the forest’s carbon sequestration potential. By considering the average global carbon credit price $5 per metric ton of CO2 in Vietnam [16] and an exchange rate of 24,395 VND per USD, the estimated value of CO2 credits in sub-area 10A amounts to approximately 4397 USD/ha or around 110 million VND at the present time (26. 09. 2023), highlighting the economic significance of carbon sequestration in this forest ecosystem. These findings offer valuable insights for forest management strategies and climate change mitigation efforts in the Can Gio mangrove forest.
Conclusions
Among the plant indices used, the Normalized Difference Vegetation Index (NDVI) stands out with a higher correlation (R2 values of 79.26% for biomass and 79.24% for absorbed CO2) and meets the required criteria. Conversely, the Ratio Vegetation Index (RVI) exhibits only a moderate correlation with biomass and absorbed CO2, resulting in relatively lower and unsatisfactory outcomes (highest R-squared values of 41.22% for biomass and 41.18% for absorbed CO2). Moreover, the study has successfully developed and selected a correlation model between Soil Carbon (SC) and CO2 absorption using the NDVI vegetative index. The planted forests in the studied sub-zones showcase relatively high average biomass volume and CO2 absorption, with sub-area 10A being particularly notable, having a biomass volume of 419.87 tons/ha and a CO2 absorption of 879.4 tons/ha. Taking into account the prevailing global carbon credit prices, the calculated value of CO2 credits in sub-area 10A approximates 4397 USD per hectare or roughly 110 million VND at the current juncture. These findings carry significant implications for comprehending carbon sequestration dynamics and attributing value to carbon credits within forest ecosystems.

