

Introduction
The relationship between plant-available nutrients and soil properties in agricultural ecosystems is very crucial and has a significant impact on crop growth, yield, and soil health. [1-4]. Macronutrients, including nitrogen (N), phosphorus (P), and potassium (K), are vital for plant growth as they support processes such as photosynthesis, energy transmission, and structural development. [5]. They have more demand and influence the vigor and yield of crops. Micronutrients, including iron (Fe), zinc (Zn), and copper (Cu), are equally important in trace amounts because they support the health of plants by fostering optimum development, nutrient uptake, and enzyme function. [6]. Both macronutrients and micronutrients are very important for the health and productive plant environments. Salinity and acidity of the soil are designated by electrical conductivity (EC) and pH values, and these features affect nutrient availability and plant health [7]. Organic matter (OM) improves soil structure, water-holding ability, and microbial activity to promote growth [8]. These factors are needed to be balanced for maximum nutrient absorption and sustainable crop output. For precision agriculture, there is a need to find the relationship between soil properties and nutrients so that exact nutrient inputs can be made possible [9]. This relationship increases crop nutrient uptake, optimizes resource use, and increases yield. It can also enhance soil fertility control, which decreases nutrient loss and environmental degradation [10, 11]. The determination of soil’s nutrient status can help farmers to manage and sustain healthy ecosystems. It will also help farmers apply balanced, ecologically friendly fertilizers to get the benefits of the region’s diverse crop yields. Understanding the complex relationships between the nutrients that plants may access from the soil and other soil properties is also important for sustainable land use and better agricultural management [12]. This will finally help with environmental preservation and sustainable land use practices. The “Granary of Asia,” Punjab, Pakistan, is a very important agricultural center and plays a major role in the food security of the country [13]. Punjab has alkaline soils with low to medium levels of N, P, and K, as well as medium to high levels of all three [14]. The ideal level of OM for soils is 1.29%; however, Pakistani soils range from 0.52 to 1.38%, with the majority having less than 1%. The nutritional balance of the soil, however, might change over time as a result of continued agricultural practices and potential environmental degradation [15]. The main ways that nutrients reach the natural environment are through biological processes, atmospheric deposition, and soil parent material [16-18]. An area that is restricted and has high quantities of nutrients but low stability is caused by nutrients derived from human activities, such as industrial emissions, waste discharges, and artificial fertilization. Put differently, it appears that soil nutrients are impacted by human activity in a restricted, erratic, and temporary way. Previous studies explored wheat plants from a semi-arid region of northwest Pakistan by [19], who found widespread deficiencies of P, K, and Zn. These results define the current status of nutrient classification and regional trend-based variable-rate fertilizer management systems. Within the Sialkot district, [20] find the diethylenetriamine penta-acetate (DTPA) micronutrient distribution that can be extracted. The findings demonstrated differences in the soil’s pH, EC, SOM content, and micronutrient concentrations. The findings suggest that mapping regional variability may be useful for site-specific nutrition management [10]. [14] analyzed 14,490 soil samples from Punjab and discovered that 81% of the samples had non-saline EC values (4.0 dS/m) and 74% of the samples had a normal pH (8.5). In addition, 90% of the samples had low SOM (1%), whereas 45% of the samples had low P that was readily accessible (7.0 mg/kg). Enough K was present in 70% of the soils (80- 180 mg/kg). Punjabi research found a correlation between the nutrient content of the trees, the location of the orchard, and the soil and citrus fruit quality [21]. Enough K led to relatively alkaline, low SOM, and P content soils. There are some factors, such as higher soluble solids concentration (SSC), decreased peel weight, and higher ascorbic acid levels, all results of healthy soil and leaf litter nutritional conditions in the soils. [22] examined soil micronutrients and explored significant geographical differences in soil properties and soil nutrients. He found that mitigation strategies and fertilizer suggestions needed to be applied because 41% of samples had a B deficit, which was very important. There are different farming practices, and better agriculture production is famous in Punjab Pakistan [23]. Alterations in the concentrations of soil nutrients and their spatial distribution patterns in these regions greatly influence crop performance and potential production [24]. Consequently, analysis of soil properties and nutrient status is needed to develop successful soil management plans and knowledgeable fertilizer recommendations [25]. Geostatistical techniques are very important to produce meaningful maps and models when combining soil and geographic data for spatial analysis [26]. Geostatistical methods together with soil sample data can be used to determine fluctuations in soil properties and nutrient availability, as well as maps of spatial variability [27]. Soil management strategies can be made easily, and fertilizer supply can be adjusted to enhance crop production and soil fertility. With this knowledge, places with nutrient imbalances or shortages may be more rapidly detected [25].
The deficiency in soil nutrients caused by shortages of exhausted crops, intensive cropping patterns, improper fertilizer use, and the influence of climate change all pose challenges to long-term agricultural success. Soil health needs to be preserved and re-established to deal with these complex issues and guarantee future food security. In order to gain significant insight into the regional variations in soil fertility and nutrient availability, the study will: (1) assess the physical properties (pH, EC, SOM), micronutrients (Zn, Cu, Fe, Mn, and B), and macronutrients (P and K) in the agricultural areas of Hafizabad. Principal Component Analysis (PCA) and correlation are used to (1) reduce complexity and identify dominating patterns in soil nutrient and property data, and (2) create a geographic variability map that illustrates the patterns of distribution for these variables. By illuminating the dynamics of soil-plant nutrients in these places, the findings will support evidence-based decision-making for more precise nutrient management, sustainable farming practices, and increased crop yield.
Material and Methods
Study Area
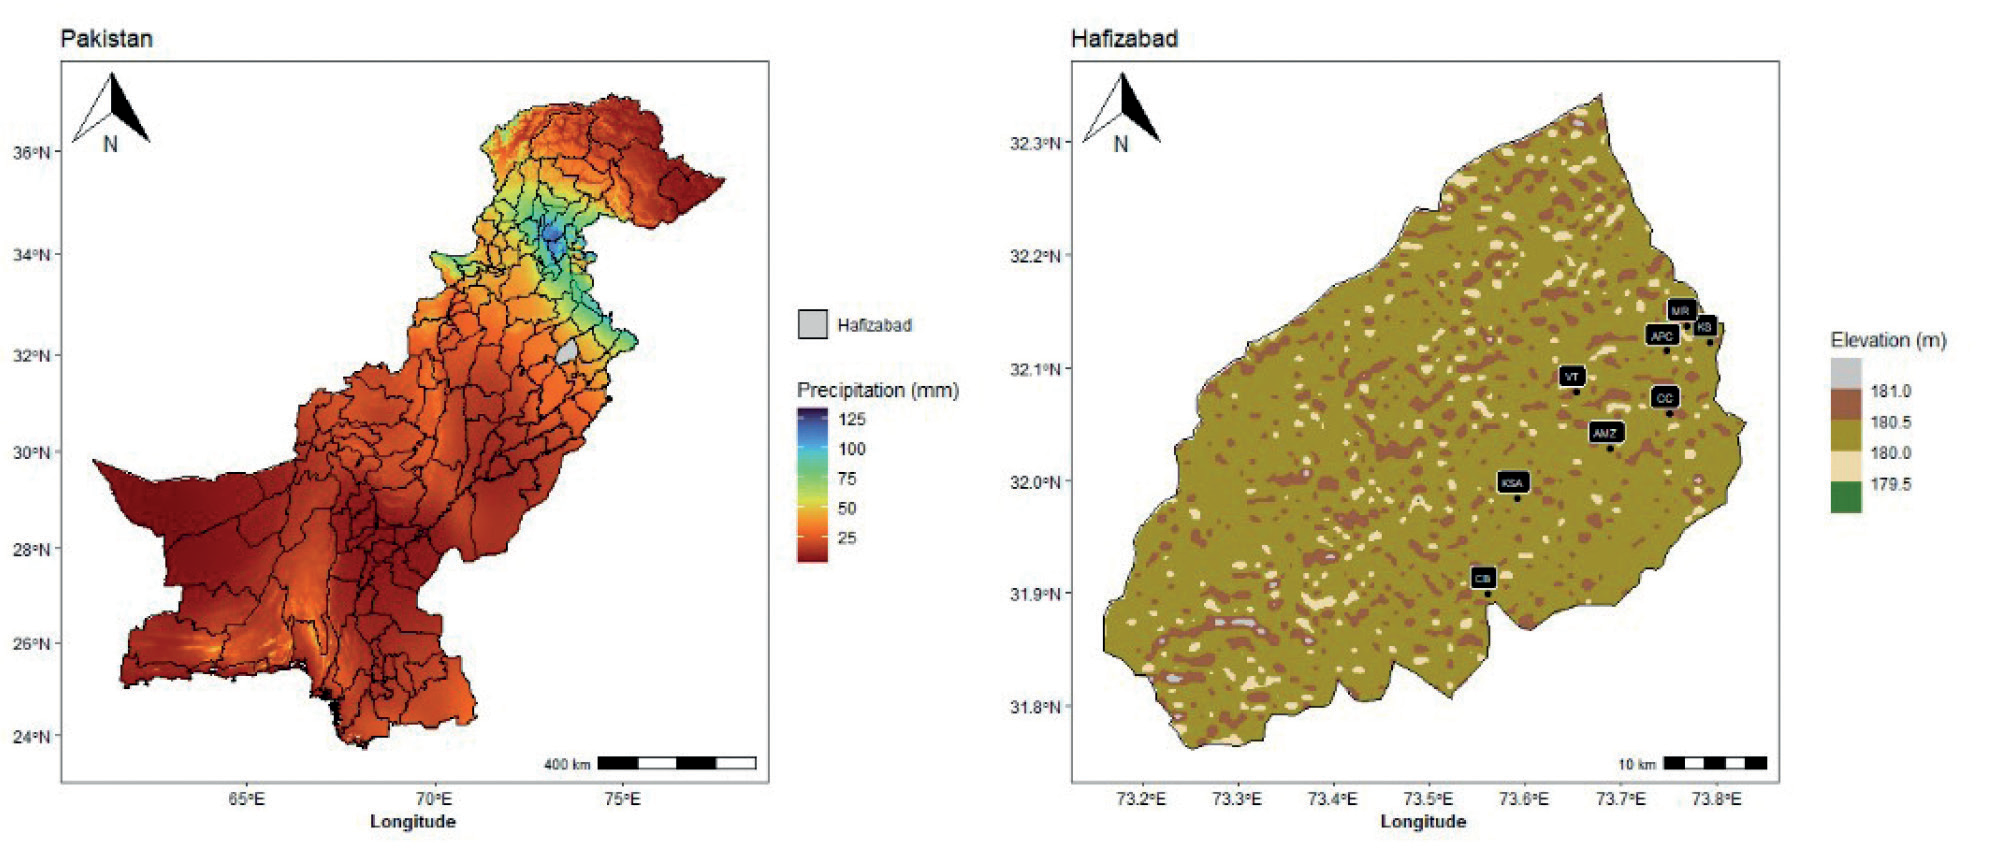
Punjab province is home to Hafizabad in Pakistan (Fig. 1), a fascinating research site with a widespread understanding of its topography, climate, and agricultural landscapes [28]. It is located between latitudes 32 and 33 degrees North and longitudes 72 and 73 degrees East [29]. Its climate topographies have different seasons. Winters are usually mild and offer release from the stifling heat of summers, which are characterized by temperatures that regularly exceed 40°C. The region’s agricultural cycles and ecological dynamics are shaped by the average yearly temperature, which ranges from 20 to 30 °C. The majority of the yearly rainfall, which fluctuates between 400 and 600 mm, falls during the monsoon season, which lasts from July to September. The region receives much-needed precipitation from the monsoon winds from the Arabian Sea and the Bay of Bengal, which affects the moisture content of the soil and agricultural growth. As a unique study location that captures the complex interplay between its subtropical climate, topographical features, and agricultural productivity, Hafizabad stands out.
Soil Sampling
Eight villages were equally divided into the research region, creating a regular grid of forty. The locations of soil samples taken from each grid at a depth of 0 to 6 cm in the fertile layer of arable soil were recorded using global positioning system (GPS) data. The sample distribution for Hafizabad city is 32° 3’54.53”N latitude and 73° 45’56.55”E longitude. Map Fig. 1 shows a map of Hafizabad overlayed with sampling locations. For each sample point, approximately 1 kilogram of mixed loam soil from the surface to a depth of 6 cm was collected, brought back to the laboratory for airing, and then plant roots, leaves, and stones were eliminated. Samples of soil were ground and then put through sieves with mesh sizes of 20 and 100, respectively.
Analytical Methods
The soil properties, including electrical conductivity of soil extract (EC), and soil pH of saturated paste are determined by following the standard methods described in Hand Book 60 [30] of the United States Department of Agriculture.
Macro and Micronutrient Determination
For soils with pH ranges of neutral to alkaline, Lindsay and Norvell’s (1978) Diethylenetriamine Pentaacetate (DTPA) extraction solution has been calibrated. Pakistan’s soils are predominantly alkaline in composition compared to other regions [31]. Therefore, it was believed that Pakistan’s alkaline soils would provide plant-available micronutrients that could be quantified using the DTPA extraction technology. DTPA is an effective chelating agent that forms bonds with exchangeable metals that are weakly adsorbed and soluble in water in soil. Chelation processes are slow, taking weeks or months to achieve an equilibrium state. Consequently, the concentration of DTPA in the solution-to-soil ratio (2:1) was changed to a level capable of chelating metals up to ten times their atomic weight. This could reduce the rivalry between metal ions for the binding of chelating agents. In calcareous soils, calcium chloride (CaCl2) keeps calcium carbonate (CaCO3) from dissolving, maintaining soil carbon dioxide (CO2) concentrations and preventing the release of metals that are bonded to CaCO3. At a pH of about 7.3, the Metal-DTPA complex is more likely to form. Triethanolamine (TEA), which does not interact with flame, is employed in chemical analysis by Atomic Absorption Spectroscopy (AAS) to buffer the pH at 7.3. CaCl2, 0.005M DTPA, and TEA were mixed to make the extractant solution. The pH of the fluid was maintained at 7.3. After two hours of stirring at 25oC, a 1:2 mixture of soil sample and extractant solution was filtered using Whatman grade 42 filter papers. It was possible to identify the metal components in the filtrate using (AAS). Standard solutions for the micronutrients (Zn, Cu, Fe, and Mn) in the DTPA extraction solution were created using the National Institute of Standards and Technology (NIST)-certified reference materials (CRMs). The user manual for the instrument was followed to calibrate the AAS using a standard solution. B was extracted from the soil using the hot-water extraction method, and the amount of B was then quantified calorimetrically using Azomethine-H salt. The Mo-Sb Colorimetry was used to calculate the phosphorus content (Bao, 2000). Using inductively coupled plasma atomic emission spectroscopy, the K content was determined. After comparing the results to the standards established by the National Agricultural Research Centre (NARC), Islamabad, Pakistan, the soils were classified as low, marginal, and adequate in terms of plant-available micronutrients. The micronutrient fertility of soils is estimated using the DTPA-extracted micronutrients.
Statistical Analysis
Using R software, we carried out statistical analysis (Pearson correlation) to ascertain correlation and descriptive statistics between variables. The Surfer software used traditional kriging interpolation, a geostatistical method known as the least non-biased linear estimator, to forecast the spatial distribution of each element. We used Origin and R software to construct a graphical representation of nutrition. Utilizing a projected coordinated system, soil samples are georeferenced (latitude, longitude) to represent the corresponding low, marginal, or acceptable concentration of plant-available micronutrients. Zone 43 (WGS 1984 UTM) Data sets were imported into the Quantum Geographic Information System (QGIS, v.3.12) to perform ordinary kriging of the micronutrient and macronutrient status at non-sampling sites. Ultimately, the kriged maps were classified according to the NARC’s nutritional requirements. It also looked into how the basic characteristics of the soil and the micronutrients that plants may access relate to each other.
Results
Soil properties
EC (dS/m)
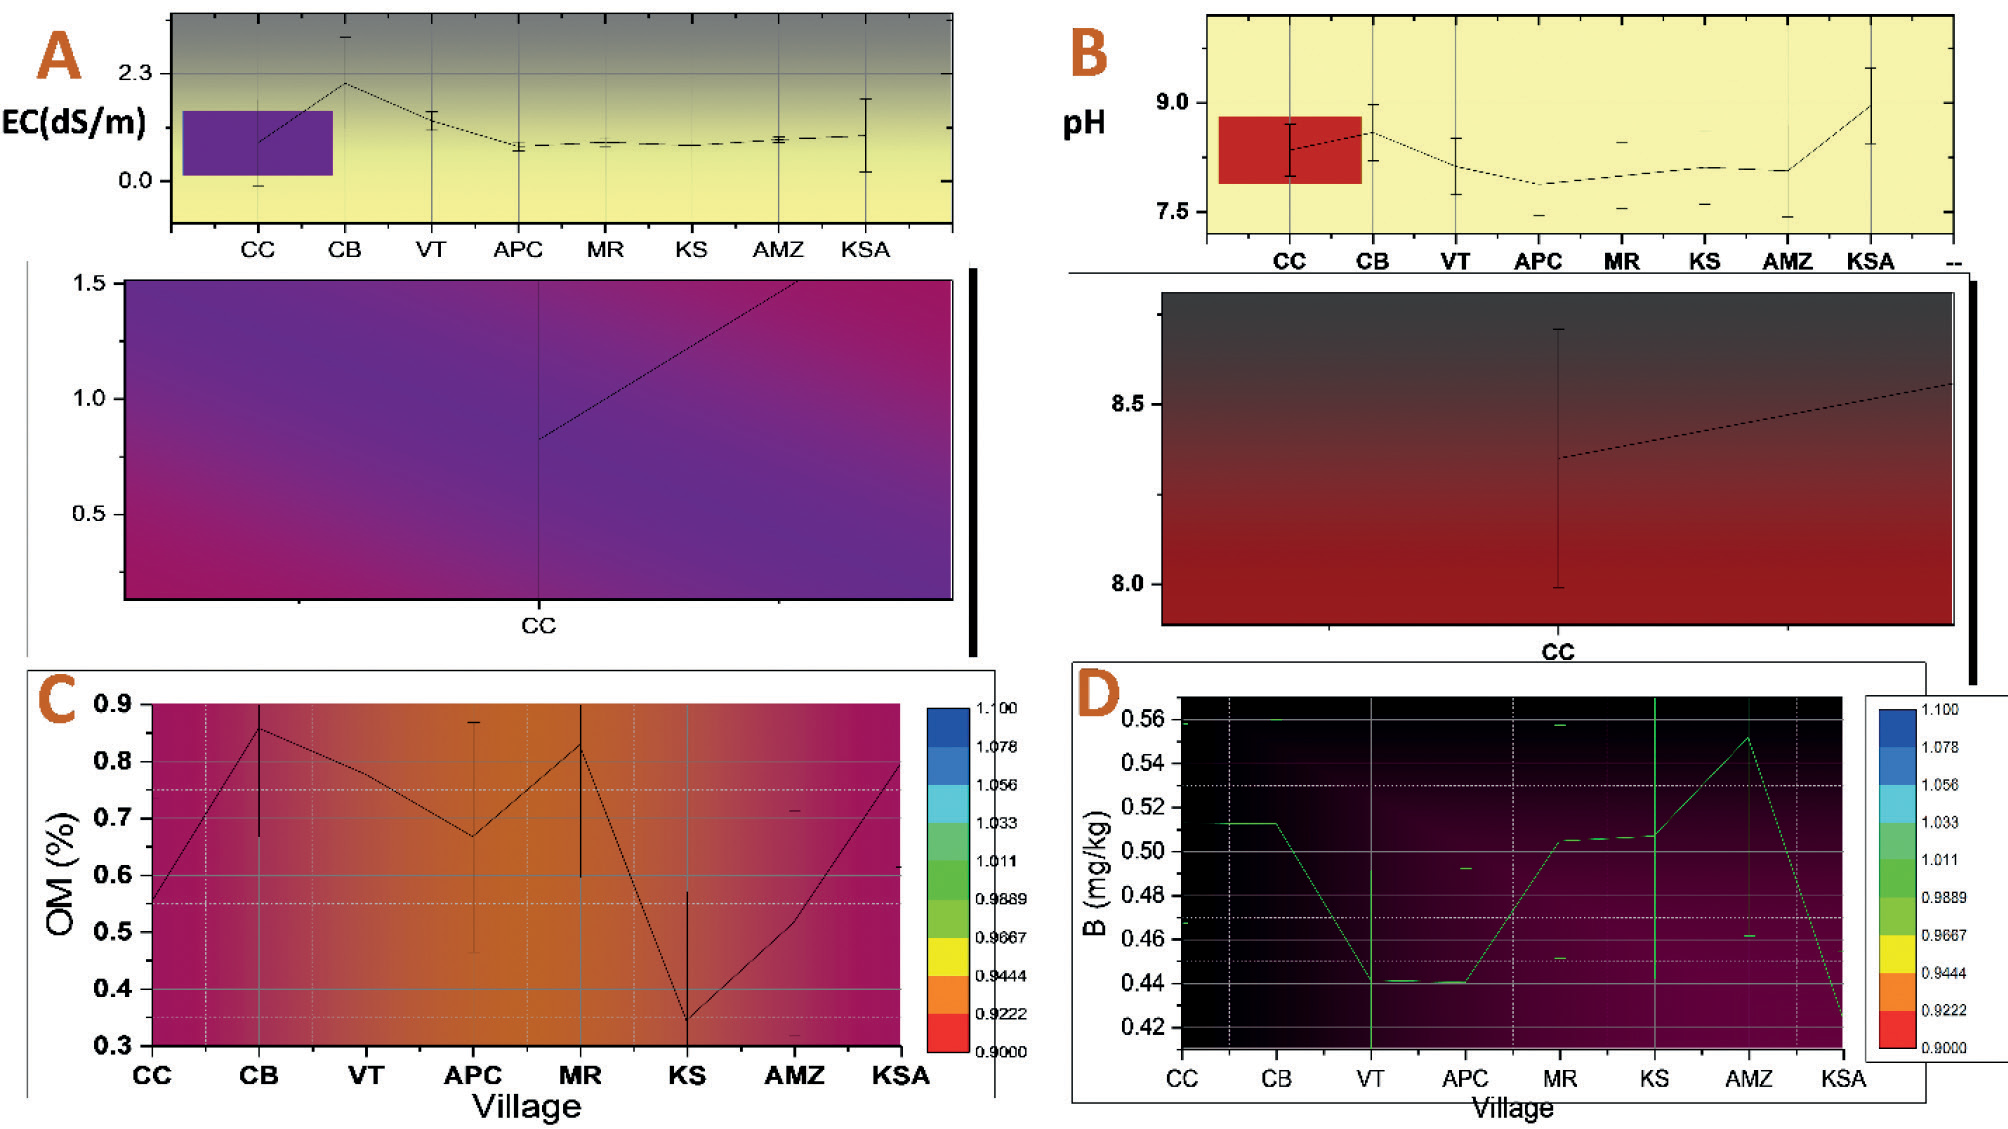
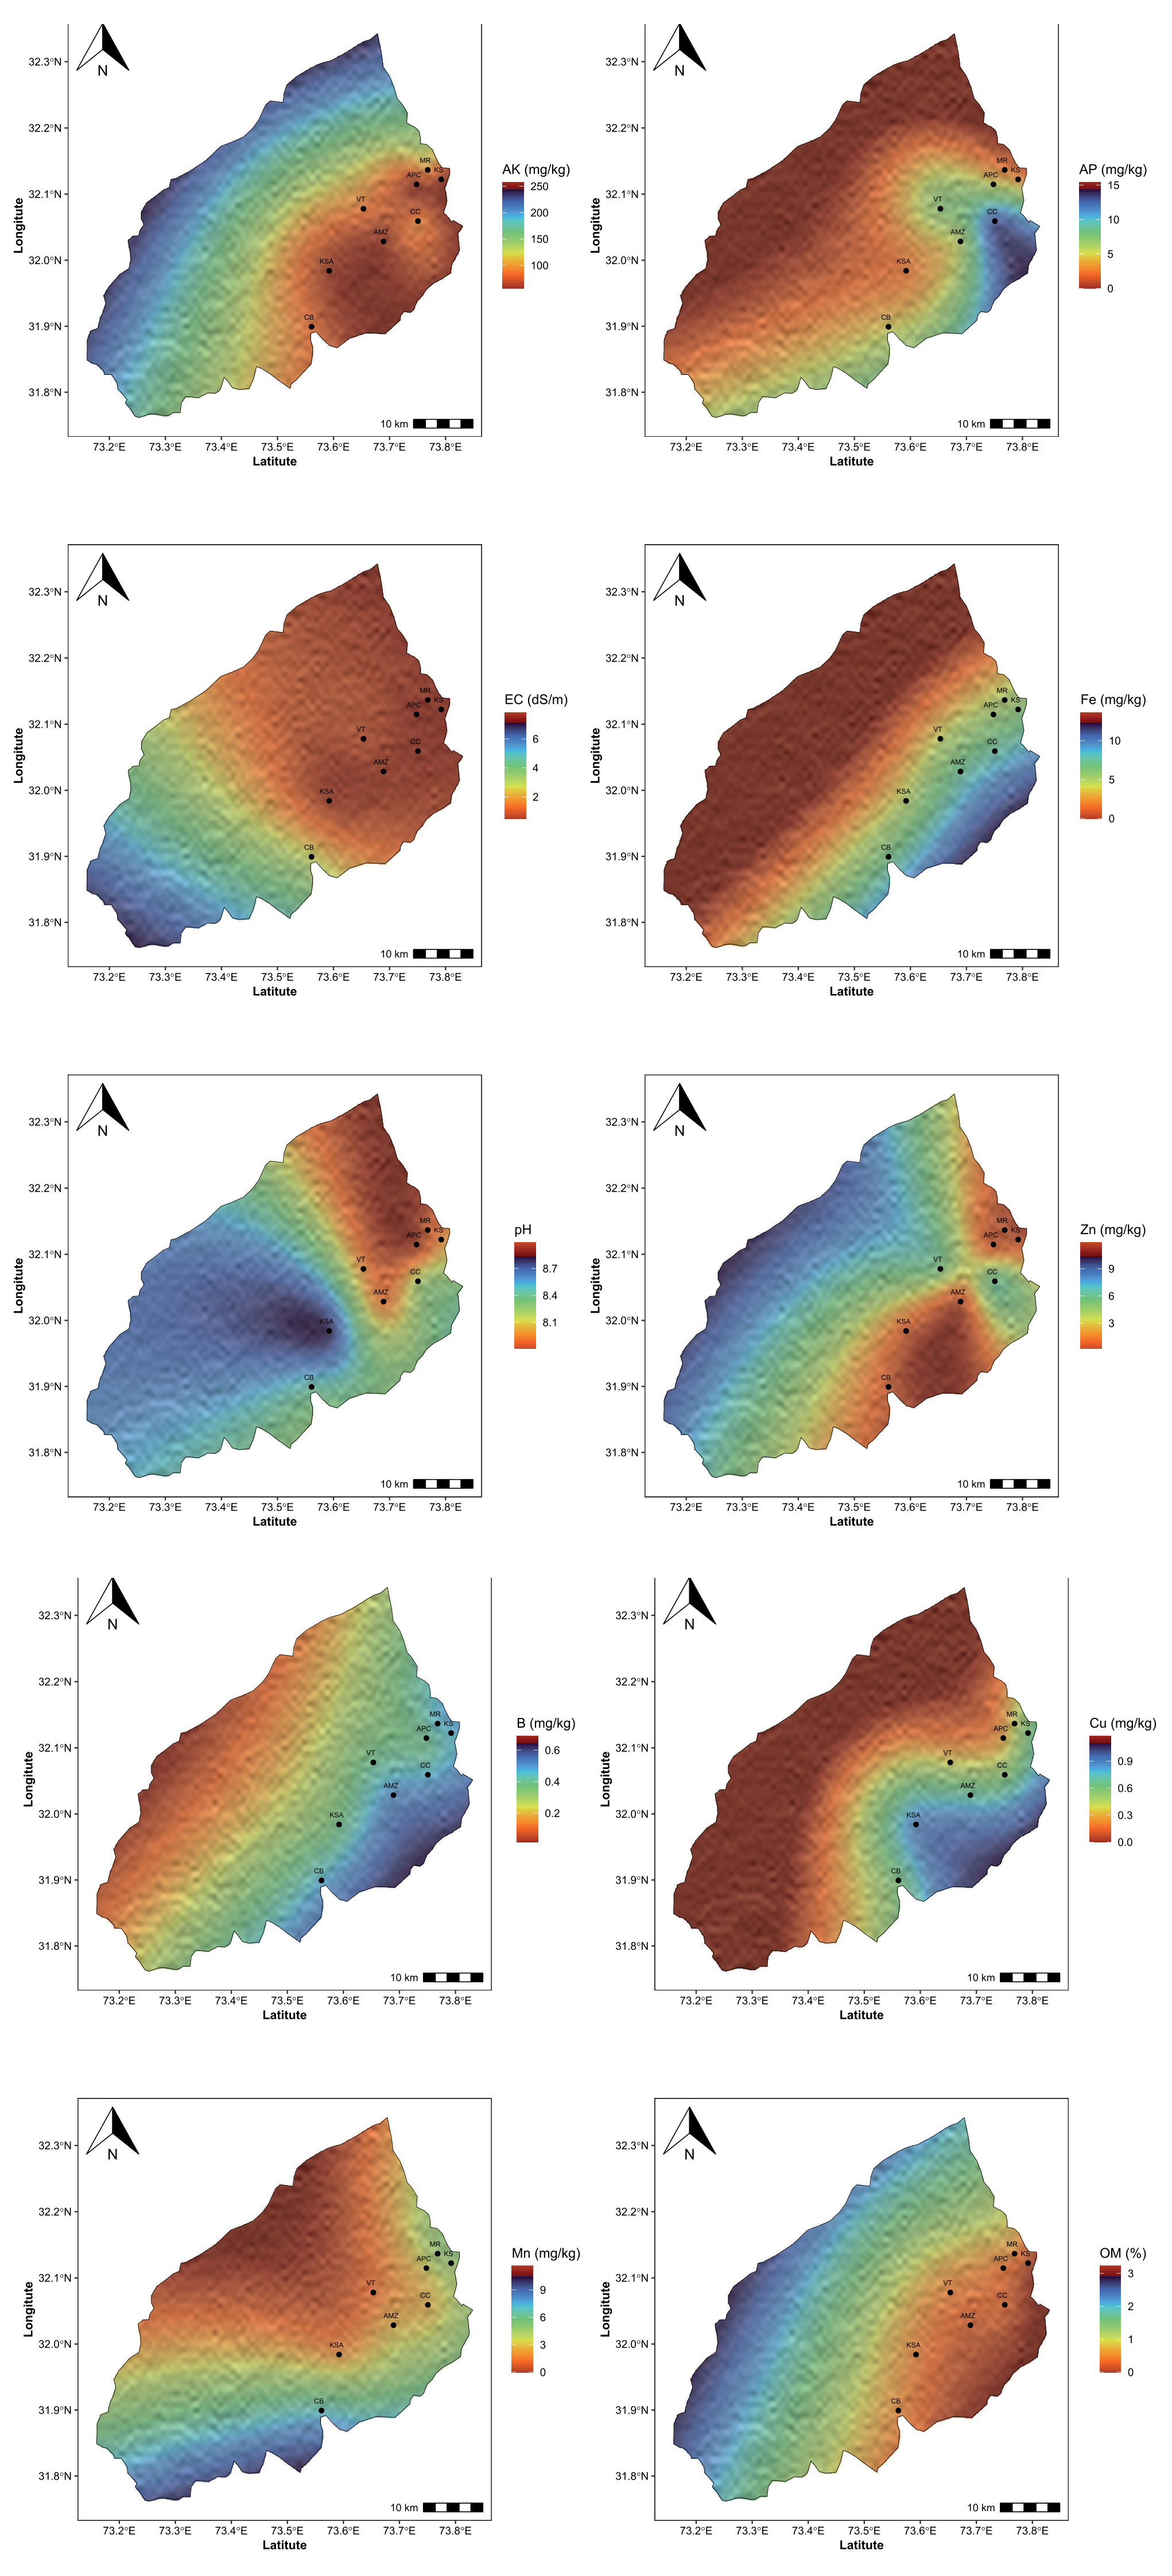
The allowable EC limits in soil are < 4.0 dS/m, according to NARC (Table 1). It can be seen that in all villages, EC is under the allowable limits according to NARC, obtaining the following sequence: Chack Bher > Vanik Tarar > Kot Shabir Ahmed > Muradian > Ahmed Muradian Zera > Chack Chadar > Koat Sajana > Ahmed Pur Chatha (hereafter to refer as CB, VT, KSA, MR, KMZ, CC, and KS, respectively). Thus, the highest mean values of EC were found in CB, VT, and KSA with 3.46±14.6, 1.29, ±0.71, and 0.98±0.76 dS/m, respectively, as shown in Table 2, Fig. 2A, and Fig. 6. While KS and APC show the lowest EC values with 0.77±0.12 and 0.74±0.01 dS/m, KMZ, MR, and CC were found to be 0.84±0.12, 0.84±0.01, and 0.83±0.26 dS/m, respectively. Thus, EC is found in the normal range in all soil samples of Hafizabad villages. The EC values of more soil samples were found within the allowable limits of NARC for soil (< 4.0dS/m).
pH
The allowable pH limits in soil are < 8.4, according to NARC (Table 1). It can be seen that pH in all villages is not under the allowable limits and found the following sequence: KSA > CB > CC > VT > KS > KMZ > MR > APC (Table 2). Thus, the highest mean values of pH were found in KSA, CB, and CC with 8.96±0.3, 8.59±0.4, and 8.33±0.18, respectively, as shown in Table 2, Fig. 2B, and Fig. 6. While KMZ, MR, and APC show the lowest pH values with 8.00±0.07 and 8.00± 0.22, but it was under the allowable limits. However, VT and KS were found to be with 8.12 ±0.49 and 8.11±0.07, respectively. Thus, the pH of KSA and CB soil samples was not found within the allowable limits, and it is found alkaline, but all other villages were found in a normal range.
Soil Organic Matter (%)
The allowable soil organic matter (SOM) limits in soil are 0.86–1.29%, according to NARC (Table 1). It can be seen that SOM in all villages is not under the allowable limit except CB, and we found the following sequence: CB > KMZ > MR > KSA > VT > APC > CC > KS (Table 2, Fig. 2C, and Fig. 6). Thus, the highest mean values of OM were found in CB, KMZ, and MR with 0.86±0.14, 0.83±0.32, and 0.83± 0.47%, respectively, as shown in Table 2. While KS, CC, and APC show the lowest OM values with 0.34±0.1, 0.57±03, and 0.674± 0.52%. However, VT and KSA were found to be with 0.78±0.43 and 0.794 ± 0.08 percent, respectively. Thus, OM of CB soil samples were found in the allowable limits, but not all OM of all other villages were found in a normal range.
Table 1.
Critical limits of nutrients by NARC (National Agricultural Research Center).
Macronutrients
Available Phosphorus (mg/kg)
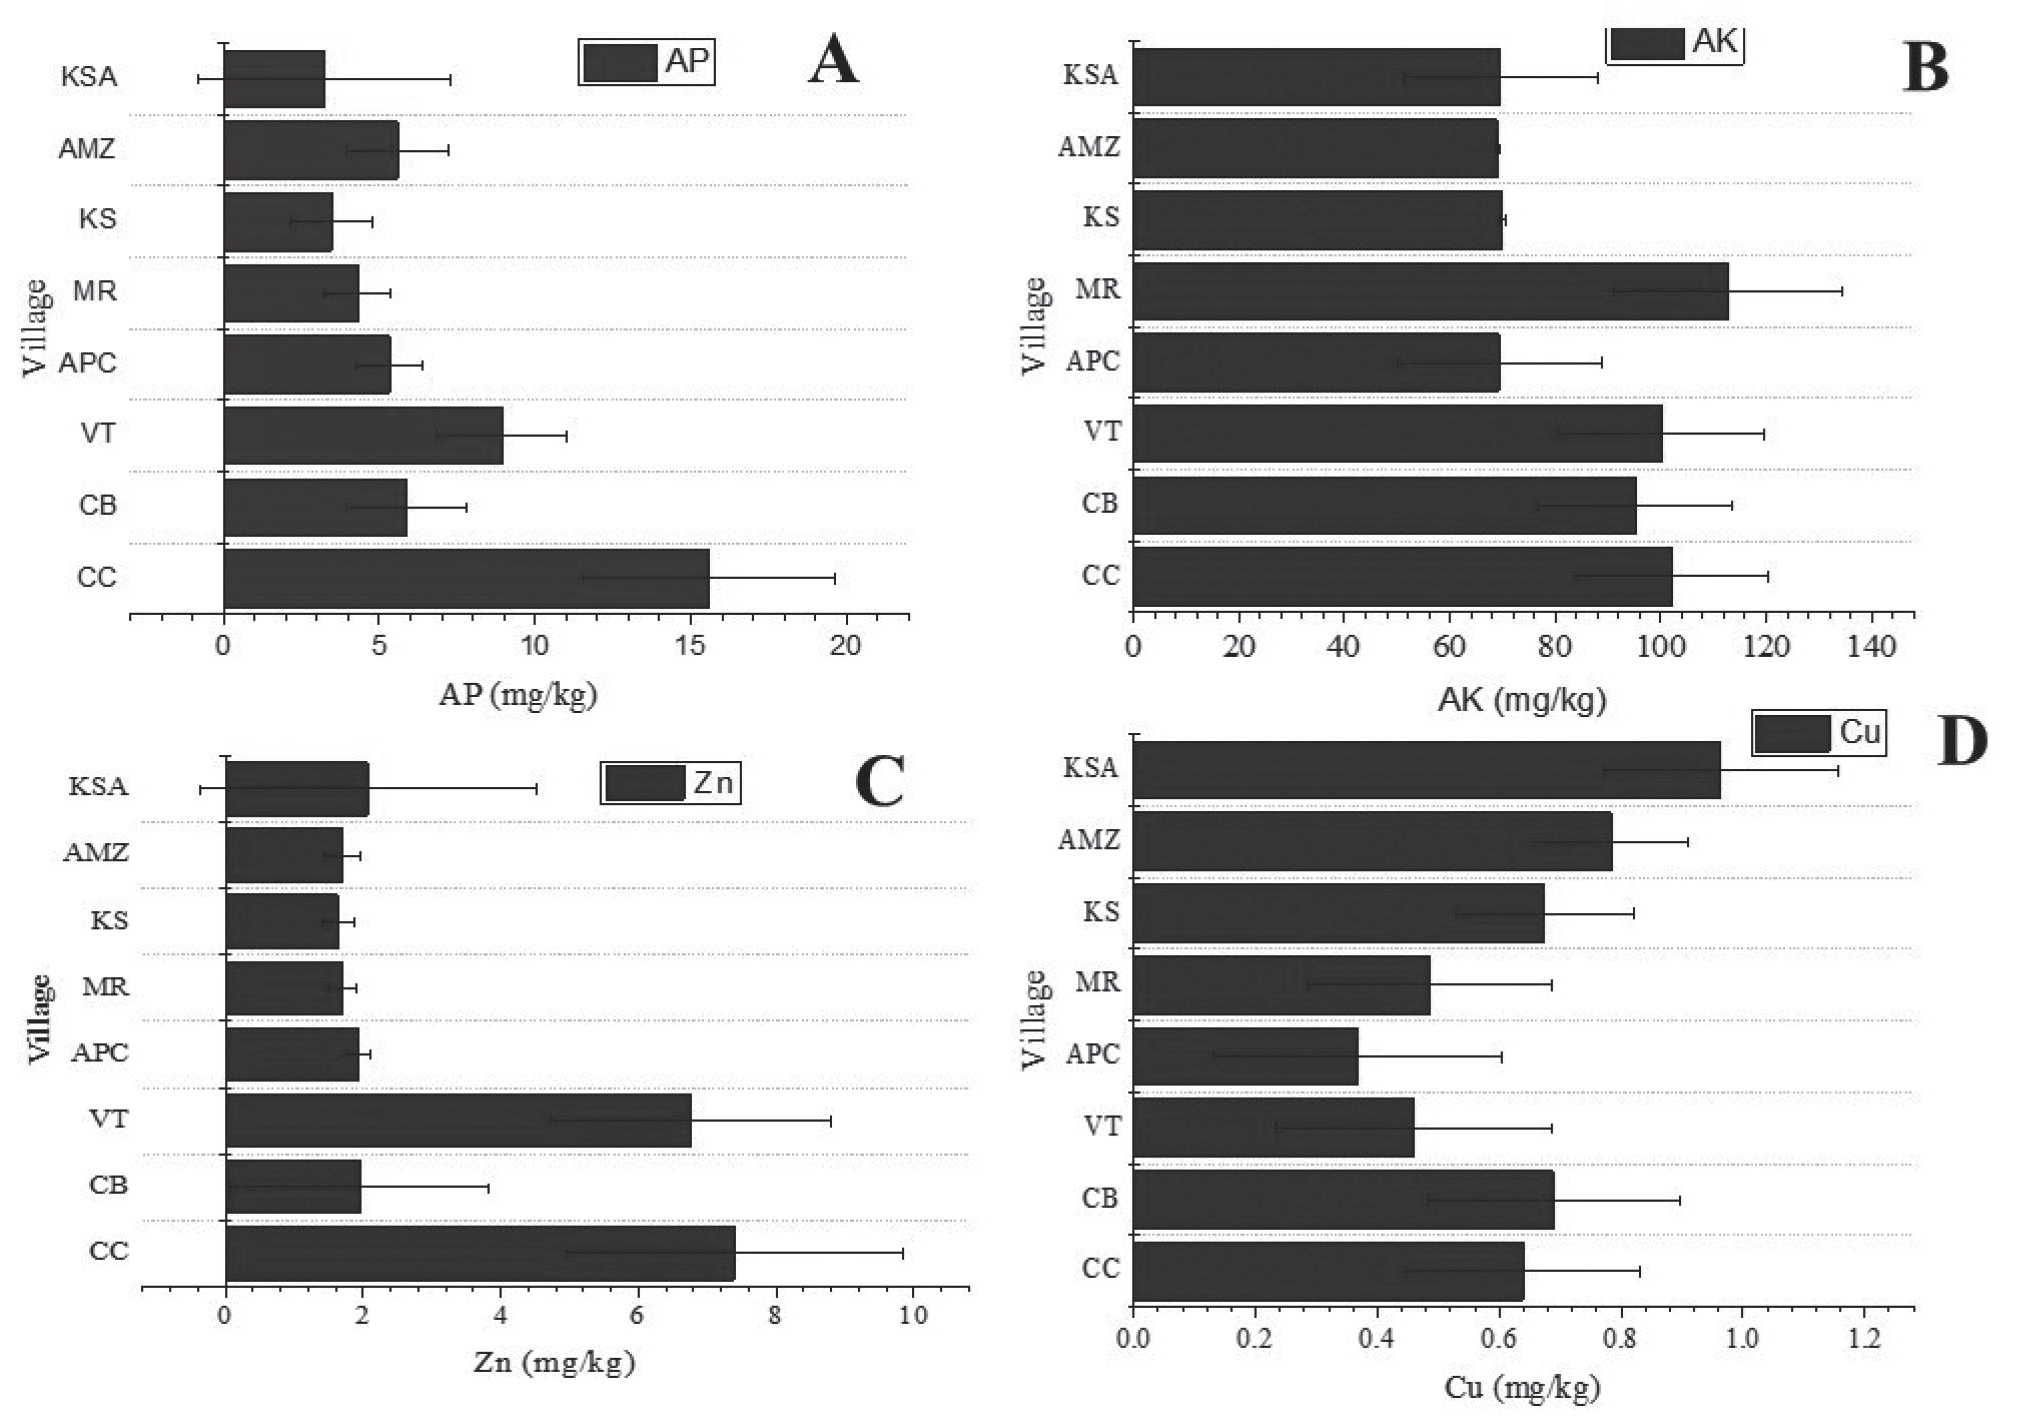
The allowable available phosphorus (AP) limits in soil are 10.9–21.4 mg P kg-1 soil, according to NARC (Table 1). It can be seen that AP in all villages is not under the allowable limit except CC and found the following sequence: CC > VT > CB > APC > MR > KMZ > KS > KSA (Table 2). Thus, the highest mean values of OM were found in CC, VT, and CB with 15.1±9.43, 8.94±5.92, and 5.88±2.19 mg P kg-1 soil, respectively, as shown in Table 2, Fig. 3A, and Fig. 6. While KMZ, KS, and KSA show the lowest AP values with 4.32±8.33, 3.474±2.03, and 3.22±1.88 mg P kg-1 soil. However, APC and MR were found to be with 5.33±5.21 and 4.32±3.17 mg P kg-1 soil, respectively. Thus, CC village found AP in the allowable limit, but all other villages have less concentration of AP.
Available Potassium (mg/kg)
The allowable available potassium (AK) limits in soil are 110–280 mg K kg-1 soil, according to NARC (Table 1). It can be seen that AK in all villages is not under the allowable limit except MR and KMZ, and the following sequence: MR > KMZ > VT > CC > CB > KS > KSA > APC (Table 2, Fig. 3B, Fig. 6). Thus, the highest mean values of AK were found in MR, KMZ, and VT with 112.4±5.24, 112.1±8.67, and 100.4±1.19 mg K kg-1 soil, respectively, as shown in Table 2. While KS, KSA, and APC show the lowest AK values with 70.04±7.21, 69.6±18.67, and 69.3±12.7 mg K kg-1 soil. However, CC and CB were found to be with 91.8±35.1 and 95.1±72.1 mg K kg-1 soil, respectively. Thus, MR and KMZ villages found AK in the allowable limit, but all other villages have less concentration of AK.
Micronutrients
Zinc (mg/kg)
The allowable Zinc (Zn) limits in soil are 0.5– 1.0 mg Zn kg-1 soil, according to NARC (Table 1). It can be seen that Zn in all villages is beyond the allowable limit and found in the following sequence: CC > VT > KSA > CB > APC > MR > KMZ > KS (Table 2, Fig. 3C, Fig. 6). Thus, the highest mean values of Zn were found in CC, VT, and KSA with 7.61±1.89, 6.76±2.22, and 2.07±0.34 mg Zn kg-1 soil, respectively, as shown in Table 2. While MR, KMZ, and KS show the lowest Zn values with 1.70±0.31, 1.70±0.37, and 1.63±0.29 mg Zn kg-1 soil. However, CB and APC were found to be with 1.95±0.52 and 1.93±0.35 mg Zn kg-1 soil, respectively. Thus, in all villages, Zn concentration is above the limit.
Table 2.
Descriptive statistics of nutrients and soil properties in Hafizabad.
Copper (mg/kg)
The allowable Copper (Cu) limits in soil are 0.2–0.5 mg Cu kg-1 soil, according to NARC (Table 1). It can be seen that Cu in all villages is beyond the allowable limit and found in the following sequence: KSA > CB > KS > CC > KMZ > MR > VT > APC (Table 2, Fig. 3D, Fig. 6). Thus, the highest mean values of Cu were found in KSA, CB, and KS with 0.96±0.7, 0.69±0.44, and 0.67±0.38 mg Cu kg-1 soil, respectively, as shown in Table 2. While, MR, VT, and APC show the lowest Cu values with 0.494± 0.38, 0.46±0.16, and 0.374±0.26 mg Cu kg-1 soil. However, CC and KMZ were found to be with 0.65±0.28 and 0.49±0.44 mg Cu kg-1 soil, respectively. Thus, in all villages found, Cu concentration is above the limit.
Iron (mg/kg)
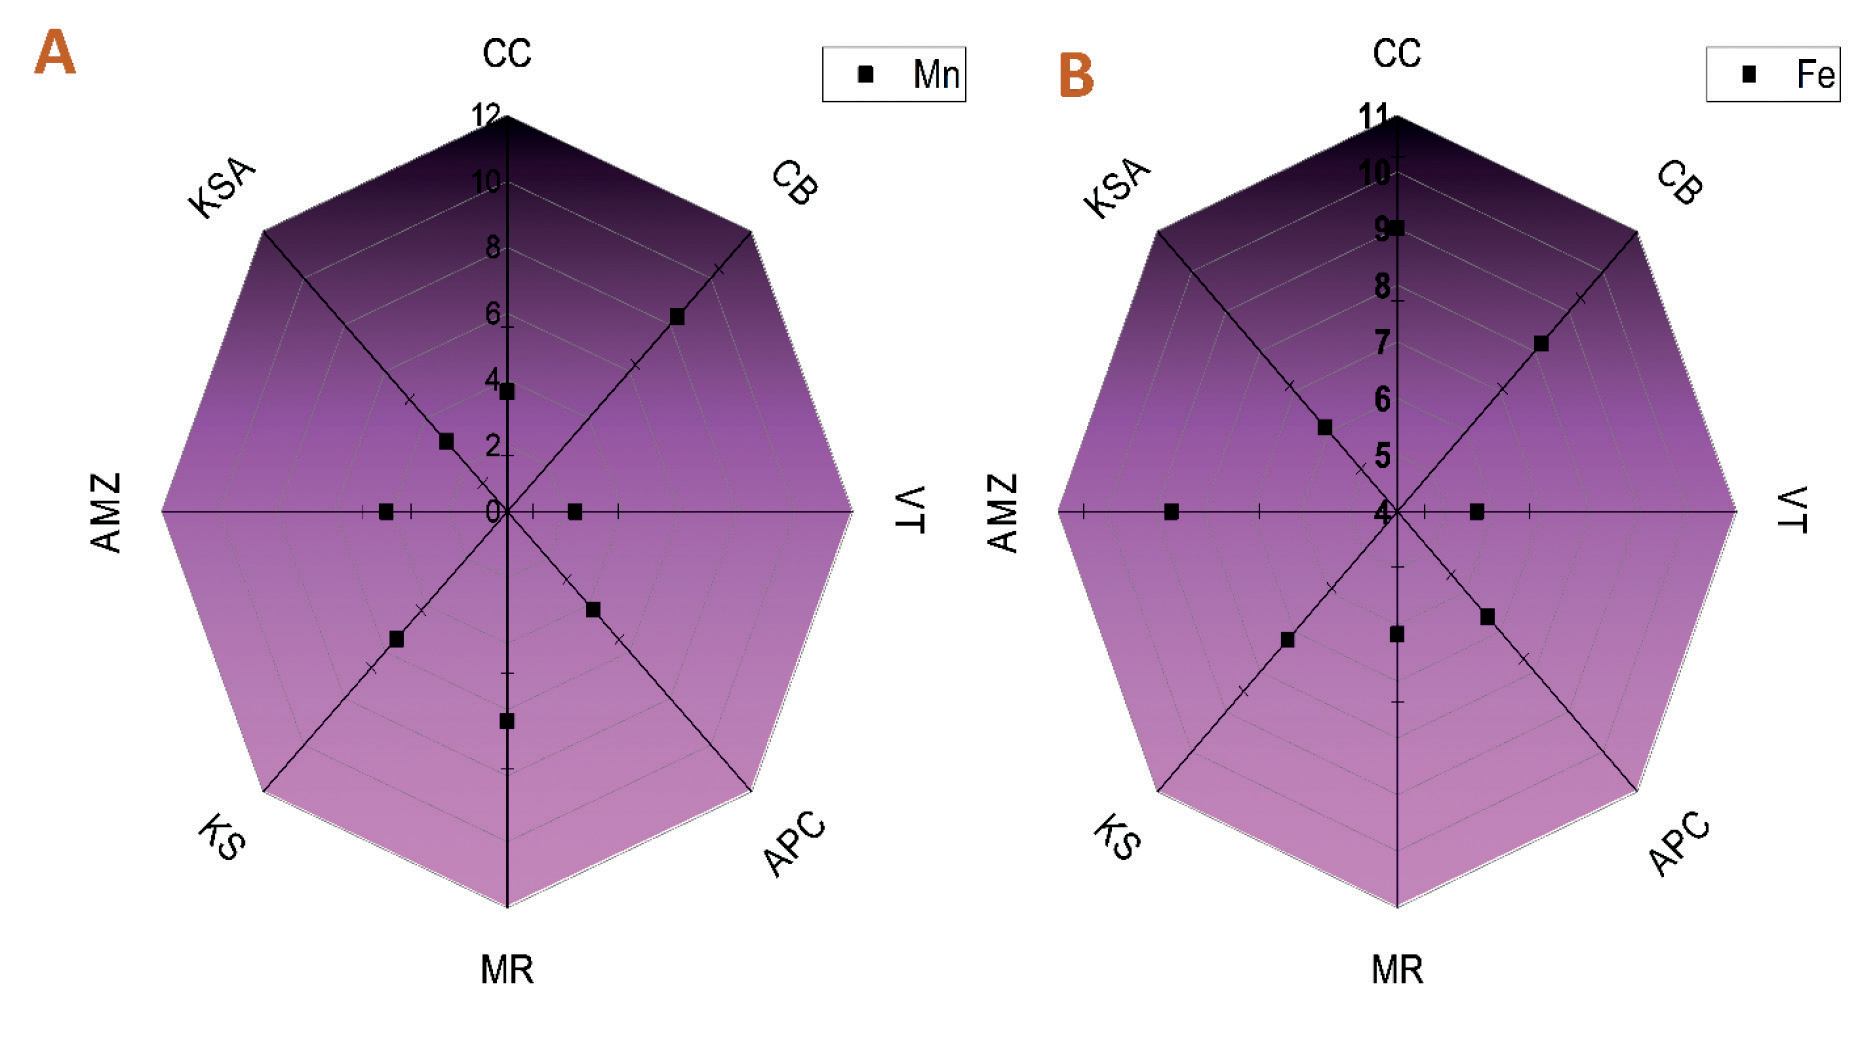
The allowable Iron (Fe) limits in soil are 4.5 mg Fe kg-1 soil, according to NARC (Table 1). It can be seen that Fe in all villages is beyond the allowable limit and found in the following sequence: KSA > CB > KS > CC > APC > KMZ > MR > VT (Table 2, Fig. 4A, Fig. 6). Thus, the highest mean values of Fe were found in KSA, CB, and KS with 23.3±21.27, 20.4±24.6, and 19.24±4.36 mg Fe kg-1 soil, respectively, as shown in Table 2. While KMZ, MR, and VT show the lowest Fe values with 6.17±5.66, 6.174±3.16, and 5.64±2.95 mg Fe kg-1 soil. However, CC and APC were found to be with 13.0±9.45 and 6.634±5.95 mg Fe kg-1 soil, respectively. Thus, in all villages, Fe concentration is above the limit.
Manganese (mg/kg)
The allowable manganese (Mn) limits in soil are 1.0–2.0 mg Mn kg1 soil, according to NARC (Table 1). It can be seen that Mn in all villages is beyond the allowable limit and found in the following sequence: KSA > CB > APC > MR > KMZ > KS > CC > VT (Table 2, Fig. 4B, and Fig. 6). Thus, the highest mean values of Mn were found in KSA, CB, and APC with 16.2±4.5, 8.34±3.21, and 6.77±1.25 mg Mn kg-1 soil, respectively, as shown in Table 2. While KS, CC, and VT show the lowest Mn values with 5.46±2.34, 3.64±1.63, and 2.37±0.68 mg Mn kg-1 soil. However, MR and KMZ were found to be with 6.35±2.09 and 6.344±2.71 mg Mn kg-1 soil, respectively. Thus, in all villages, Mn concentration is above the limit.
Boron (mg/kg)
The allowable Boron (B) limits in soil are 0.5–1.0 mg B kg-1 soil, according to NARC (Table 1). It can be seen that B in CC, CB, MR, KS, and KMZ villages is within the normal range, but VT, APC, and KSA have less B concentration. In addition, we found the following sequence: CC > CB > MR > KS > KM7 > VT > APC > KSA (Table 2, Fig. 2D, Fig. 6). Thus, CC, CB, MR, and KS have the same mean values of B with the highest concentration of 0.51±40.17, 0.51 ±0.12, 0.51±0.13, and 0.514±0.14 mg B kg-1 soil, respectively, as shown in Table 2. VT and APC also have the same concentration of B with 0.44±0.14, and 0.44±0.11 mg B kg-1 soil, respectively. Moreover, KMZ and KSA have B concentrations with 0.50±0.13 and 0.42±0.1 mg B kg-1 soil. In conclusion, CC, CB, MR KS, and KMZ have B concentrations within the allowable limits, but WT, APC, and KSA have less concentration than the normal range.
Correlation
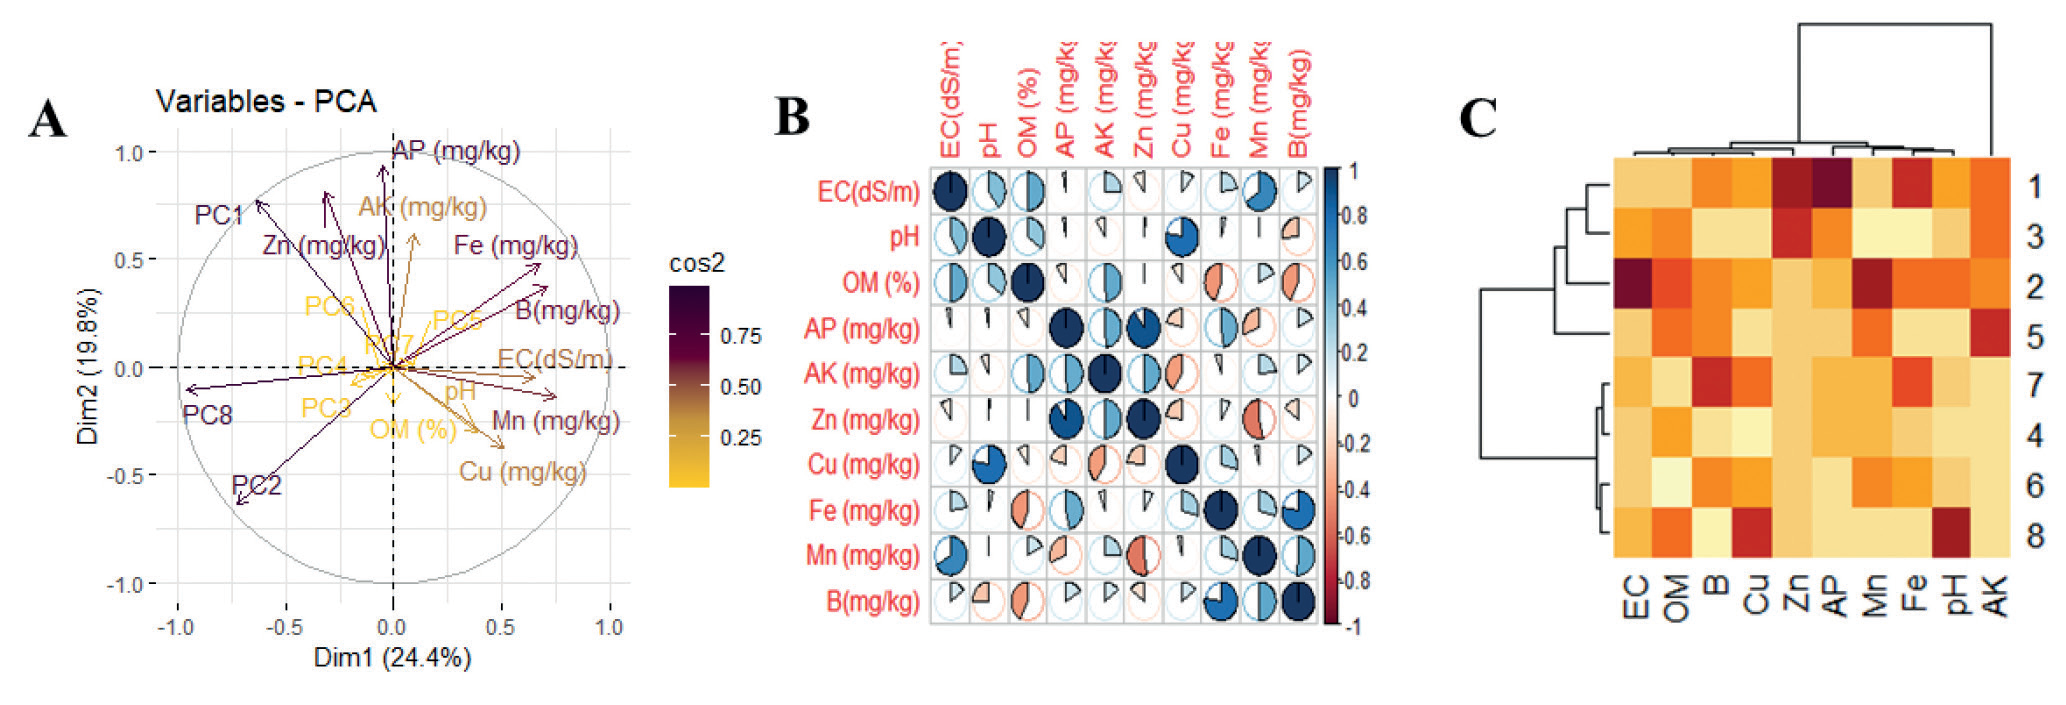
The Pearson correlation between soil properties and soil nutrients for the Hafizabad region is presented in Table 3 and Fig. 5B. A principal component analysis (PCA) and heat map were also conducted for these parameters (Fig. 5A, 5C). In PCA, Dim1 (PCA-1) comprised 24% and Dim2 (PCA-2) comprised 19.9% of the whole database. All the variables were dispersed successfully in the whole database. In addition, there was a significant relationship between the physicochemical properties and the secondary parameters. The pH had a strong positive correlation with Mn (R2 = 0.488) and a strong negative correlation with Zn (R2 = -0.336) and B (R2 = -0.360) (Table 3). OM has a strong positive correlation with AP (R7 = 0.327), AK (R2 = 0.369), Cu (R2 = 0.316), Fe (R7 = 0.283), and B (R2 = 0.393). AP had a strong positive correlation with AK (R2 = 0.279), Zn (R7 = 0.556), B (R2 = 0.435), and a negative correlation with Mn (R2 = -0.364). AK had a strong relation with Zn (R2 = 1.85). Zn had a strong negative relation with Mn (R2 = -0.494). Cu had a strong positive relation with Fe (R2 = 0.601), Mn (R2 = 0.438), and B (R2 = 0.338). Fe had a strong positive relation with Mn (R2 = 0.322) and B (R2 = 0.392).
Table 3.
Pearson correlation among nutrients in hafizabad district.
Discussion
The threat of reduced yield is a significant obstacle to agriculture at a time when millions of hectares of farmland face declining yields across the globe. We explore the complex relationship between soil characteristics and nutrient availability in the rice fields in the center of Hafizabad, Punjab, Pakistan, to uncover nature’s wealth of information.
[32] examined that surface soil has less than 1% organic matter in the agricultural land of Punjab, Pakistan. This is also clear in Table 2. The low levels of organic matter in the villages under study VT, KS, CC, and APC, in particular, have been linked to intensive agricultural methods such as monoculture and overuse of chemical fertilizers, according to prior research. The loss of organic matter in the soil is facilitated by these methods. It is advised to use sustainable farming techniques, such as crop rotation, cover crops, and organic amendments, to address this problem and improve soil health [33, 34]. This will increase the OM and increase soil fertility [35]. Alkaline irrigation water, minerals in the soil, and agricultural practices may have subsidized the reported increased pH levels, particularly in KSA and CB. Alkaline irrigation water can gradually enhance the soil’s pH [1]. Soil pH may also be inclined to high carbonate content [36, 37]. The use of particular fertilizers, especially those having alkaline compounds, can also influence the pH of soil. It could be essential to apply acidifying fertilizers or make targeted amendments to the soil to decrease high pH levels and transport it into a range that is suitable for crop growth [38, 39].
Every hamlet had reduced levels of accessible phosphorus (AP), except CC. These lower levels could be caused by weathering of phosphorus-bearing minerals, insufficient phosphorus management practices, or insufficient application of phosphorus-containing fertilizer [40]. The availability of phosphorus is influenced by the pH of the soil, and the alkaline pH of KSA and CB may further reduce phosphorus availability. According to [41] dry lands or soils with low soil moisture content are more likely to have P deficiency. 90% of Pakistan is considered to be in a dry or semi-arid climate, which adds to the country’s P deficit [42–44].
The low levels of accessible potassium (AK) in the majority of villages (MR and KMZ being the outliers) could be caused by a variety of factors. These include inadequate fertilization methods for potassium, weathering of minerals containing potassium, and low potassium concentration in the parent material [45, 46]. Some communities, like KSA and CB, have an alkaline pH, which could be a factor in plants’ reduced uptake of potassium. Potassium availability can also be impacted by the pH of the soil. To address low levels of available potassium, farmers in these communities may need to consider potassium fertilization strategies, such as applying fertilizers containing potassium or using organic amendments rich in potassium. Furthermore, crop rotation and selection strategies might affect the soil’s potassium content. By using sustainable agricultural practices, such as cover crops and the addition of organic matter, that enhance potassium cycling and retention, overall soil fertility can be increased.
Every town has high zinc (Zn) levels that are above the allowable limit for a variety of reasons. Overuse of zinc-containing fertilizers, atmospheric deposition, and industrial activities can all contribute to elevated zinc levels in the soil [47]. In addition, the pH and organic matter concentration of the soil might affect the mobility and availability of zinc [48]. To address the rising levels of zinc, it is essential to assess and limit the use of fertilizers containing zinc, implement suitable waste management practices to regulate industrial inputs and account for atmospheric deposition [49, 50]. Remedies like soil amendments may also be necessary to lower the excess zinc in the soil and prevent any detrimental effects on plant growth and environmental quality. Additional research on the specific causes of zinc contamination in each hamlet can help to focus and optimize remedial techniques.
The higher-than-allowed levels of copper (Cu) in all the settlements were likely caused by anthropogenic factors such as pesticide use, industrial operations, and agricultural practices. Copper-based fungicides and insecticides, which are frequently used in agriculture, can progressively increase the amount of copper in the soil [51]. Copper contamination and inappropriate disposal of garbage can also go into the soil [52]. To address the elevated copper concentrations, it is imperative to review and regulate the use of agricultural inputs that include copper, promote the sustainable and responsible use of pesticides, and implement suitable waste management practices. Moreover, consider soil remediation methods such as phytoremediation or including amendments to immobilize copper [53]. Every town has high levels of iron (Fe) that are above the allowable threshold. The natural soil’s mineralogy, industrial processes, or human inputs could all be to blame for these amounts [54]. A higher content of iron can be produced by weathering, erosion, and minerals rich in iron found in the soil [55]. Furthermore, industrial operations can add iron to the soil, particularly in regions with a history of mining [56].
Similar to other micronutrients, manganese (Mn) concentrations beyond the allowable threshold may vary throughout villages due to a variety of circumstances. The rising levels could be the result of geological processes occurring naturally, human activity, or both. The weathering of minerals containing manganese in the soil, industrial emissions, and the use of fertilizers or herbicides containing manganese are among the potential sources [57].
It is crucial to assess and regulate the use of inputs that contain manganese, such as fertilizers and pesticides, to reduce the increased concentrations of the mineral. By using soil management strategies, such as adjusting pH levels, planting crop varieties that are manganese-efficient, and using sustainable agricultural practices, excess manganese in the soil can be decreased. Thorough research into the specific sources of manganese contamination in each community will guide the development of targeted and effective remediation strategies, ensuring sustainable agriculture and environmental protection.
The amounts of soil boron (B) in each village vary; whilst the concentrations in VT, APC, and KSA are lower, those in CC, CB, MR, KS, and KMZ are within allowable limits. APC, KSA, and VT may have lower boron concentrations due to leaching, different types of soil, or low boron concentrations in the parent material. Boron can seep out of the soil, especially in areas that receive greater rainfall or irrigation. The availability and retention of boron are also influenced by the soil’s composition and texture [58].
To address the low boron concentrations, farmers in VT, APC, and KSA may consider applying boron-containing fertilizers or amendments to meet the crop’s boron requirements. However, caution should be exercised to avoid overapplying boron because it can be toxic to plants in high amounts. To ensure optimal boron levels for crop growth and avoid deficiencies or surpluses, soil management approaches must be customized to the distinct circumstances governing boron accessibility in every village [59].
Conclusions
In conclusion, macronutrients, micronutrients, and soil properties values varied from the acceptable limits set by the NARC, according to the analysis of soil samples from the Hafizabad regions. In all villages, EC is under the allowable limits. However, soil pH is not under the allowable limits. Thus, the highest mean values of pH were found in KSA, CB, and CC, while lower levels of pH were found in the villages of KMZ, MR, and APC. SOM in all villages is not under the allowable limit except CB, as well as macronutrients were not found under the allowable limits in all villages, While micronutrients were found beyond the limit. Implementing targeted soil pH management measures is advised in light of the findings, particularly in villages with pH levels above permitted limits such as KSA, CB, and CC. To increase the general health of the soil, also concentrate on increasing the content of SOM, especially in villages other than CB. Interventions are required for macronutrients to bring concentrations within allowable bounds in every hamlet. Micronutrient management strategies should simultaneously work to prevent the high levels that have been seen in certain areas, guaranteeing balanced nutrient availability for profitable and sustainable agriculture.

