

Introduction
Greenhouse gases, including carbon dioxide (CO2), methane (CH4), nitrous oxide (N2O), and fluorinated gases (F-gases), are released into the atmosphere due to various human activities on a global scale. Methane, ranking as the second most prevalent greenhouse gas after carbon dioxide, contributes approximately 16% to the total global greenhouse gas emissions [1]. While human-related sources like agriculture, waste management, energy consumption, and biomass burning are recognized as major contributors to CH4 emissions, recent scientific investigations have highlighted natural emission occurrences from mangrove forests [2-4].
Mangrove ecosystems span approximately 14.8 million hectares globally, with Indonesia (19%), Brazil (9%), Nigeria (7%), and Mexico (6%) accounting for a substantial 40% of this total area [5]. In Vietnam, these vital ecosystems cover roughly 164701 hectares, predominantly distributed across the North (28%) and the South (70%), with the Xuan Thuy mangrove forest serving as a significant representation in the Northern region [5]. Traditionally acknowledged as crucial “blue carbon” ecosystems alongside seagrass beds and salt marshes, concerns have arisen regarding the potential impact of greenhouse gas emissions, particularly methane, on the carbon storage capacity of mangrove ecosystems [3, 6]. Processes such as fermentation and decomposition within the mud of mangrove forests have been identified as sources of gases such as H2S, N2O, and notably CH4. Acknowledging the significance of mangrove forests as reservoirs of carbon, Vietnam has undertaken studies assessing carbon stocks in various mangrove areas. These include studies in the Can Gio mangrove forest park in Hochiminh City and investigations of carbon stocks in Kandelia obovata and Sonneratia caseolaris forests in Kim Son, Ninh Binh province [3, 7, 8].
Vietnam has actively engaged in global climate change initiatives and, post-COP26, has committed to significant goals for greenhouse gas emissions reduction. These commitments involve aiming for carbon neutrality by 2050 and targeting a 30% reduction in methane emissions by 2030, specifically focusing on key sectors like energy, waste, agriculture, forestry, and land use (AFOLU) [1]. Consequently, conducting comprehensive greenhouse gas emissions inventories, particularly regarding methane emissions, becomes imperative to strategize and implement effective reduction plans.
However, research specifically addressing methane emissions from wetland ecosystems, especially mangrove forests in Vietnam, remains limited. Therefore, this study aims to estimate CH4 emissions and explore the relationship between factors such as mangrove age, environmental conditions, and methane emission levels within the Xuan Thuy mangrove forests. These findings will not only contribute valuable insights to greenhouse gas inventory practices but will also inform crucial environmental management strategies tailored for wetland ecosystems, particularly mangrove forests. Furthermore, the outcomes of this study will provide essential data necessary for establishing Tier 2 - country-specific Emission Factors (EF) for Vietnam.
Study Area and Methods
The Study Area
Xuan Thuy National Park, Nam Dinh Province, was the first wetland in Southeast Asia to join the RAMSAR International Convention (The Convention on Wetlands of International Importance especially as Water- fowl Habitat) in January 1989. In January 2003, Xuan Thuy wetland nature reserve became Xuan Thuy National Park, and in December 2004, Xuan Thuy National Park was recognized by UNESCO as the core area of the World Biological Reserve in the inter-provincial coastal area of the Red River Delta. 95% of mangrove vegetation in the Xuan Thuy National Park is Kandelia obovataa, and the remaining is Sonneratia caseolaris (L.) Engl. and Rhizophora stylosa [9].
In Nam Dinh province, the climate divides into the rainy season (from May to October) and the dry season (from November to the next April). During 2013-2022, in April and August, the monthly average air temperature varied from 22.0 to 26.7 °C (mean value: 24.5 ± 1.2°C) and from 28.5 to 31.1°C (29.1 ± 0.5°C), respectively. Meanwhile, monthly rainfall at Nam Dinh station ranged from 18.6 to 148.8 mm (97.2 ± 47.5 mm) in April and from 148.2 to 515.0 mm (354±107.5mm) in August (data not shown).
Materials and Methods
Sample Collection and Site Description
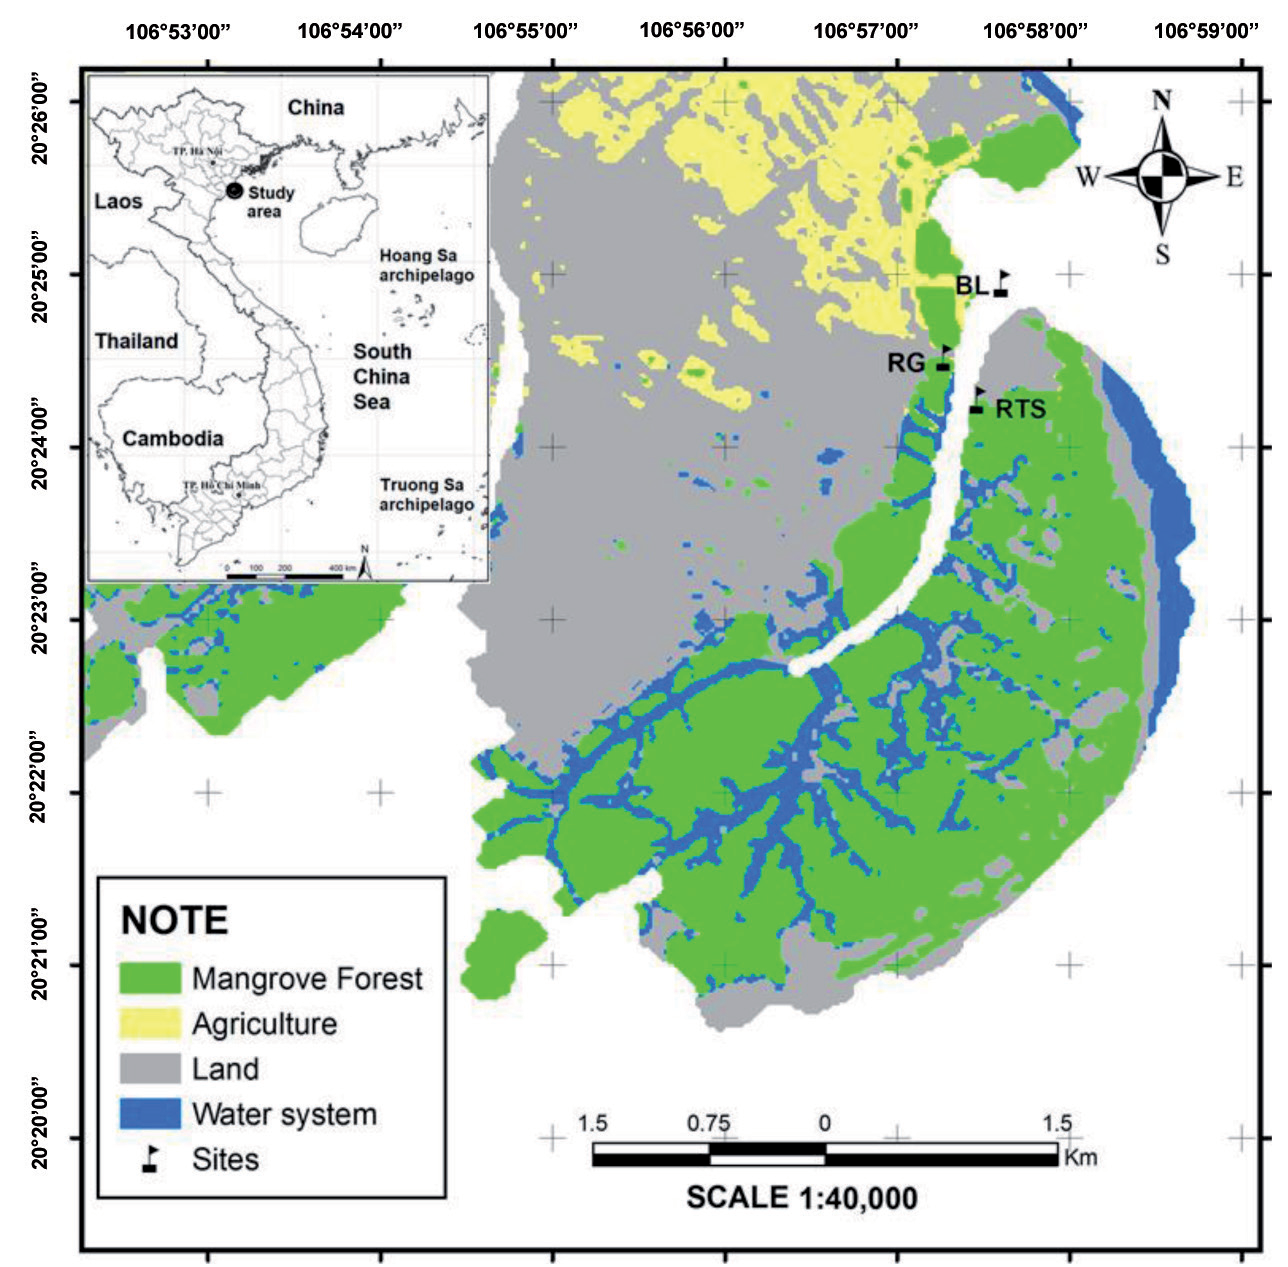
The study encompassed three distinct areas: old stand mangrove areas (abbreviated as RG) (>17 years old), young stand mangrove areas (RTS) (<11 years old) and a non-forest control area (BL). Within each area, sampling occurred at three sites, each maintaining a submerged depth of approximately 40-50cm, spaced roughly 20m apart (refer to Fig. 1). Soil, water, and methane samples were gathered from these sites. The fieldwork was conducted on April 11-12 (dry season) and August 13- 14 (rainy season) 2019, specifically during low tide and daytime between 10 am - 4 pm local time.
Fig. 1.
Sampling areas (BL: non-forest control area), (RG: old stand mangrove areas), and (RTS: young stand mangrove areas)
Water and Soil Sampling
At each site, three random sediment cores measuring 30 x 30 cm² were collected and thoroughly mixed. A total of fifty-four soil samples were obtained at three different depths (0-5 cm, 15-20 cm, and 35-40 cm) using a polyvinyl chloride (PVC) core. All samples were immediately stored in a cool box for subsequent laboratory analysis, which included Total Organic Carbon (TOC), Dissolved Organic Carbon (DOC), NO₃⁻, NH₄⁺, PO₄³⁻, Total Phosphorus (TP), and Total Nitrogen (TN).
Eighteen water samples were collected approximately 5-10cm below the water surface. Sample containers were rinsed three times with the respective water samples. Preservation of samples for TN, TP, NO₃, NH₄⁺, and PO₄³⁻ analysis was carried out following the Standard Methods for the Examination of Water and Wastewater [10].
In-Situ Water Quality Measurement
In-situ water quality parameters, including water temperature (Tw), pH, Dissolved Oxygen (DO), turbidity, and salinity (sal), were measured in triplicate using the TOA model WQC-22A water quality checker.
Dissolved nutrients (PO₄³⁻, NO₃⁻, and NH₄⁺) were analyzed spectrophotometrically using a UV-VIS spectrophotometer (DR6000, HACH, USA), following specific methods such as the Ultraviolet Spectrophotometric Screening Method (APHA method 4500-NO₃-B) for NO₃⁻, the Ascorbic Acid Method (PO₄: 4500-P E) for orthophosphate quantification, and the Salicylate Method proposed by Reardon et al. in 1966 for NH₄⁺ concentration determination [10, 11]. Total phosphorus (TP) was measured according to ISO 6878: 2004, employing the Ammonium Molybdate spectrometric method, while total nitrogen (TN) was quantified referring to ISO10048: 1991, utilizing Catalytic Digestion after reduction with Devarda’s alloy. Each measurement was performed three times, and the reported value represents the average of these three measurements (confidence > 90%).
Collection and Measurement of Methane Samples
Methane emissions were quantified using a widely adopted floating chamber system method [12]. The system comprised a custom-made cylindrical polyvinyl chloride (PVC) dark chamber (volume: 0.01292 m³; water-air interface: 0.06154 m²; height: 21 cm) equipped with a thermometer and an internal fan. Gas samples were manually extracted from the chamber four times at 0, 10, 20, and 30-minute intervals using separate syringes. These samples were immediately stored in pre-evacuated 12 ml glass vials (15.5mm diameter, Labco Limited, UK) for subsequent analysis via gas chromatography-flame ionization detection (GC-FID). The flame ionization detector was set at 300°C, maintaining the oven temperature at 50°C, with helium (99.99%) utilized as the carrier gas for methane concentration measurement.
Methane Flux Rate Calculation
The methane flux rate (F in mg/m²/day) at the time of chamber closure was determined using Equation 1 proposed by Smith and Conen [13].
Where: ∆C/∆t is the change in concentration in time interval; ν and A are the chamber volume and area; M is the molecular weight of methane (16.04g/mole); V is the volume occupied by 1 mole of gas at STP (0.024m3 or 22.4 L); P is the barometric pressure (mbar); P0 is the standard pressure (1103 mbar); T is the ambient temperature (K). ν/A may be substituted by the average chamber height. In areas close to sea level, the pressure factor can often be disregarded.
Methane Emission Factors (EFs) by the Intergovernmental Panel on Climate Change (IPCC)
Addressing the global climate change challenge necessitates accurate national greenhouse gas inventories. In 2006, the IPCC introduced the 2006 IPCC Guidelines for National Greenhouse Gas Inventories. Furthermore, the 2013 Supplement to the 2006 IPCC Guidelines for National Greenhouse Gas Inventories: Wetlands (Wetlands Supplement) was issued in 2013. According to this guideline, methane emission factors (EFs) are categorized into default data or Tier 1; country-specific data, known as Tier 2; and values derived from the most detailed methods, such as modeling, designated as Tier 3. The Tier 1 approach using default data serves as the primary reference in regions lacking Tier 2 and 3 EFs [6]. For mangrove CH4 emission, the default EF was identified as 193.7 kg CH4 ha⁻¹ y⁻¹ for tidal freshwater and brackish marshes and mangroves exhibiting salinity < 18ppt. Areas with salinity >18ppt were designated as 0 kg CH4 ha⁻¹ y⁻¹ for methane emissions [14].
Statistical Analysis
We assessed seasonal (rainy vs. dry) and spatial (mangrove area vs. non-forest control area) differences in various variables (pH, DO, water temperature, turbidity, NH4+, NO3-, PO43-, TN, TP) in water samples and air-water methane flux using the non-parametric Mann-Whitney U test. Significance was determined at p < 0.05. Additionally, Spearman’s rho test examined correlations between methane fluxes and different water and soil quality variables. Statistical analyses were conducted using SPSS 20.0 software for Windows.
Results and Discussion
Water and Sediment Physical-Chemical Characteristics
Surface water temperature in the mangrove area (RG and RTS) ranged from 26.0 to 31.9°C (average 29.3±2.5°C); DO: 5.3 - 8.0 mg/L (6.4±1.3mg/L); pH: 7.1 - 8.1 (7.6±1.2). In the non-forest control area (BL), temperature ranged from 27.8 to 33.5°C (31.1±2.9°C); DO: 4.2 - 6.7mg/L (5.4±1.0mg/L); pH: 7.3 - 7.8 (7.6±0.2). All DO and pH measurements met Vietnam’s National Technical Regulation on Marine Water for Aquatic Life Protection (QCVN 10: 2023/BTNMT).
The mangrove area showcased a diverse range of nutrient concentrations: NO3- spanned from 0.33 to 0.46 mg/L (average 0.41±0.12 mg/L), while NH4+ ranged from 0.17 to 0.36mg/L (0.25±0.09 mg/L), and PO43- from 0.01 to 0.06 mg/L (0.03±0.02 mg/L). TN ranged from 3.0 to 12.4mg/L (6.7±3.68 mg/L), and TP from 0.15 to 0.28mg/L (0.21±0.07 mg/L). Notably, ammonium concentrations exceeded permissible values, while phosphate levels were below regulatory limits. These findings underscore the substantial variance in nutrient content within the mangrove area, indicating a significant accumulation of nitrogen and phosphorus compared to nearby coastal regions. A comparative analysis conducted by Le et al. [15] on nutrient concentrations (in mg/L) from 36 samples of aquaculture coastal seawater in the Tien Hai district during 2019-2020 revealed: NO3--N: 0.05 to 1.22 (mean 0.37); NH4+-N: 0.02 to 0.39 (mean 0.13); PO43--P: 0.01 to 0.09 (mean 0.03); TN: 0.79 to 1.86 (mean 1.08); TP: 0.03 to 0.28 (mean 0.12). These findings indicate significantly higher nutrient concentrations, particularly in TN and TP, within the mangrove forest area compared to the neighboring Tien Hai and Thai Binh coastal areas, which represent the adjacent estuary. This observation corroborates similar findings from various global studies, including those conducted at Dongzhai Port, China [16]; Yunxiao National Mangrove Reserve and Zhangjiang Estuary, Southeast China [17]; and San Juan Bay Estuary, Puerto Rico, United States [18].
Higher water temperatures were observed in the BL area compared to mangrove areas (p<0.05). Conversely, DO concentration (p<0.05), turbidity (p<0.01), and nutrients (NO3¬ and PO43-) were lower in the BL area. No distinct spatial variations were noted for other monitored parameters (Table 1). Comparing water quality between old and young mangrove areas, lower temperatures were observed in RG, while NO3¬ and PO43- concentrations were higher (p<0.05). Other parameters showed no statistically significant differences between these two forest areas (Table 2).
Table 1.
Water quality in mangrove forest and non-forest control area.
Table 2.
Seasonal variable in water quality, Xuan Thuy mangrove areas.
Seasonally, in mangrove areas, average water temperature (p<0.01) and TN concentration (p<0.05) were lower during the dry season than in the rainy season, whereas DO, pH, salinity and turbidity were higher in the dry season than the rainy one (p<0.05). Higher TN concentration in the rainy season implied the sampling sites received input from terrestrial sources through the river. Since the sites were located inside the mangrove, which were not directly impacted by the river flow and current, so lower salinity, and turbidity in the study area were detected because of the dilution effect during the rainy season.
The sedimentary environment quality of the research area was reported in the previous study [9]. The mangrove forest areas were different from the non-forest control area by the accumulation of C, N, and P components in the sediment. The old-stand forest stored more C and N in its sediment than the young-stand forest, which had less P component. The influence of hydraulic dynamics in the non-forest control area (BL area) leads to a mixture and no stratification in the soil sample collected in this area.
CH4 Fluxes
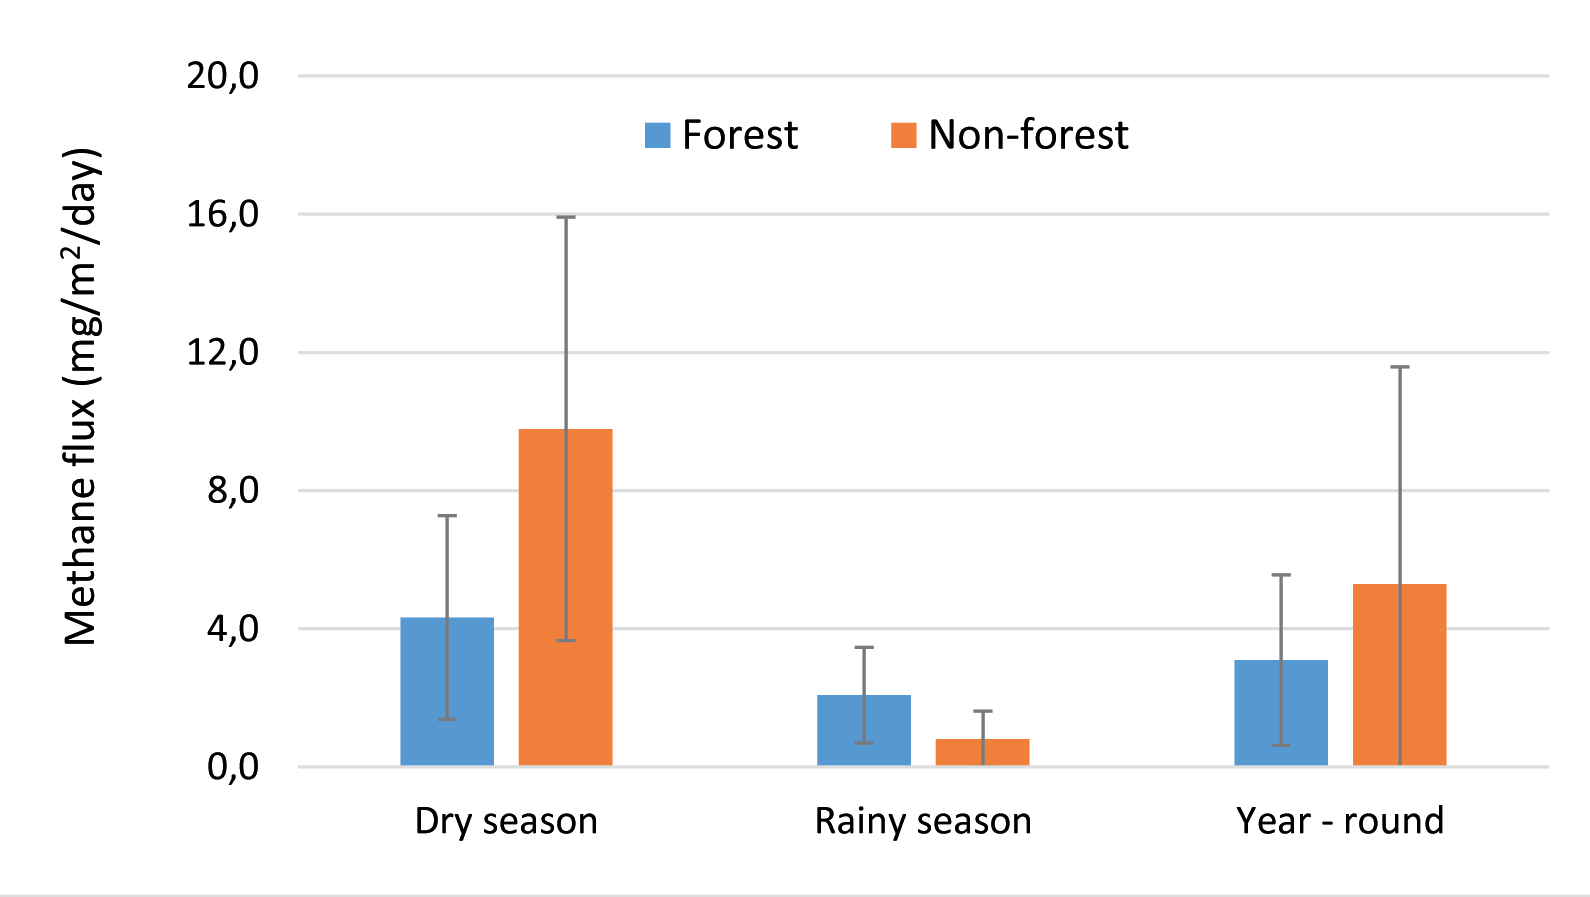
As seen in Fig. 2, throughout both seasons, methane (CH4) fluxes within the mangrove forest and non-forest control areas ranged from 0.01 to 10.42 (mean value: 3.09 ± 2.47) and 0.04 to 16.76 (5.30 ± 6.28) mg m−2 day−1 (equivalent to 0.001-0.649, 0.193±0.154, and 0.002- 1.044, 0.330±0.391 m mole m−2 day−1), respectively. No significant differences were observed in CH4 fluxes between these two areas (p > 0.05). Similarly, during the rainy season, average CH4 emissions were 2.08±1.39 mg m−2 day−1 in the mangrove forest and 0.81±0.80 mg m−2 day−1 in the control area, also lacking significant differences (p>0.05). However, in the dry season, emissions from the forest area (4.33±2.95 mg m−2 day−1) were lower compared to the control area (9.79±6.13 mg m−2 day−1) (p<0.05).
Notably, the average CH4 flux in the RG area was significantly higher (p<0.05) than that in the RTS area (3.81±2.42 mg m−2 day−1 and 2.33±2.36 mg m−2 day−1, respectively) over the two seasons. This trend persisted in the rainy season (RG: 2.81±1.76 mg m−2 day−1; RTS: 1.43±1.14 mg m−2 day−1) (p<0.05) but not in the dry season (RG: 4.81±3.31 mg m−2 day−1; RTS: 3.68±2.87 mg m−2 day−1) (p>0.05). This discrepancy may result from higher organic carbon accumulation in the RG as opposed to the RTS [9].
Seasonal variation analysis displayed consistent methane emissions in the old-stand forest area and a distinct increase in emissions during the dry season compared to the rainy season in the RTS and BL areas, as seen in Table 3.
The estimated methane flux in the Xuan Thuy mangrove area at 0.04 to 38.03 (11.28±9.02) kg CH4 ha-1 yr-1, significantly lower than the IPCC’s default EF of 193.7 kg kg CH4 ha-1 yr-1. Caution is advised during kg CH4 ha-1 yr-1 greenhouse gas inventory in mangrove areas to avoid overestimation, necessitating further research on methane emissions in wetlands and mangrove forests for more accurate country-specific values.
Table 3.
CH4 emissions in mangrove forests and non-forest control areas.
Moreover, Ha’s study [19]on carbon stock and flux in planted mangroves at Xuan Thuy National Park reported an average water-air carbon emission by CO2 gas of 1.15 MgC ha-1 year-1. These findings indicate additional carbon emissions due to methane emission, averaging 3.09 ± 2.47 mg CH4 m−2 day−1 or 0.00864 ± 0.0069 MgC ha-1 year-1. This increment represents a 5.76% increase in water-air interface carbon emissions.
CH4 Emission Comparison with other Mangrove Areas
Methane emission in the study area was in the range of worldwide estuary. Other than freshwater sites, methane emission (0.02-0.5 mmol m−2 day−1) as mentioned by Abril and Borges [20] 0.02-0.5 mmol m−2 day−1 and was comparable to the value reported from the Avicennia mangrove site, Can Gio Mangrove Forest, Hochiminh City, Vietnam [3]. The Xuan Thuy methane emission rate in this study was higher than the values reported from Ranong Biosphere Reserve, Thailand [21], Red Sea, Saudi Arabia [22], Rhizophora mangrove site at Can Gio Mangrove Forest, Hochiminh City, Vietnam [23], but lower than those reported values from the Fitzroy River, Johnstone River, and Burdekin River mangrove creeks, Australia [24]; mangrove forest in Ouemo, New Caledonia [25]; Sundarban mangrove ecosystem, state of West Bengal, India [26], and Dongzhaigang National Nature Reserve, China [27] about 2, 6, 9-20, 12 and 27 fold, respectively (Table 4).
Relations Between CH4 Fluxes and Environmental Factors
Several environmental factors influence methane (CH4) flux rates in mangrove areas. Past research indicates that CH4 flux rates in these regions vary based on soil temperature, salinity, pH, substrate availability, and the anaerobic environment necessary for methanogenesis due to tidal inundation and agricultural chemical input [30]. For instance, studies by Hu et al. [31] found a significant positive correlation between water temperature and CH4 fluxes, while atmospheric pressure displayed the opposite correlation. The study of Poffenbarger et al. [32] on methane emissions in 31 tidal marshes observed a significant log-linear relationship with salinity across different water sources. Other studies [30, 33] demonstrated that higher salinity restricts CH4 emission due to its inhibitory effect on methanogen activities. Additionally, since CH4 generation occurs in anaerobic environments, lower Oxidation-Reduction Potential (ORP) inversely affects CH4 emissions [34]. A study in the mangroves of southeastern China [35] found no significant effect of factors like plant species, tidal position, or soil characteristics on CH4 efflux, attributing CH4 emissions to nutrient inputs from anthropogenic activities like aquaculture. On the other hand, methane emissions control factors in mangroves in southeast Mexico were varied by study sites, which were carbon sequestration and soil pH. They both had an inverse relationship with methane emissions [36]. Land use/ land cover changes are also the driving force of CH4 generation. The research of Das et al. [26] revealed that the highest CH4 generation area was the mangrove-deforested agricultural lands, while the lowest produced region was the coastal mangrove forested region. This agrees with Zheng et al. [35], who reported that, on average, undisturbed mangrove sites have very low CH4 efflux rates.
The Spearman’s rho correlation test revealed a notably positive correlation between CH4 fluxes and water pH (R = 0.63, p < 0.05), as well as turbidity (R = 0.78, p < 0.01) and a negative correlation with water temperature (R = -0.73, p < 0.05) and TN concentration (R = -0.69, p < 0.05). Our analysis supports the findings of Hernández and Junca-Gómez [39] regarding the correlation between water pH and CH4 emission, although it contradicts Hu et al.’s [31] correlation between water temperature and CH4 emission. As per the Smith and Conen [13] equation, which shows an inverse relationship between ambient temperature and CH4 flux, our results appear reasonable. However, we did not find any statistically significant correlation between CH4 flux and parameters such as DO, salinity, and nutrients (NH4+, NO3-, PO43-, and TP) in water samples.
Table 4.
Methane emission from different mangrove forests.
Table 5.
Spearman’s rho correlation between CH4 fluxes and soil quality variables in the study area.
Regarding soil environmental factors influencing CH4 emission, Spearman’s rho test was also applied to each soil layer (0-5 cm, 15-20 cm, 35-40 cm) and a composite sample. The analysis showed a significant negative correlation between CH4 emission and sediment properties like pH, Dissolved Organic Carbon (DOC), and Total Organic Carbon (TOC), as presented in Table 5. Specifically, in the mangrove area, DOC (R = -0.78; p < 0.05) and TOC (R = -0.73; p < 0.05) were significantly inversely correlated with CH4 emission in the deeper soil layers. A similar negative correlation between DOC, TOC, and CH4 emission was observed in both the old-stand and young-stand forests, primarily in the middle and deeper layers (-0.94 < R < -0.71; p < 0.05). This indicates that more favorable anaerobic conditions in these layers stimulate methanogens activities, resulting in increased consumption of carbon substrates and the subsequent negative correlation observed between CH4 emission and TOC and DOC in these layers. Additionally, a significant negative correlation between pH and CH4 emission was found in the old-stand forest, consistent with a previous study [36] reporting a negative relationship between CH4 emission and soil pH. However, we did not identify statistically significant correlations between other variables like soil salinity, redox potential, nutrients (NH4+, NO3-, PO43-, TN and TP), and CH4 emission.
Conclusions
The study results offer compelling evidence highlighting the discrepancy between actual methane emissions observed in the Xuan Thuy mangrove area and the default estimations proposed by the IPCC. The observed methane flux rates, notably lower than the default values, cast doubt on the reliability of generic estimations suggested by international guidelines. These findings strongly advocate for precise, site-specific monitoring methods to ensure accurate assessments of greenhouse gas emissions, particularly within mangrove ecosystems. Additionally, the study emphasizes the intricate relationship between methane emissions and various environmental factors. Factors such as temperature, pH, turbidity, and nitrogen content in water, as well as pH, DOC, and TOC in soil, play significant roles in influencing methane emissions. Understanding these controlling factors is crucial for both understanding and managing greenhouse gas emissions within mangrove ecosystems. Furthermore, this study highlights the potential implications for greenhouse gas inventory and policy development. Relying solely on default values for emissions could lead to substantial overestimations, stressing the need for meticulous and site-specific monitoring practices. The importance of site-specific data over generic estimations becomes evident in environmental management and policy development, ensuring informed decision-making and accurate assessments. Considering the geographical distribution of Vietnam’s mangrove forests across four zones and twelve subzones (North-east coast: three subzones, Northern delta: two subzones, Central coast: three subzones, and Southern delta: four subzones), it becomes imperative to conduct future investigations to provide more precise evaluations of methane gas emissions. Using Tier 2 emission factors, rather than the default Tier 1 emission factors set by the IPCC, for each subzone’s mangrove forest can contribute significantly to more accurate estimations of methane emissions.

