

Introduction
Increasing ecological pollution, etc., caused by human activities in urbanization, destabilizes ecosystems and exposes the vulnerability of urban ecosystems, leading to increased risk effects [1]. Urban development must emphasize ecological resilience and the ability to cope with disasters; early warning and emergency management systems need to be strengthened to reduce risk losses, which improves the ability to respond to external weather, geological and environmental threats, internal economic, demographic, and resource pressures [2]. Therefore, the core task of current urban governance should shift from reducing vulnerability to increasing resilience [3]. Applying the concept of “resilience” can significantly improve the ability of urban ecosystems to cope with threats and disturbances [4].
Resilience is derived from the Latin word meaning resilience or elasticity. It originated in mechanics to describe the ability of a substance to recover its initial state after being subjected to an external force [5]. It was later introduced into urban studies to represent cities’ adaptive and resilient capacity in the face of extreme disturbances and persistent stresses and promote sustainable municipal development. As a result, the concept of “resilient cities” or “urban resilience” has emerged. The term “ecosystem resilience” was defined by an American scholar named Holling in 1973 to refer to the persistence of natural systems in response to change [6]. Berkes and Folke emphasize “convertibility” from a social-ecological system (SES) perspective [7]. Urban ecological resilience research is related to landscape ecology, and early foreign studies emphasized quantitative methods, such as the landscape pattern index developed by Turner and Gardner [8], which described that it can reflect landscape structure, spatial configuration, and heterogeneity, providing an important means of assessing the ecological environment [9].
With the development of landscape ecology in China, scholars have carried out several Multi-Order Adjacency Index (MAI) analyses. Liu et al. [10] used MAI to analyze the change process in the expansion of urban landscape patterns. They used geo-detectors to analyze the determinants of the driving factors affecting the spatial differentiation of their expansion. They discovered that the main factors contributing to the spatial heterogeneity of urban landscape expansion were socioeconomic factors. Zhang et al. [11], by devising a novel framework for evaluating Ecological Resilience (ER) through the lens of landscape dynamics and ecological processes, the study delved into the diverse factors influencing ER. Analysis has found significant differences in the contribution of urbanization components to Ecological Resilience (ER) among different cities, with population-related factors proving to have the most direct and far-reaching impact. Song et al. [12] designed a comprehensive evaluation model for urban landscape ecological health (LEH) that considers patterns, processes, and functions, providing a solid scientific foundation for planning their landscape ecological network. Urban ecological risk evaluation and ecological resilience assessment are crucial for revealing ecological security problems and formulating response strategies. Ecological resilience evaluation is an important way to measure urban security, and evaluation methods include landscape ecological modeling method, ecological modeling method, digital ground modeling method, and mathematical modeling. The most commonly used models are PSR [13], DSR [14], DPSEEA [15], and DPSIR [16, 17]. However, the existing system of indicators of influencing factors needs to be more diverse and fully reflect the multifaceted influencing factors of urban environmental resilience. Therefore, the research methodology is based on Luoyang as an example of assessing urban ecological resilience in depth through data collection and statistical analysis. Constructing a “risk-connectivity-potential” framework to understand the composition and evolution of urban ecological resilience comprehensively.
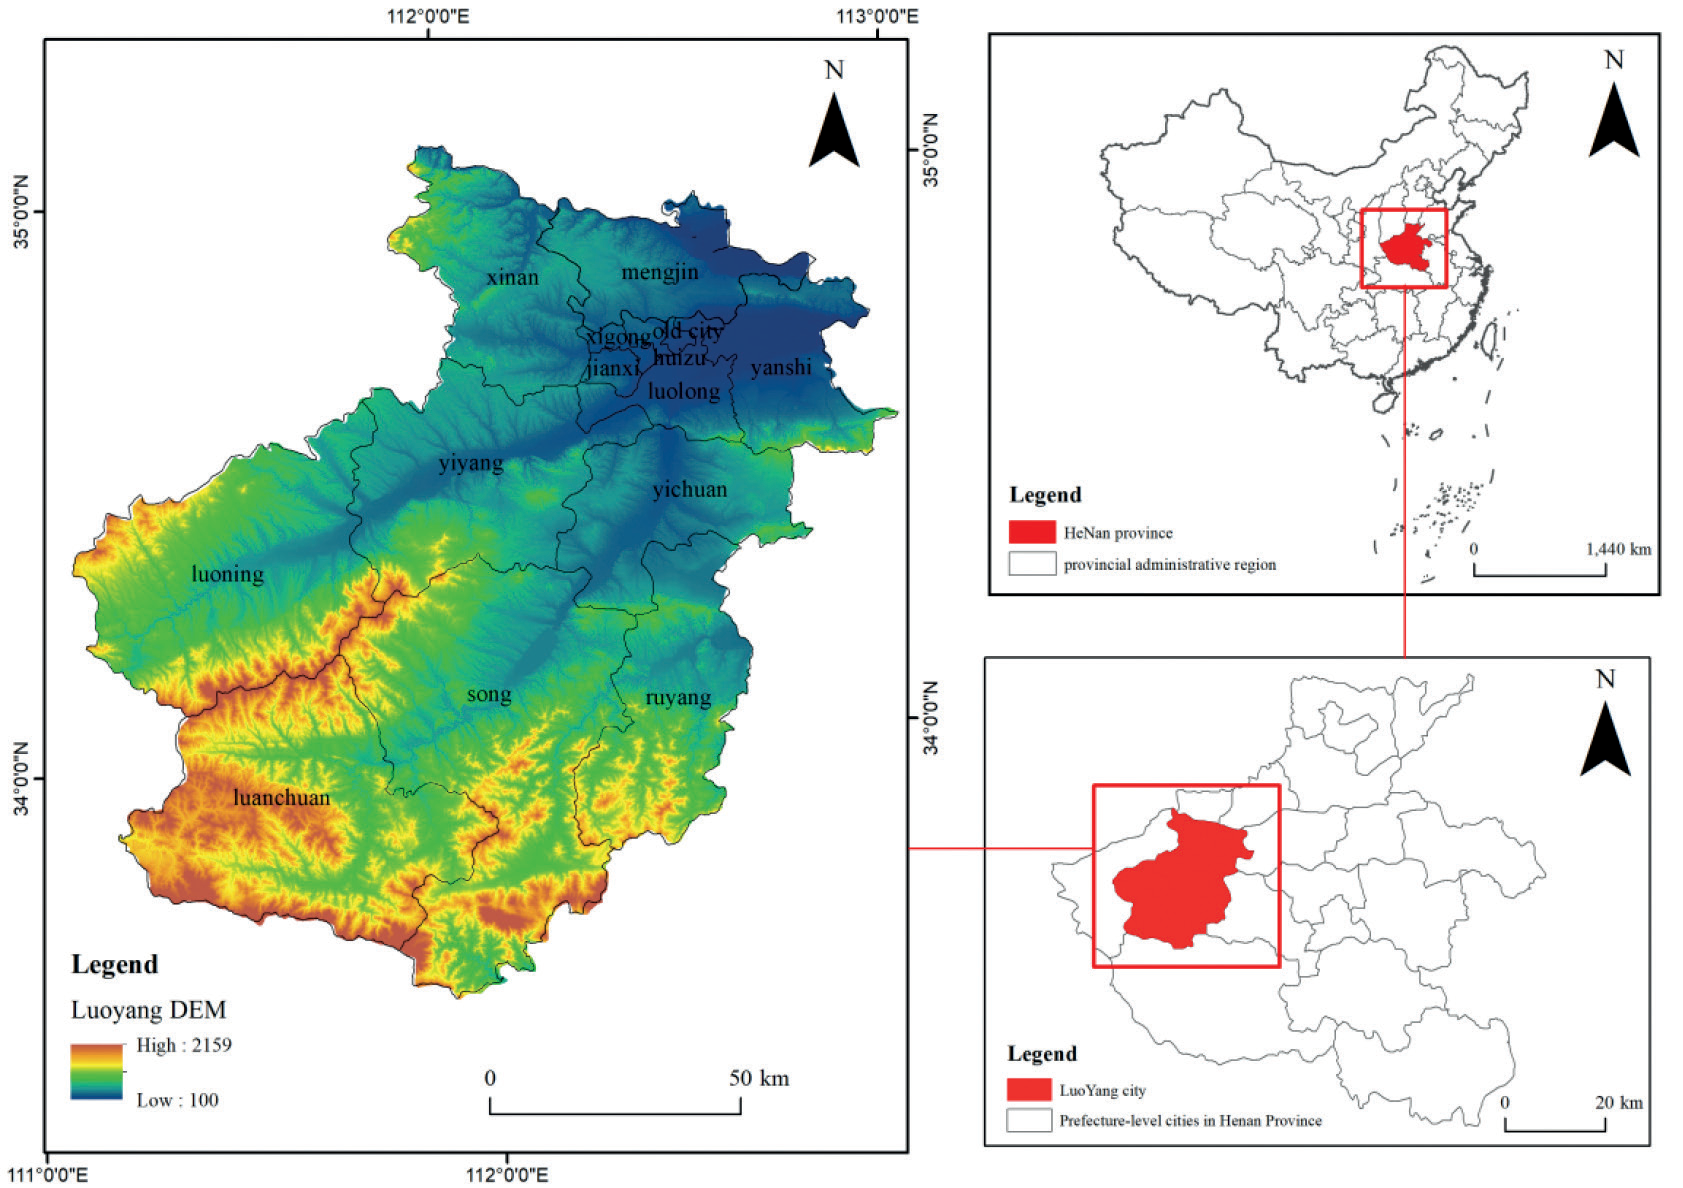
The study aims to understand the nature and laws of urban ecological resilience and provide references and lessons for urban development to Luoyang’s favorable geographic location and rich ecological resources make it an ideal place for ecological research (Fig. 1). Located at the confluence of the Yellow River ecological corridor with the Funiu and Taihang Mountains, it possesses superior river and mountain resources. As a national forest city and a key forest area in Henan Province, the forest coverage rate far exceeds the provincial average, demonstrating strong ecological resilience and vitality [18]. Luoyang has a complex and diverse topography with interlocking mountain ranges, providing a solid foundation for ecological development. In building an ecological civilization, Luoyang adheres to the ecological priority and implements the strategies of land space optimization, ecological economic development, and environmental quality improvement with environmental quality as the core. An in-depth analysis of Luoyang’s ecological resilience development history and current situation provides a reference for other cities.
This study utilizes Landsat-8 remote sensing images provided by the Geospatial Data Cloud Platform for 2005, 2010, 2015, and 2020, processed with geometric correction and image enhancement, with a resolution of 30 m×30 m. Combined with the national standards and the actual situation in Luoyang City, the ENVI software is used to classify land use into six categories: arable land, forest land, grassland, watersheds, construction land, and unutilized land. A 1 km×1 km grid was created and 15,720 grids were calculated respectively, and the deciphered data were statistically analyzed using Fragstats software to obtain several landscape pattern indices, reflecting the spatial distribution and change characteristics of land use. At the same time, through the collection of the “Luoyang Statistical Yearbook,” “Henan Statistical Yearbook,” and other data, a comprehensive understanding of the consumption of ecological resources in Luoyang City provides a scientific basis for ecological protection and sustainable development.
Materials and Methods
Ecological Risk Assessment
The ecological risk index was constructed using landscape disturbance degree, loss degree, vulnerability index, and expert scoring method. The method proposed by the [19] was adapted to measure the spatial distribution characteristics of ecological resilience in Luoyang City (Supplementary Equation 1).
Ecological Connectivity Analysis
The spatial connectivity of landscape types in urban ecosystems is critical for assessing cities’ spatial dispersion and ecological resilience in the face of pressures and risks [20]. Connectivity is influenced by landscape structure and the connectivity status of key ecological landscapes. To quantify connectivity, a comprehensive connectivity index C was introduced, in which the spread index CONTAG quantifies overall landscape connectivity, and the patch cohesion index COHESION assesses woodland connectivity. Each of the two weights 0.5 by using the formula Supplementary Equation 2.
Ecological Potential Analysis
Considering the small-scale characteristics of the study area and revising the national unit area value equivalent. The ecosystem service value equivalents of cropland, forest land, grassland, watershed, unutilized land, and construction land in Luoyang City were obtained by using the average value equivalents of farmland, forest, meadow, and grassland values, the value equivalents of the water system and desert and the results of the previous studies [21], respectively. Obtain the unit area value equivalent to Luoyang City. It is divided into 5 levels using the natural breakpoint method: low-value area, lower-value area, medium-value area, high-value area, and higher-value area. The calculation formula is as follows in Supplementary Equation 3.
Standard Deviation Ellipse Analysis
The standard deviation ellipse can quantitatively describe the spatial dispersion of the research object, and the migration trajectory of the center of gravity can reflect the changes in things [22]. This method accurately elucidates the pattern of economic spatial allocation and rigorously analyzes the inherent spatial distribution characteristics of discrete datasets [23]. The standard deviation ellipse is calculated as given in Supplementary Equation 4.
Spatial Autocorrelation Analysis
Spatial autocorrelation [24] is a spatial data analysis method. To test the spatial aggregation trend of ecological resilience and subsystems, the global MORAN index was selected for assessment (Supplementary Equation 5).
Table 1.
Introduction to driver factor raster data.
Geo-Detection with Optimal Parameters
Geographic detectors [25] evaluate the explanatory power of various variables on ecological resilience. It can eliminate the mutual influence between multiple independent variables [26, 27]. Ten key driving factors were selected: natural environment, socio-economic factors, and geographical location (see Table 1). In the process of parameter optimization, to ensure the accuracy and effectiveness of the research, 11 different spatial scales were designed [28], specifically 0.5 km, 0.75 km, 1 km, 1.25 km, 1.5 km, 1.75 km, 2 km, 2.25 km, 2.5 km, 2.75 km, and 3 km. These scales correspond to the generation of 60840, 27033, 15204, 9752, 6757, 4961, 3808, 3004, 2427, 2020, and 1700 grids, respectively, to analyze the influencing factors of urban ecological resilience in a more detailed and comprehensive manner, by setting classification and selecting the optimal solution based on the Optimal Parameter Geographic Detector Model (OPGD), comparing the q values at different scales to determine the optimal analysis scale and reduce analysis bias. After optimization, it can more accurately identify the factors that affect the ecological resilience of the city, providing strong guidance for the improvement of ecological resilience in Luoyang. Research has found that a grid size of 2 km is the optimal analytical scale, which can accurately reflect the impact of potential variables and provide a reliable basis for formulating improvement strategies. The calculation formula is as follows in Supplementary Equation 6.
Results
“Risk” Evaluation Indicators
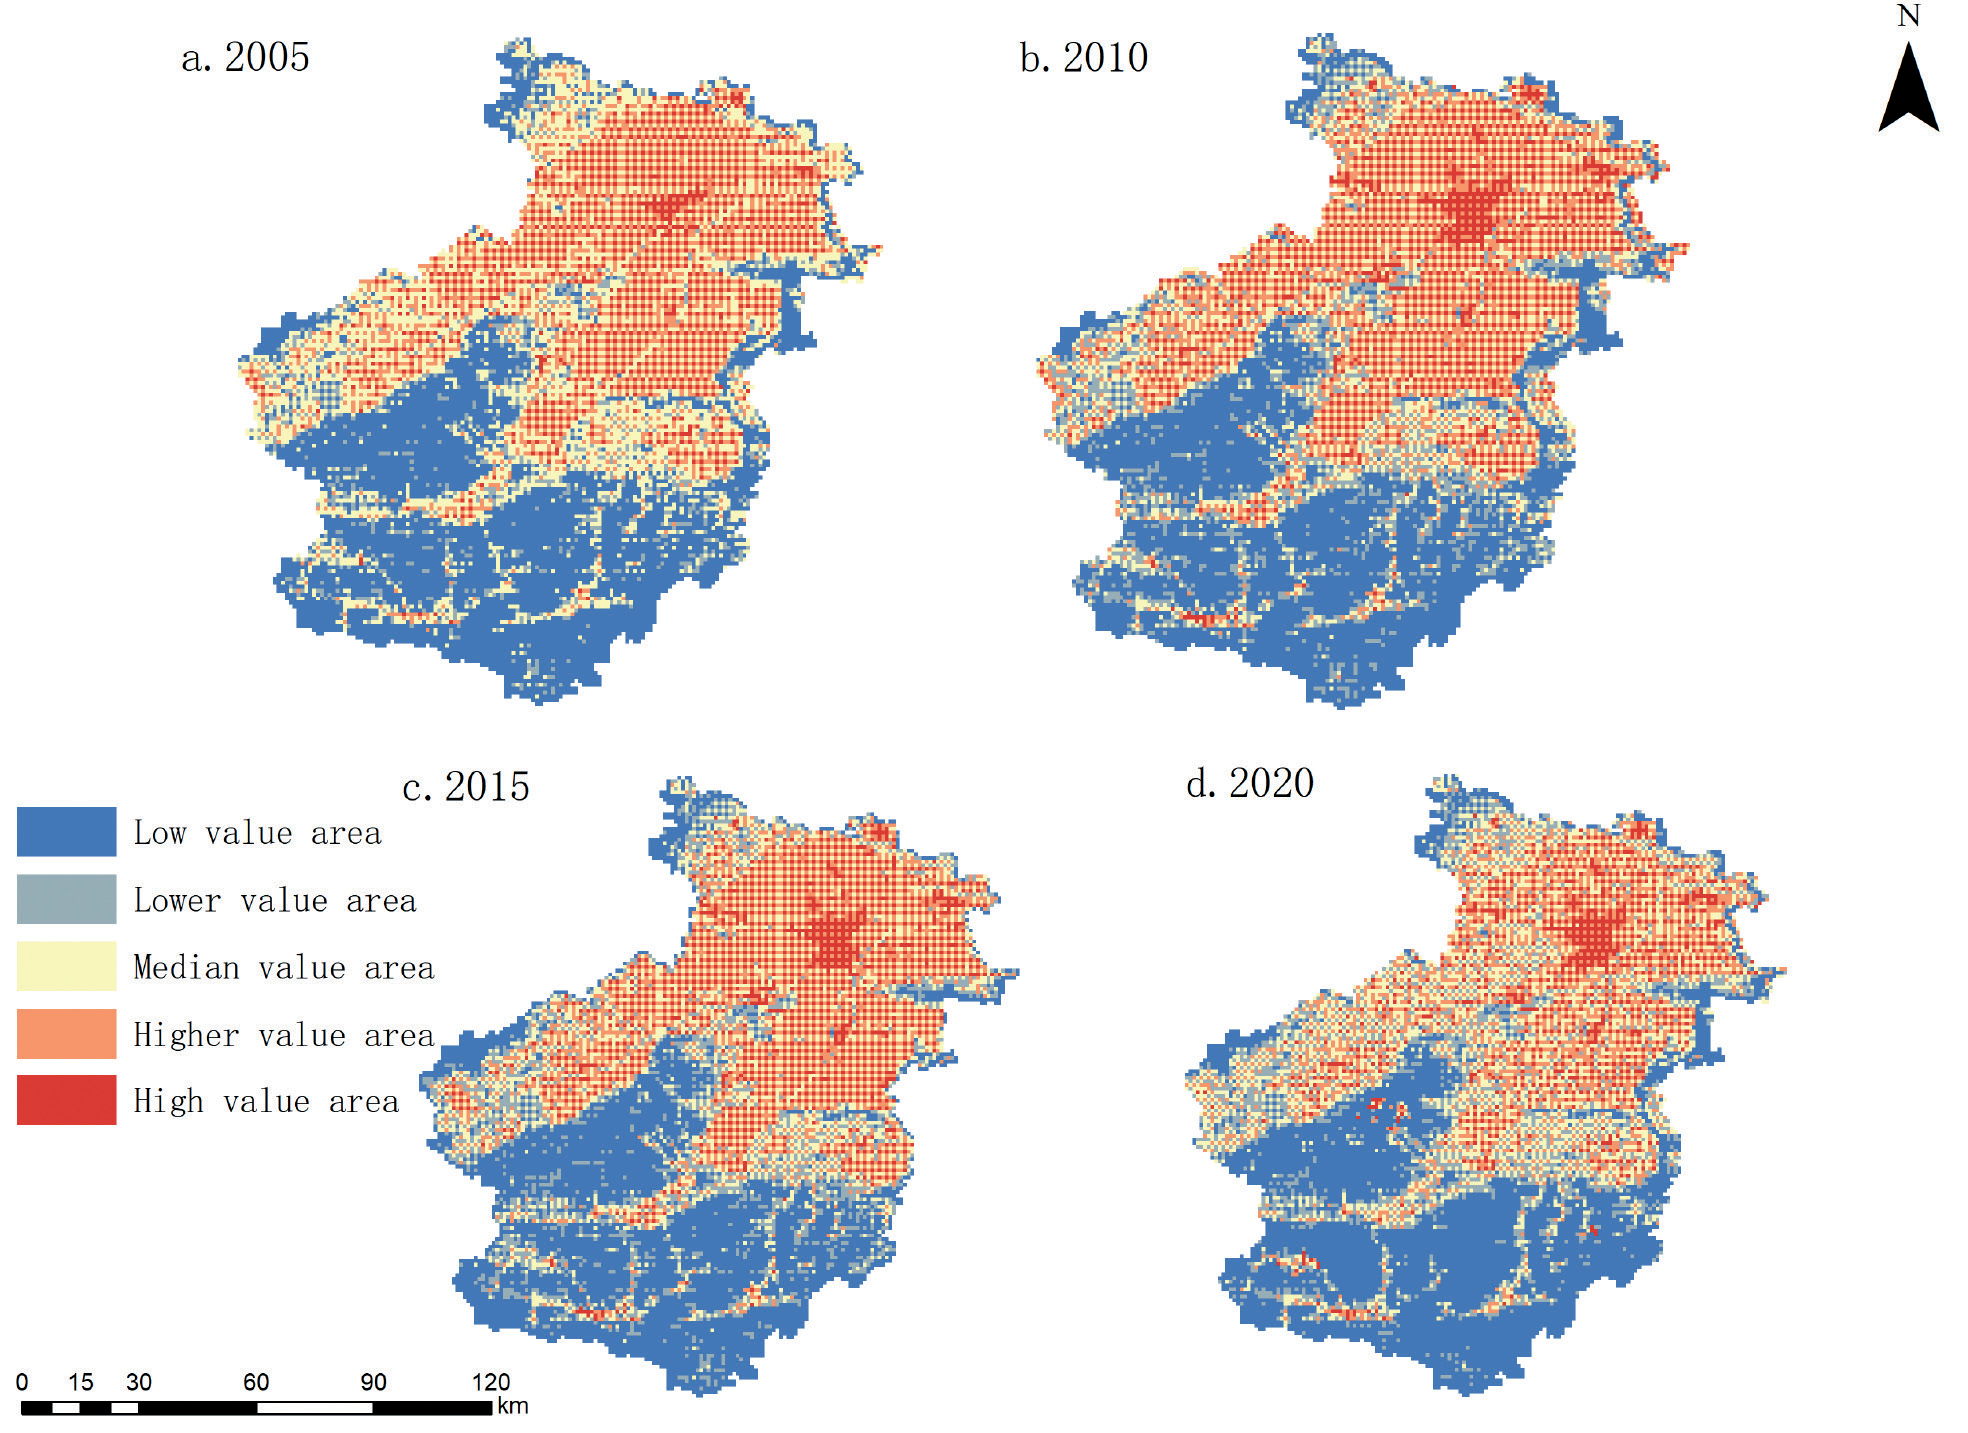
Results generated a detailed land use classification table using urban image data, counting the number of landscape ecological patches and the area of the patches (Fig. 2). The ecological risk index was calculated. The findings revealed notable variations in the spatial configuration of ecological risk throughout the examined period. It is specifically shown that the ecological risk is higher in the northern region, while the southern region is relatively lower. The high-risk areas are mainly concentrated in the urban area of Luoyang city center, including the old city, Xigong District, Chanshui River Huiyuan District, and Jianxi District and other densely populated areas, where the ecological environment is under greater pressure due to the high population density and frequent construction activities.
On the contrary, low-risk areas are mainly located in Yiyang, southern Luoning County and northern Song County, Luanchuan County, Ruyang County, and other forested areas, which are characterized by lush vegetation and good ecological conditions and thus have low ecological risks. In addition, medium- to high-risk areas are mainly located in construction land areas around the central urban area and unutilized land areas, such as Xin’an County and northern Yiyang. Although these areas are not central urban areas, their ecological risks are relatively high due to urban expansion and construction activities. The study also finds that lower ecological risk areas are scattered throughout the study area, most of which are connected to lower risk areas, mainly forested and cultivated land.
Evaluation Indicators for “Connectivity”
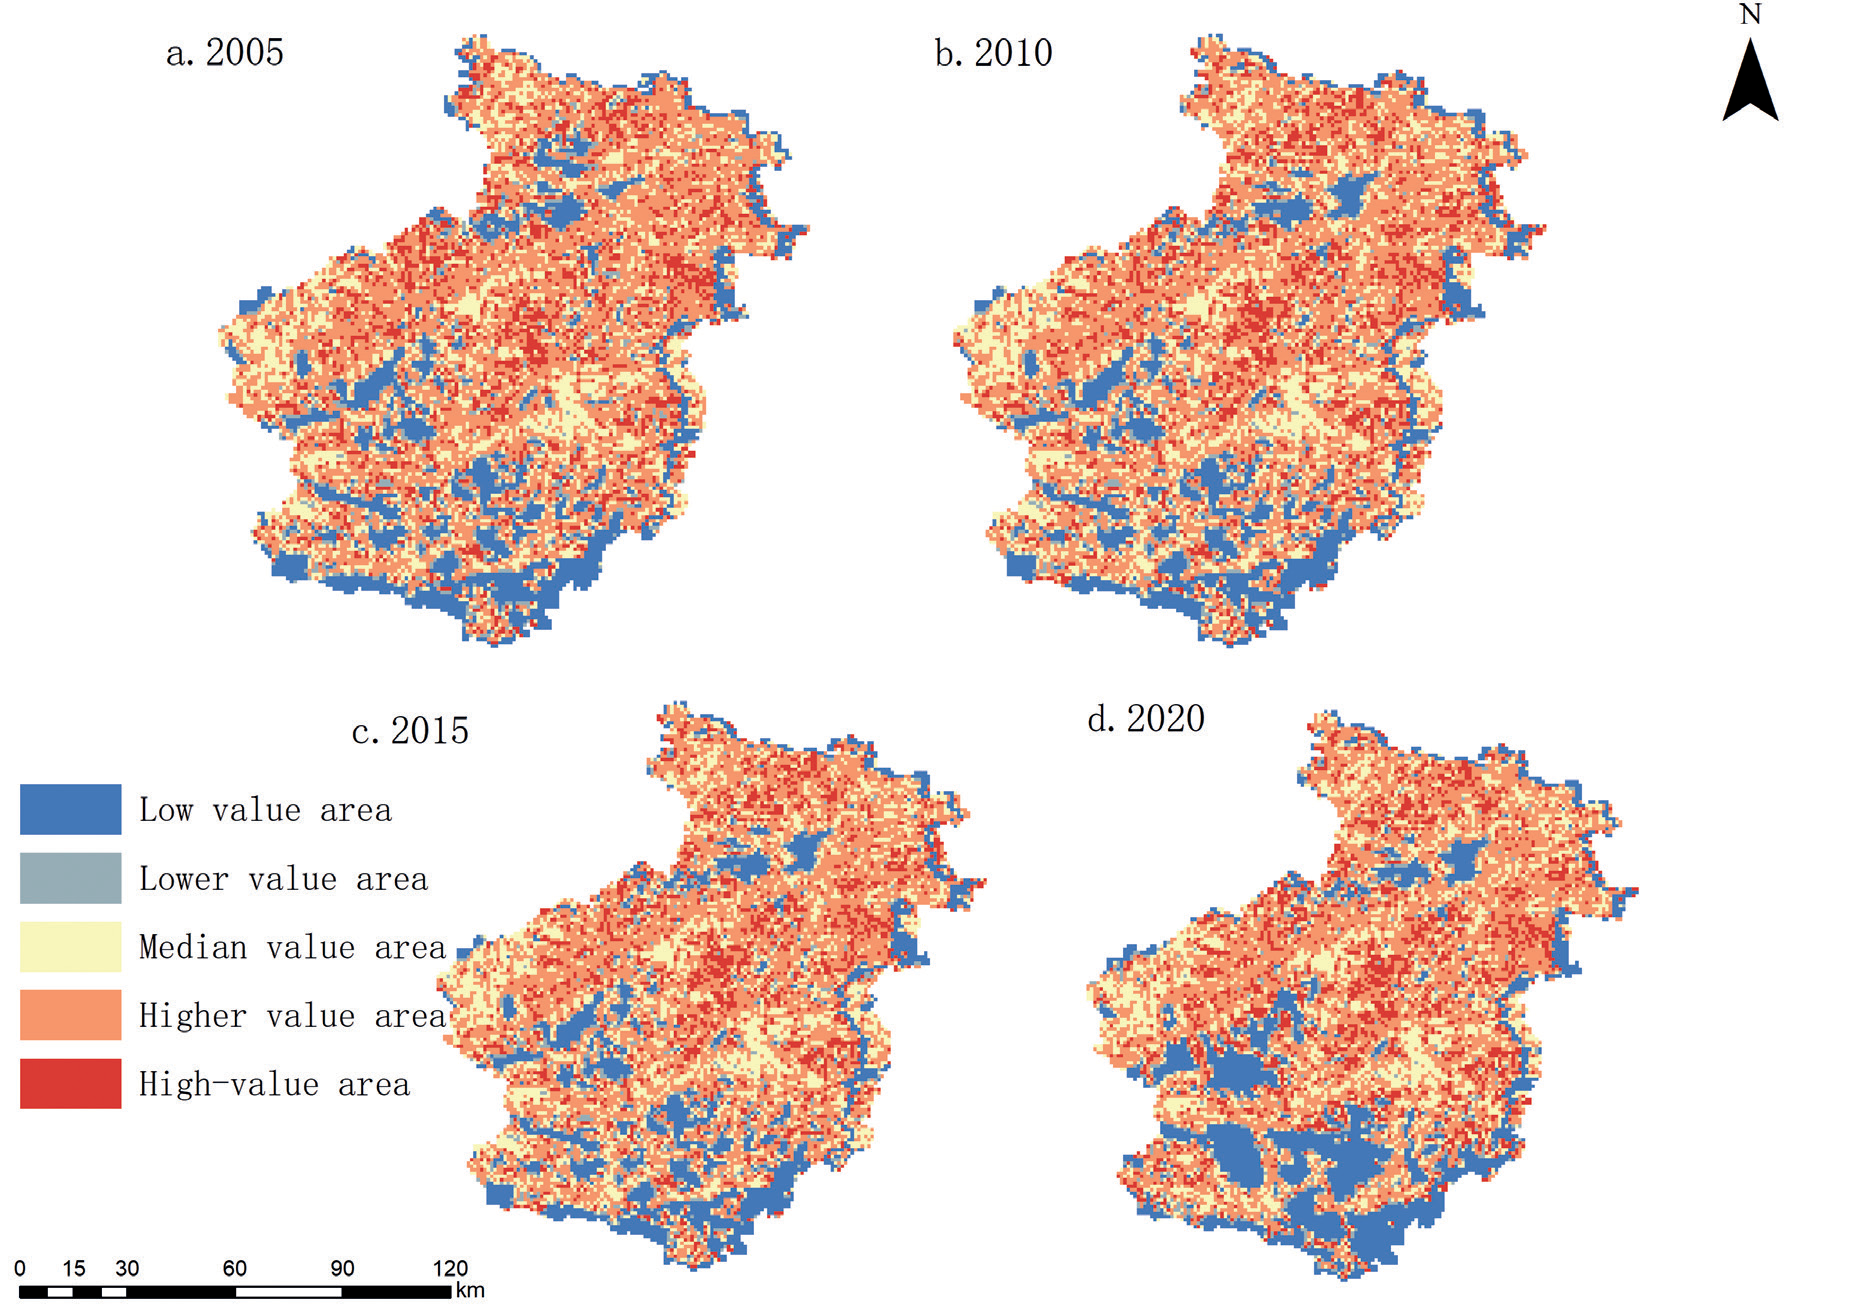
The pattern of connectivity distribution in the study area remained the same from 2005 to 2020 (Fig. 3), with lower connectivity in the west and south and higher in the northeast. High-value areas are concentrated in Songxian and Yichuan counties in patches and blocks; low-value areas are mainly distributed in the central and southern parts of the city, dominated by construction land and unused land with irregular patterns. The connectivity in the central area is mostly moderate, consisting of scattered grasslands and croplands. Over time, there is a clear trend of decreasing low-value zones in the north-central part and increasing high-value zones in the northeast and east. The construction of towns and intensification of human activities in the south led to the fragmentation of patches and the expansion of low-value zones. The spatial heterogeneity and changing trend of connectivity reflect the impacts of the natural environment and human activities and are important for the formulation of land use and ecological protection policies. With the accelerated construction of towns and cities in the south due to increased human activity intensity, patch fragmentation has been strengthened. This further led to the expansion of low-value areas. Overall, the connectivity of the study area showed some spatial heterogeneity and changing trends between 2005 and 2010. These changes reflect the natural environment’s characteristics and are closely related to human activities and urban development.
Indicators for Evaluating “Potential.”
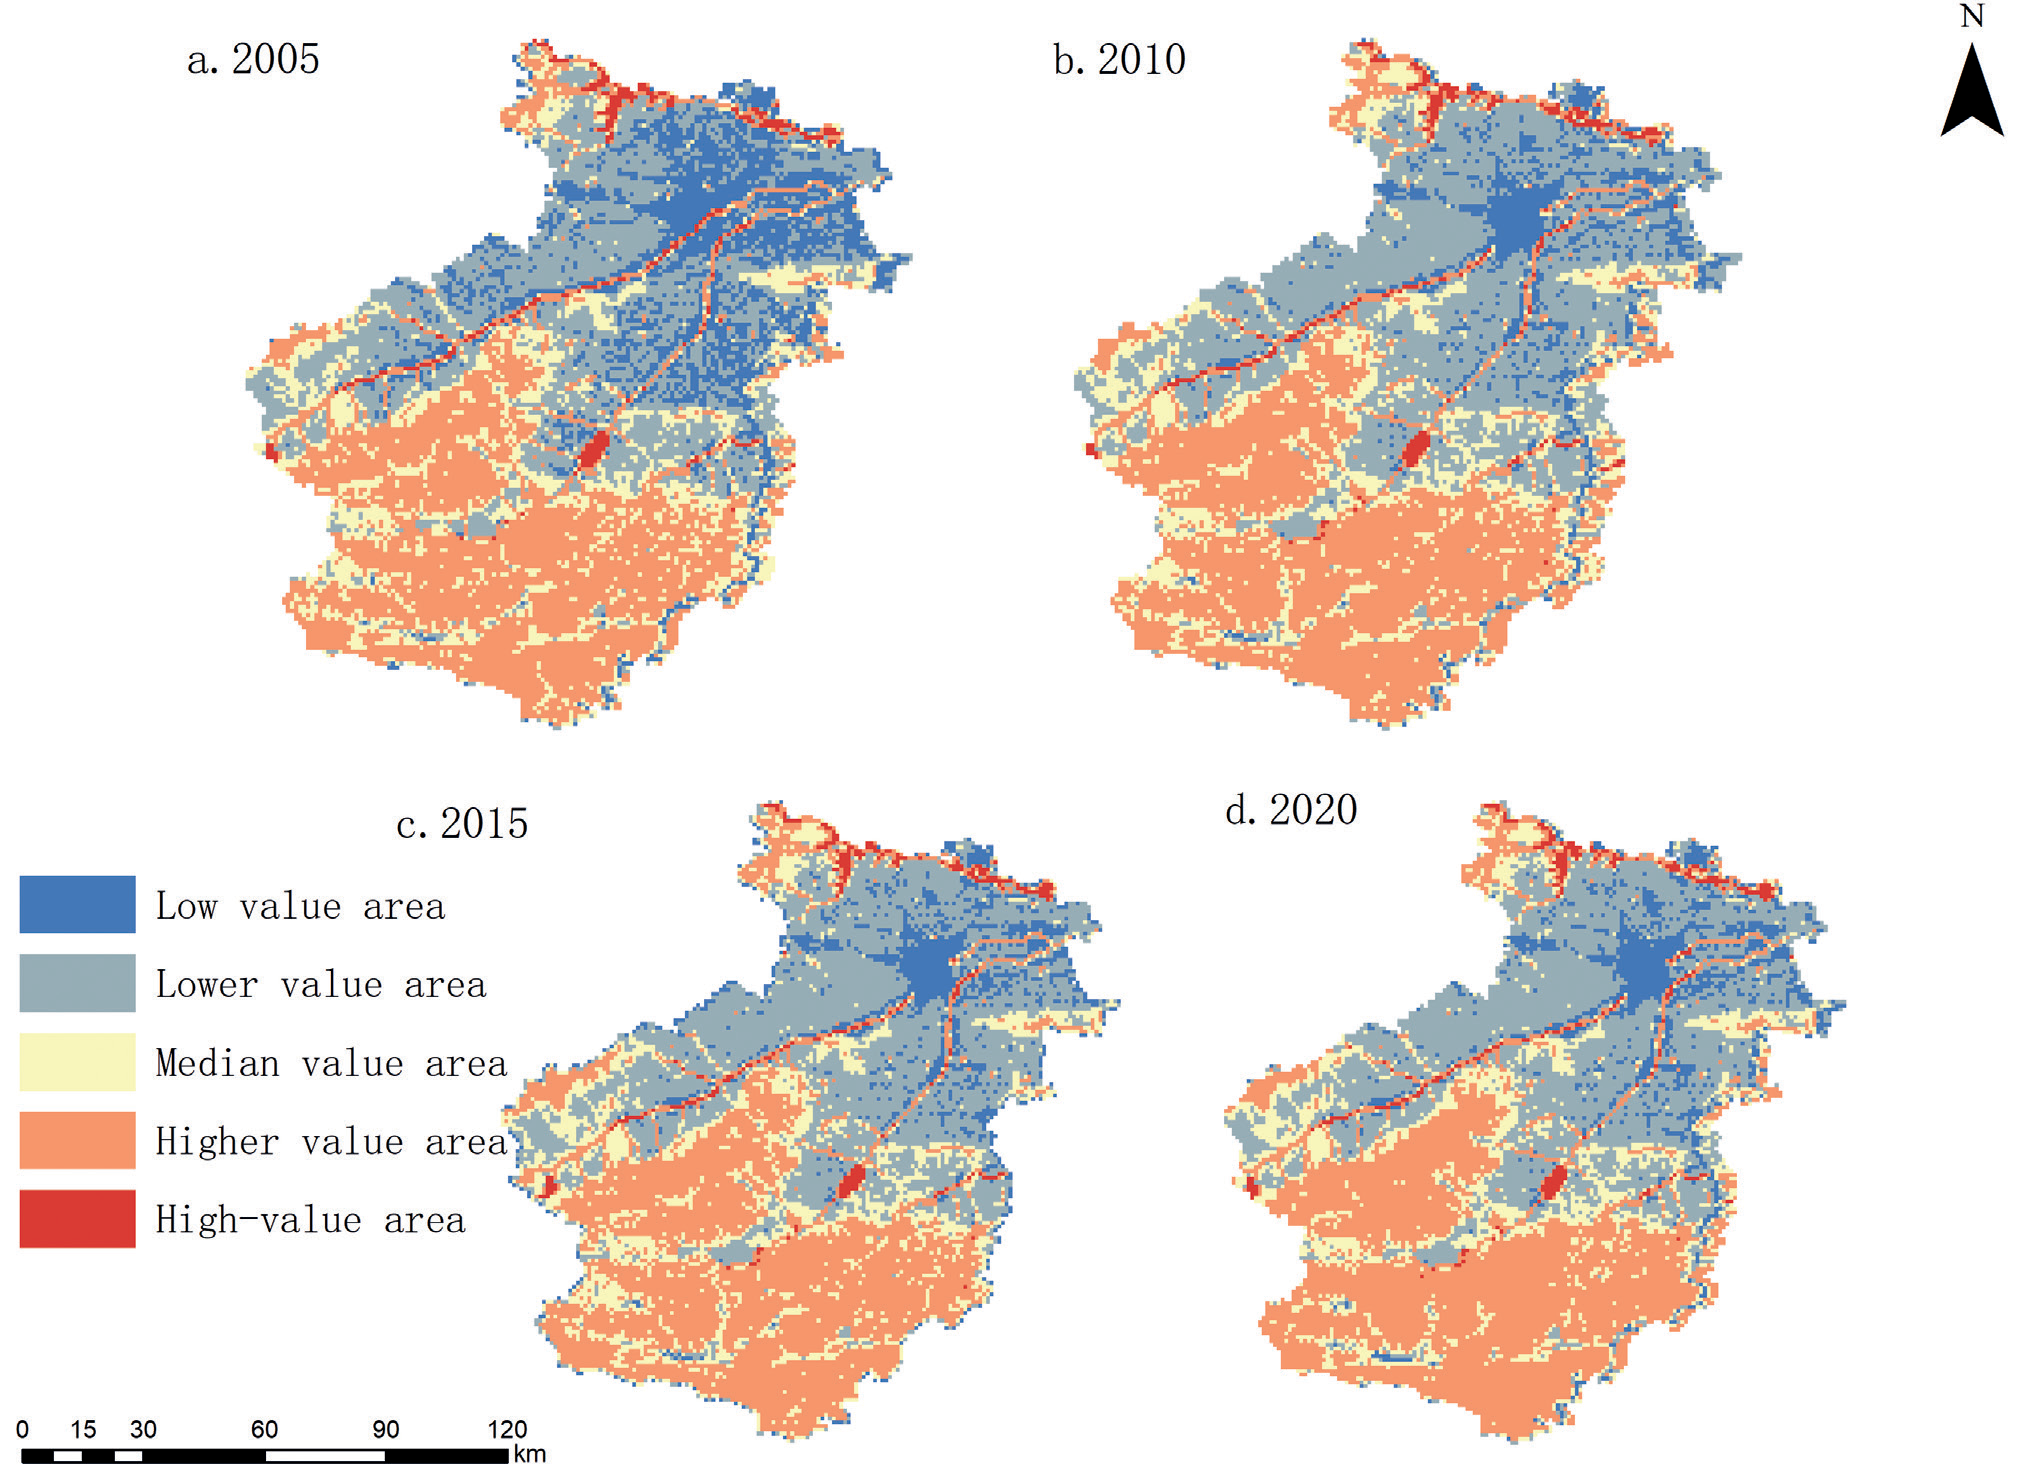
Central to evaluating ecosystem service values lies in translating the economic worth of the mean natural crop yield within the study region into standardized ecosystem service value equivalent units. Referring to related studies and using the biomass factor table developed by [29], the service value of each equivalent was calculated to be 1636, 1846, 1988, and 2091 yuan-hm2, respectively, with corrections for Henan Province. To demonstrate the changes in the potential pattern, the ecosystem service values were standardized and classified into five grades (Fig. 4).
During the research period from 2005 to 2020, the high-value areas of ecosystem service value (ESV) were mainly concentrated in the counties at the southern ends and the watersheds of Xin’an County and Mengjin District in the north. These areas are dominated by forests and water bodies and cover the water systems in the northern and central parts of Yiyang County. These regions provide a solid foundation for ecological services due to their excellent natural conditions. Due to their high ecological service value and powerful ecological service functions, their ecological potential is high. In contrast, areas with moderate and lower ecological potential are more widely distributed, mainly cultivated land and grassland. The low-value areas are mainly concentrated in the central part of the study area, especially in the central urban areas dominated by construction land types, such as the old urban area and Jianxi District, which are densely populated. The urbanization process significantly affects ESV values in these regions and is, therefore, relatively low. Although the ecological potential spatial pattern of Luoyang City remained generally stable during the research period, there were still some noteworthy trends of change. Among them, low-value areas such as the central urban area are gradually expanding, while high-value areas dominated by forests are showing a decreasing trend. The changes in other levels are relatively stable but closely related to the expansion of construction land and the reduction of forest and arable land. From a long-term trend perspective, the ecological potential spatial pattern of Luoyang City has maintained relative stability over the past fifteen years, which, to some extent, reflects the resilience and resilience of the ecosystem.
From 2005 to 2020, the spatial pattern of ecological potential in Luoyang City was relatively stable. High-value areas are concentrated in forested and water-rich areas, such as the southern counties, Xin’an County in the north, and the watershed in Mengjin County, which have superior natural conditions and strong ecological service functions. The ecological potential around the high-value zones is also high due to the influence of the surrounding geographic space. Medium and lower-value zones are widely distributed, dominated by cropland and grassland, with lower ecological potential due to natural conditions. Low-value zones are mainly distributed in the central urban area and other areas with dense construction land, dominated by artificial landscapes, with significantly lower ecological potential. While overarching stability prevails, the core urban zone has seen growth at the expense of lower-value regions, concurrently accompanied by a reduction in forest coverage compared to areas of higher ecological value. This shift correlates with the encroachment of built-up areas and declines in forestland and cropland. Looking ahead, implementing scientifically sound and judicious strategies is imperative to strike a balance in allocating ecological potential, thereby fostering harmonious synergy between economic, social, and environmental progress.
Spatial and Temporal Patterns of Ecological Resilience
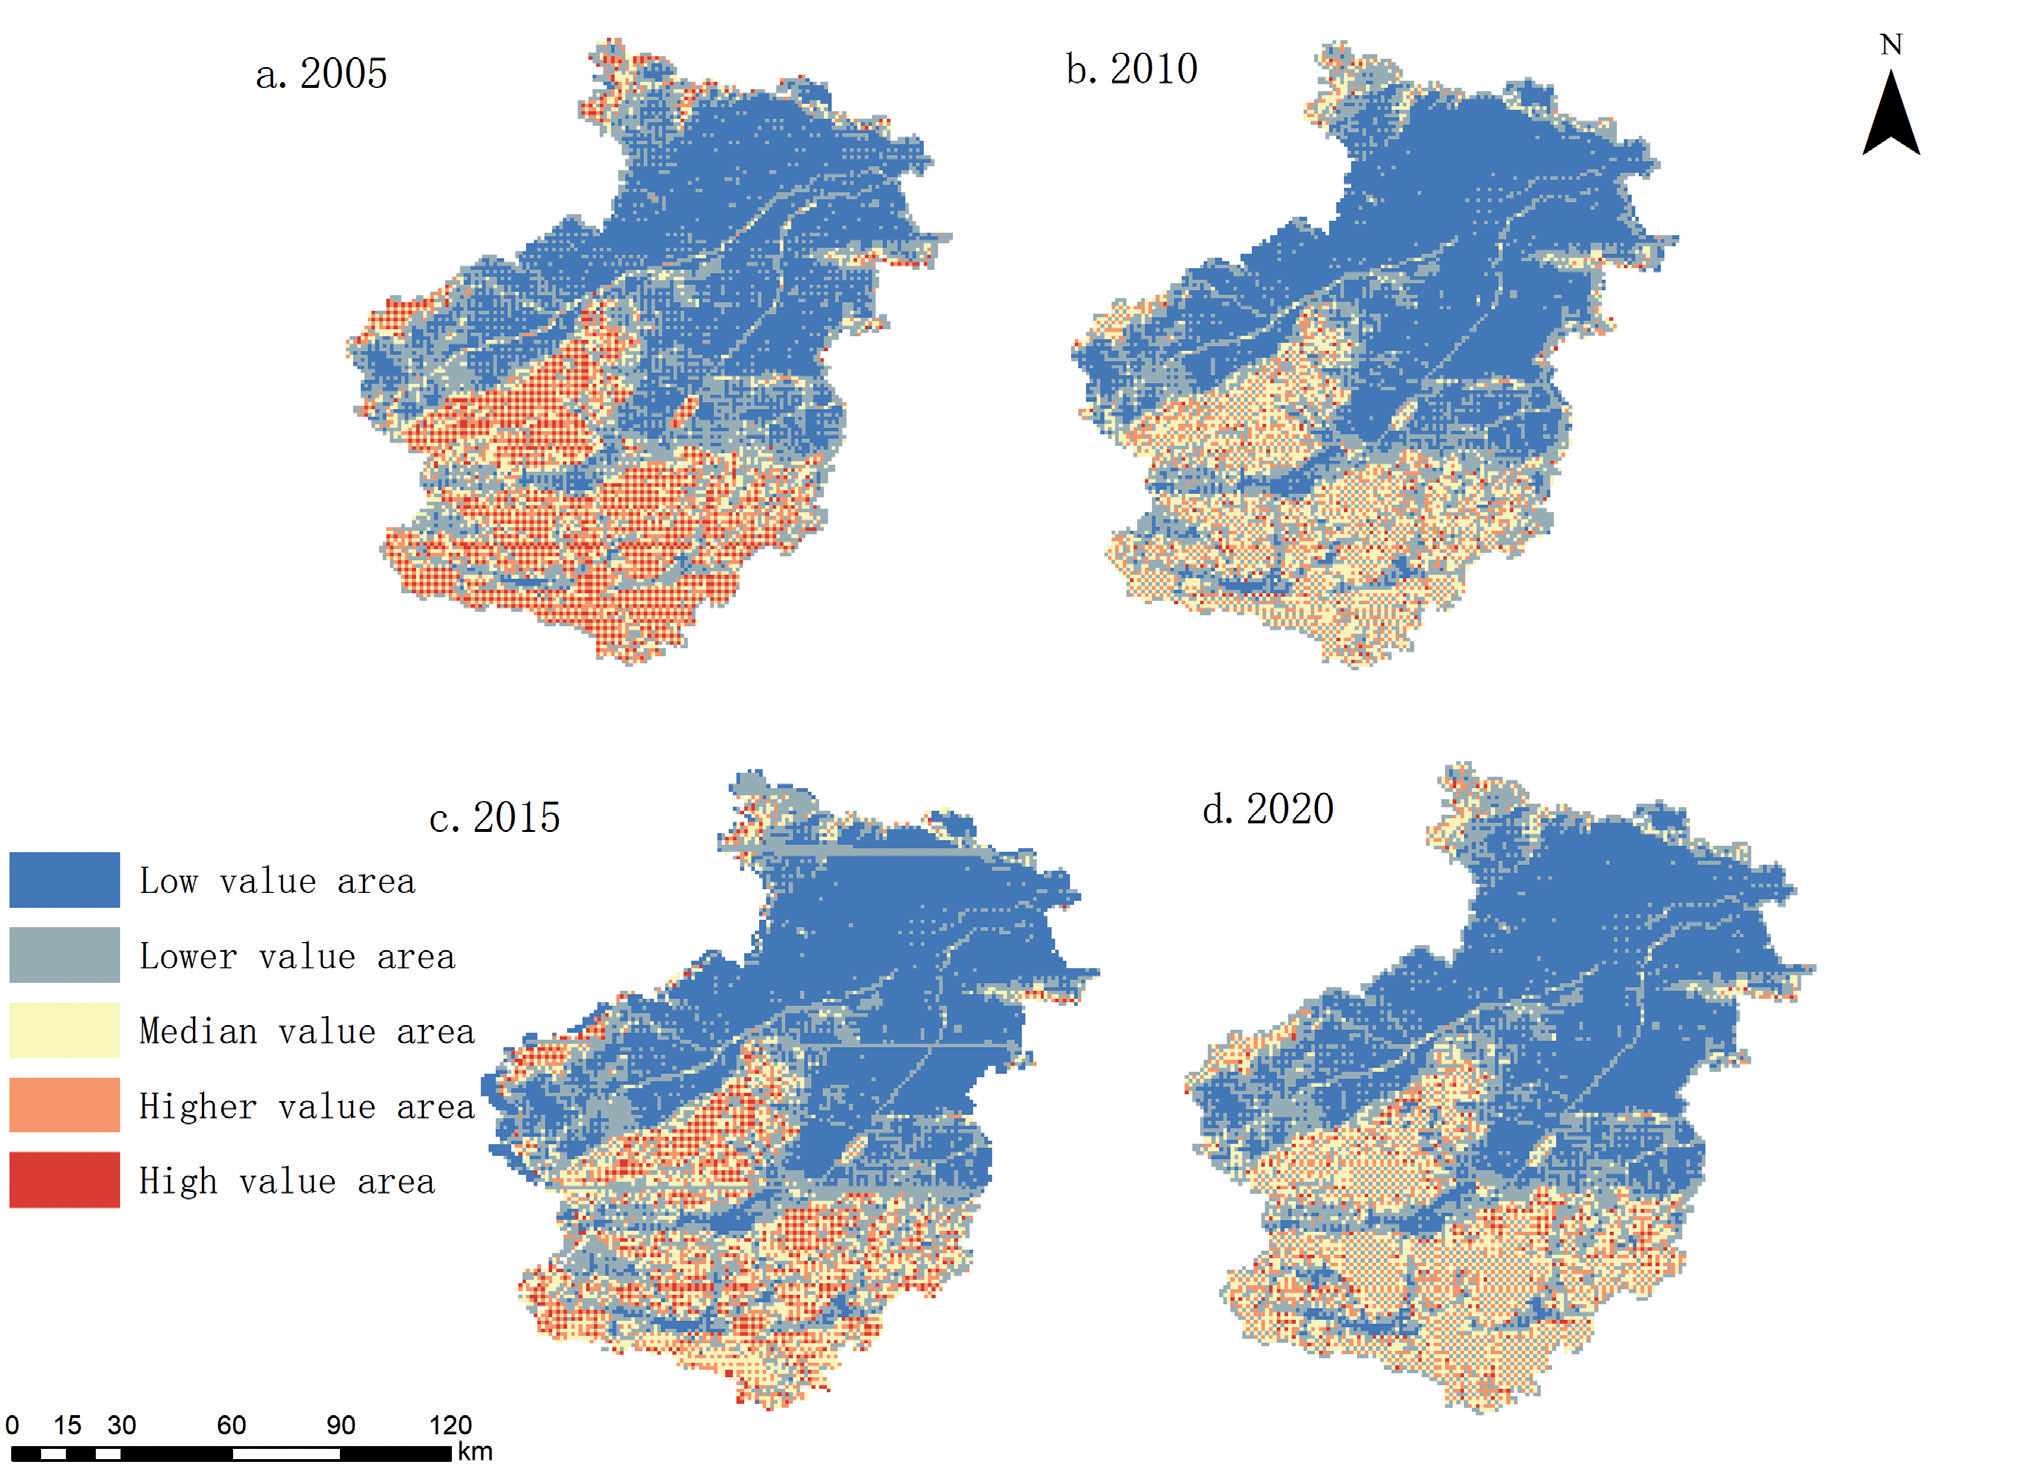
According to the natural breakpoint method, the ecological resilience of Luoyang City is classified into five levels, with low resilience being the highest and stable at about 44%, but decreasing by 5.28% during the last 15 years, suggesting that the urbanization and economic development have had an impact, high resilience fluctuating at about 5%, and medium and higher resilience fluctuating and floating at about 27.5%. During the study period, the low ecological resilience percentage fluctuated and increased from 42.03% to 44.54%, with an increase of 2.5%, indicating that the ecological environment of Luoyang City is under pressure and the low ecological resilience area is expanding.
During the current study, there was an annual decrease of 0.34% in the proportion of areas exhibiting high ecological resilience, indicating that rapid development may have damaged the original high ecological resilience areas. It can be seen that the increase in medium ecological resilience areas showed a “V” type fluctuation, while the increase in higher resilience showed an “N” type rising trend. It can be seen that the increase in medium ecological resilience areas shows a “V”-shaped fluctuation, while the increase in higher resilience shows an “N”-shaped upward trend, rising and then falling, especially from 2010 to 2020, which is the largest increase. It may be related to the ecological protection efforts of Luoyang in recent years. Low and lower resilience dominate the distribution, with the proportions exceeding 69% for all four time points, while higher and higher resilience areas contribute relatively little, at about 15%. This suggests that low and lower levels of ecological resilience dominated the rapid development process in Luoyang City and that regions with high ecological resilience had less influence.
The pattern of ecological resilience distribution is generally stable, as shown in Fig. 5, lower in the north and higher in the south. Low, lower, and medium toughness areas are widely distributed, mainly involving unused land, construction land, and waters, especially in the central urban and south-central parts of the city. The distribution of high toughness along the Yellow River in the north and central city mass is closely related to the expansion of urban construction land. Natural ecologically rich areas such as Songxian and Luanchuan counties show high ecological toughness due to lush forests and superior ecological conditions, and the expansion of low-toughness areas reveals the tension between urban development and ecosystems. Economic construction and human activities promote urban development while bringing pressure and risk to the ecosystem, leading to a decline in ecological resilience and affecting the city’s ecological level and coping capacity. Therefore, Luoyang City urgently needs to improve its ecological resilience, strengthen the protection and restoration of low resilience areas, optimize urban planning and management, promote green and sustainable development, reduce disturbances in high resilience areas, and strengthen ecological, environmental protection and regulation, and establish an ecological resilience assessment and monitoring system, to guarantee the healthy development of urban ecosystems.
Trends in Ecological Resilience
Based on the natural discontinuity delineation and previous studies [30], Luoyang City faced a wide range of moderate and slight ecological resilience declines from 2005 to 2010 (Fig. 6). This reflects that the rapid expansion of urban construction at that time had a significant impact on the ecological environment, resulting in a general decline in ecological resilience. The change in ecological resilience rank from 2010 to 2020 mainly focuses on slight regression, which is geographically concentrated, while the areas of slight increase show a point-like distribution. This implies that the conversion of area between land use types during this period has been effectively controlled, with relatively little impact on ecological resilience, resulting in a gradual improvement of the ecological resilience of Luoyang City.
Overall, from 2005 to 2020, the change in the ecological resilience level of Luoyang City is still dominated by a decline in resilience, indicating that its ecosystem resilience is declining. It is necessary to take measures to strengthen the protection and improvement of the ecological environment to enhance the ecological resilience level of Luoyang City. Grassland land area has small changes in ecological resilience, is less disturbed by human activities but has low ecosystem service value, and has overall low ecological resilience. The Southern Ecological Reserve and the Furniu Mountain Range areas are rich in woodland resources, with high vegetation cover and ecosystem service value, little construction land, and little influence from human socio-economic activities, and therefore have high ecological resilience. These areas provide an important guarantee for the ecological security of Luoyang City.
Spatial Analysis of Ecological Resilience
The standard deviation ellipse analysis shows in Table 2 that the ecological resilience ellipse in Luoyang City from 2005 to 2020 was oriented northwest-southeast, and the dynamic fluctuation of the rotation angle made the northeast-southwest pattern relatively stable. The long semiaxis decreased from 51.554 km in 2005 to 58.969 km in 2015, reflecting a contraction in the dominant direction of ecological toughness. The shorter semiaxis expanded from 43.505 km to 44.327 km, suggesting a more scattered distribution of ecological resilience. This evidences a gradual fragmented spatial pattern of ecological resilience within Luoyang City.
Fig. 7 illustrates the overarching trajectory of the centroid’s movement, demonstrating that Luoyang’s ecological resilience center shifts from the southwest towards the northeast. Specifically, between 2005 and 2015, the centroid moved 10.86 km further northwest. Analyzing this shift in phases, from 2005 to 2010, the centroid migrated a modest 0.77 km southeast, indicative of a slower pace of change. This deceleration is largely attributed to a growth in woodland and watershed landscapes during this interval, which bolstered the city’s ecological foundations. While the center of gravity migrated to the northeast from 2010 to 2020, the migration speed was faster in 2015. The southward trajectory indicates that the ecological resilience of the south is gradually better than that of the center and north. The central and northern parts of the country have a lower level of ecological resilience due to intensive human activities, high-intensity development of economic activities leading to shrinking of ecological space and increasing ecological risks, and destruction of ecosystem structure leading to a decline in ecological service functions. The forest land and ecological reserves in the south are more stable and characterized by higher levels of ecological resilience.
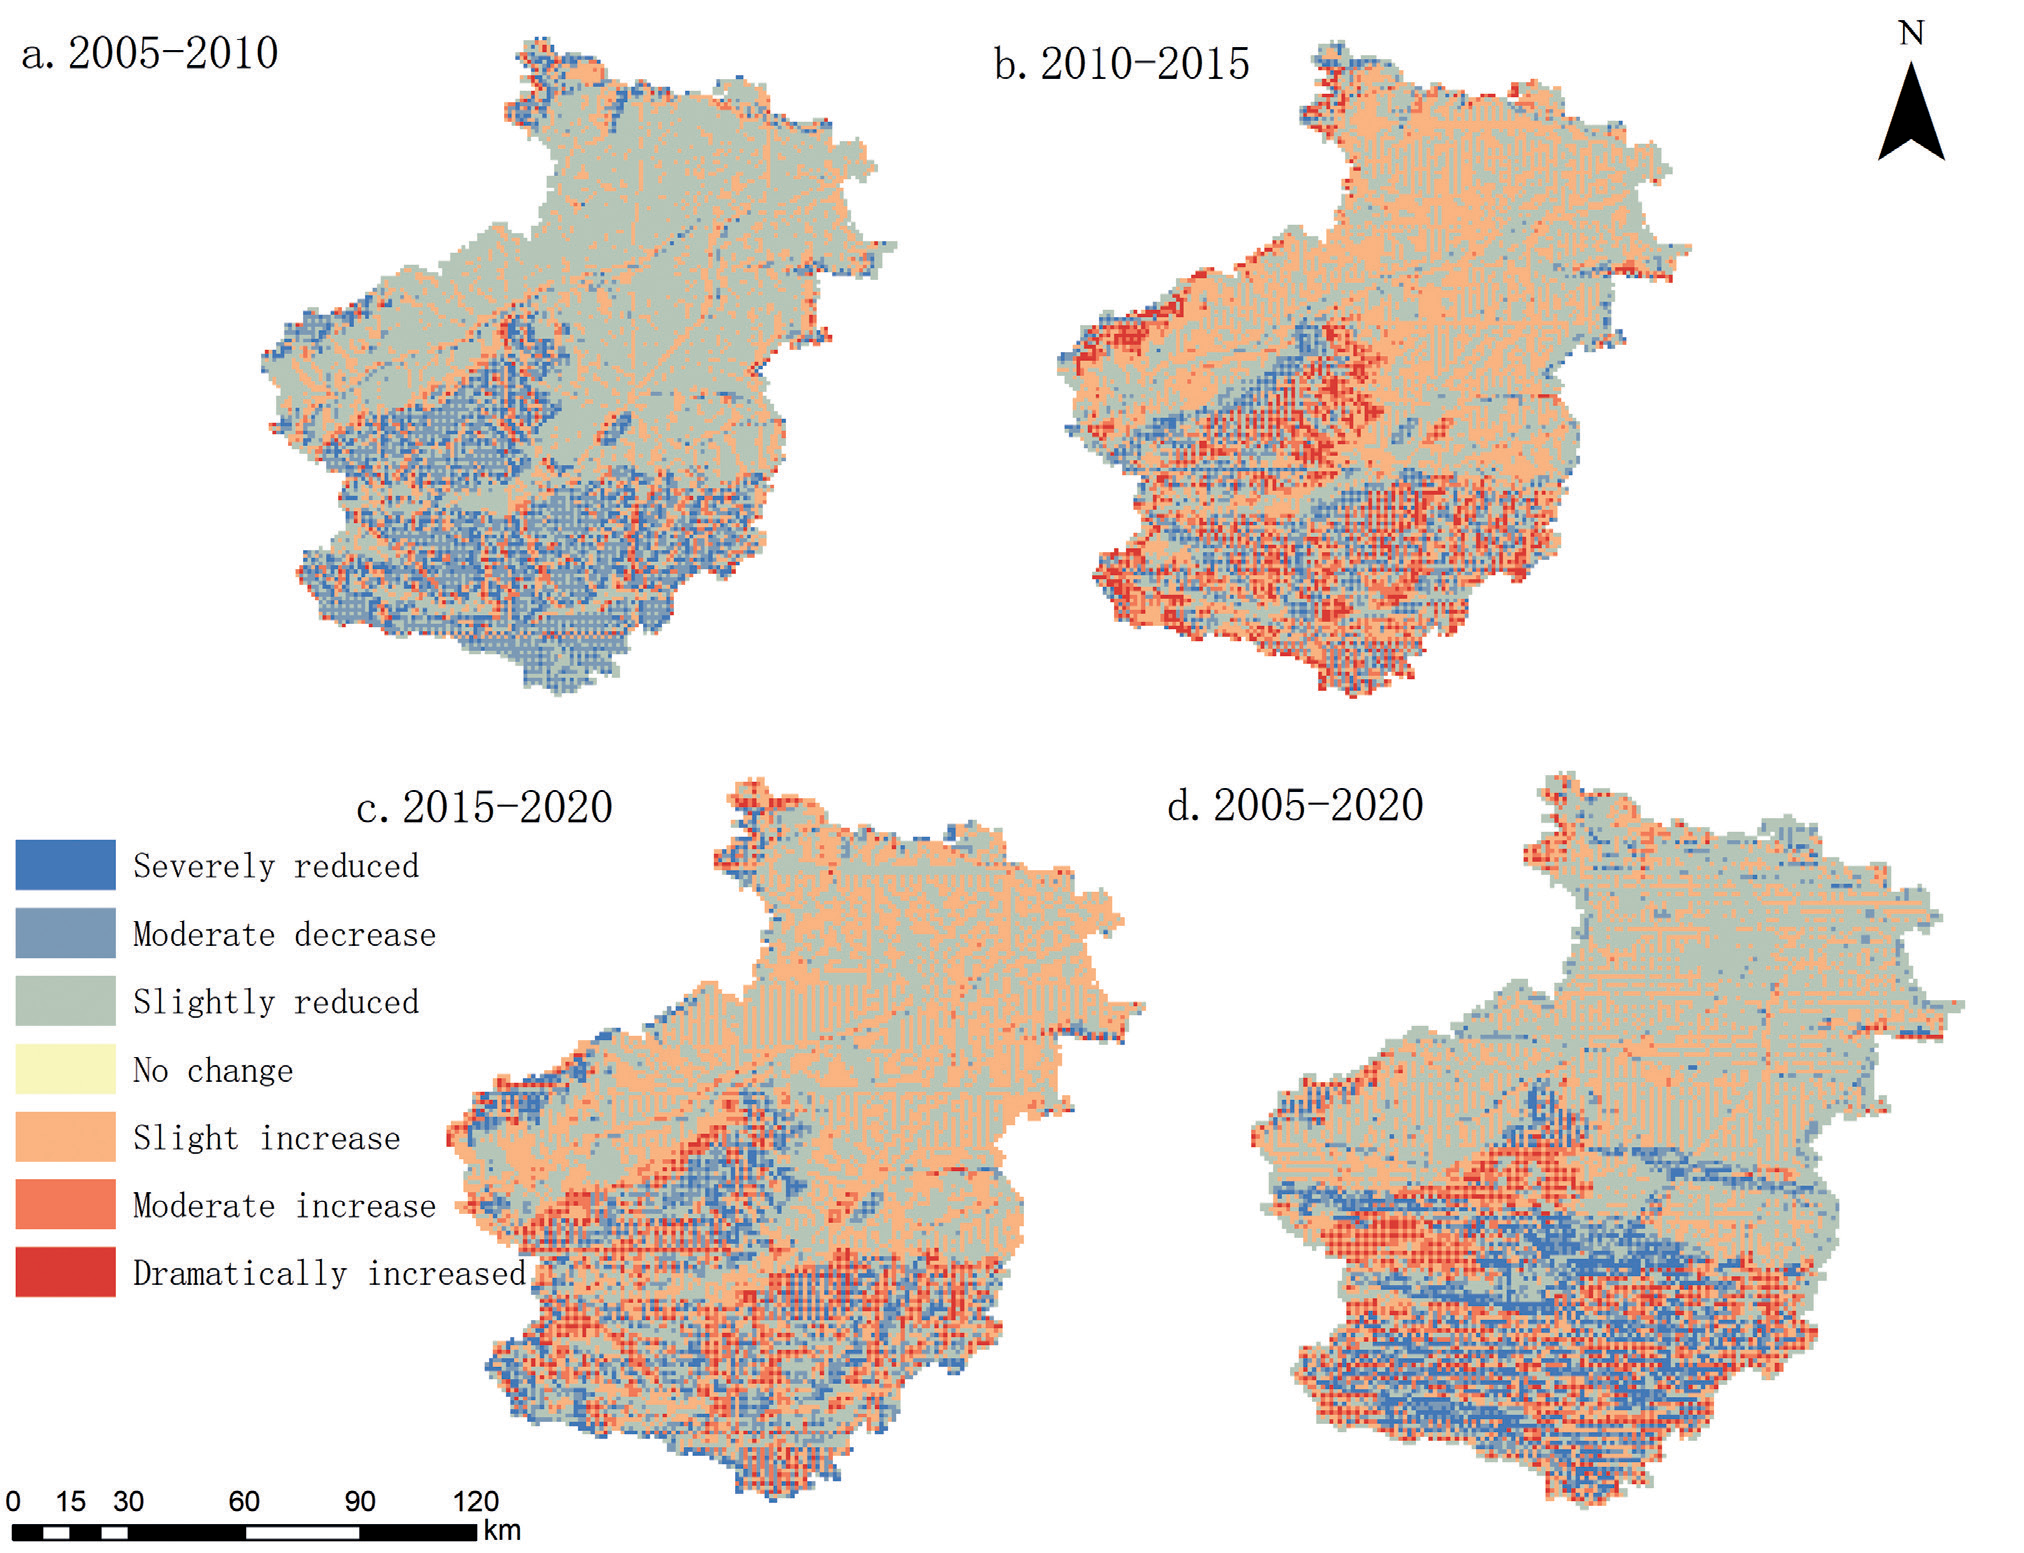
Table 2.
Standard deviation ellipse parameters from 2005 to 2020.
The spatial arrangement of ecological resilience within Luoyang City was scrutinized utilizing both Global Moran’s I and Anselin’s Local Moran’s I statistical methods. The spatial distribution pattern of ecological resilience in Luoyang City was analyzed using Global Moran’s I and Anselin Local Moran’s I. The Global Moran’s I showed that the ecological resilience of Luoyang was positively correlated with spatial information, and the higher the spatial distribution aggregation, the higher the ecological resilience value. The local autocorrelation analysis further reveals the obvious positive spatial correlation of high ecological toughness regions, while the low ecological toughness regions also show a certain clustering trend. Table 3 illustrates that all measurements surpass the significance threshold, affirmatively suggesting that the ecological resilience across Luoyang City exhibits a pronounced spatial clustering pattern.
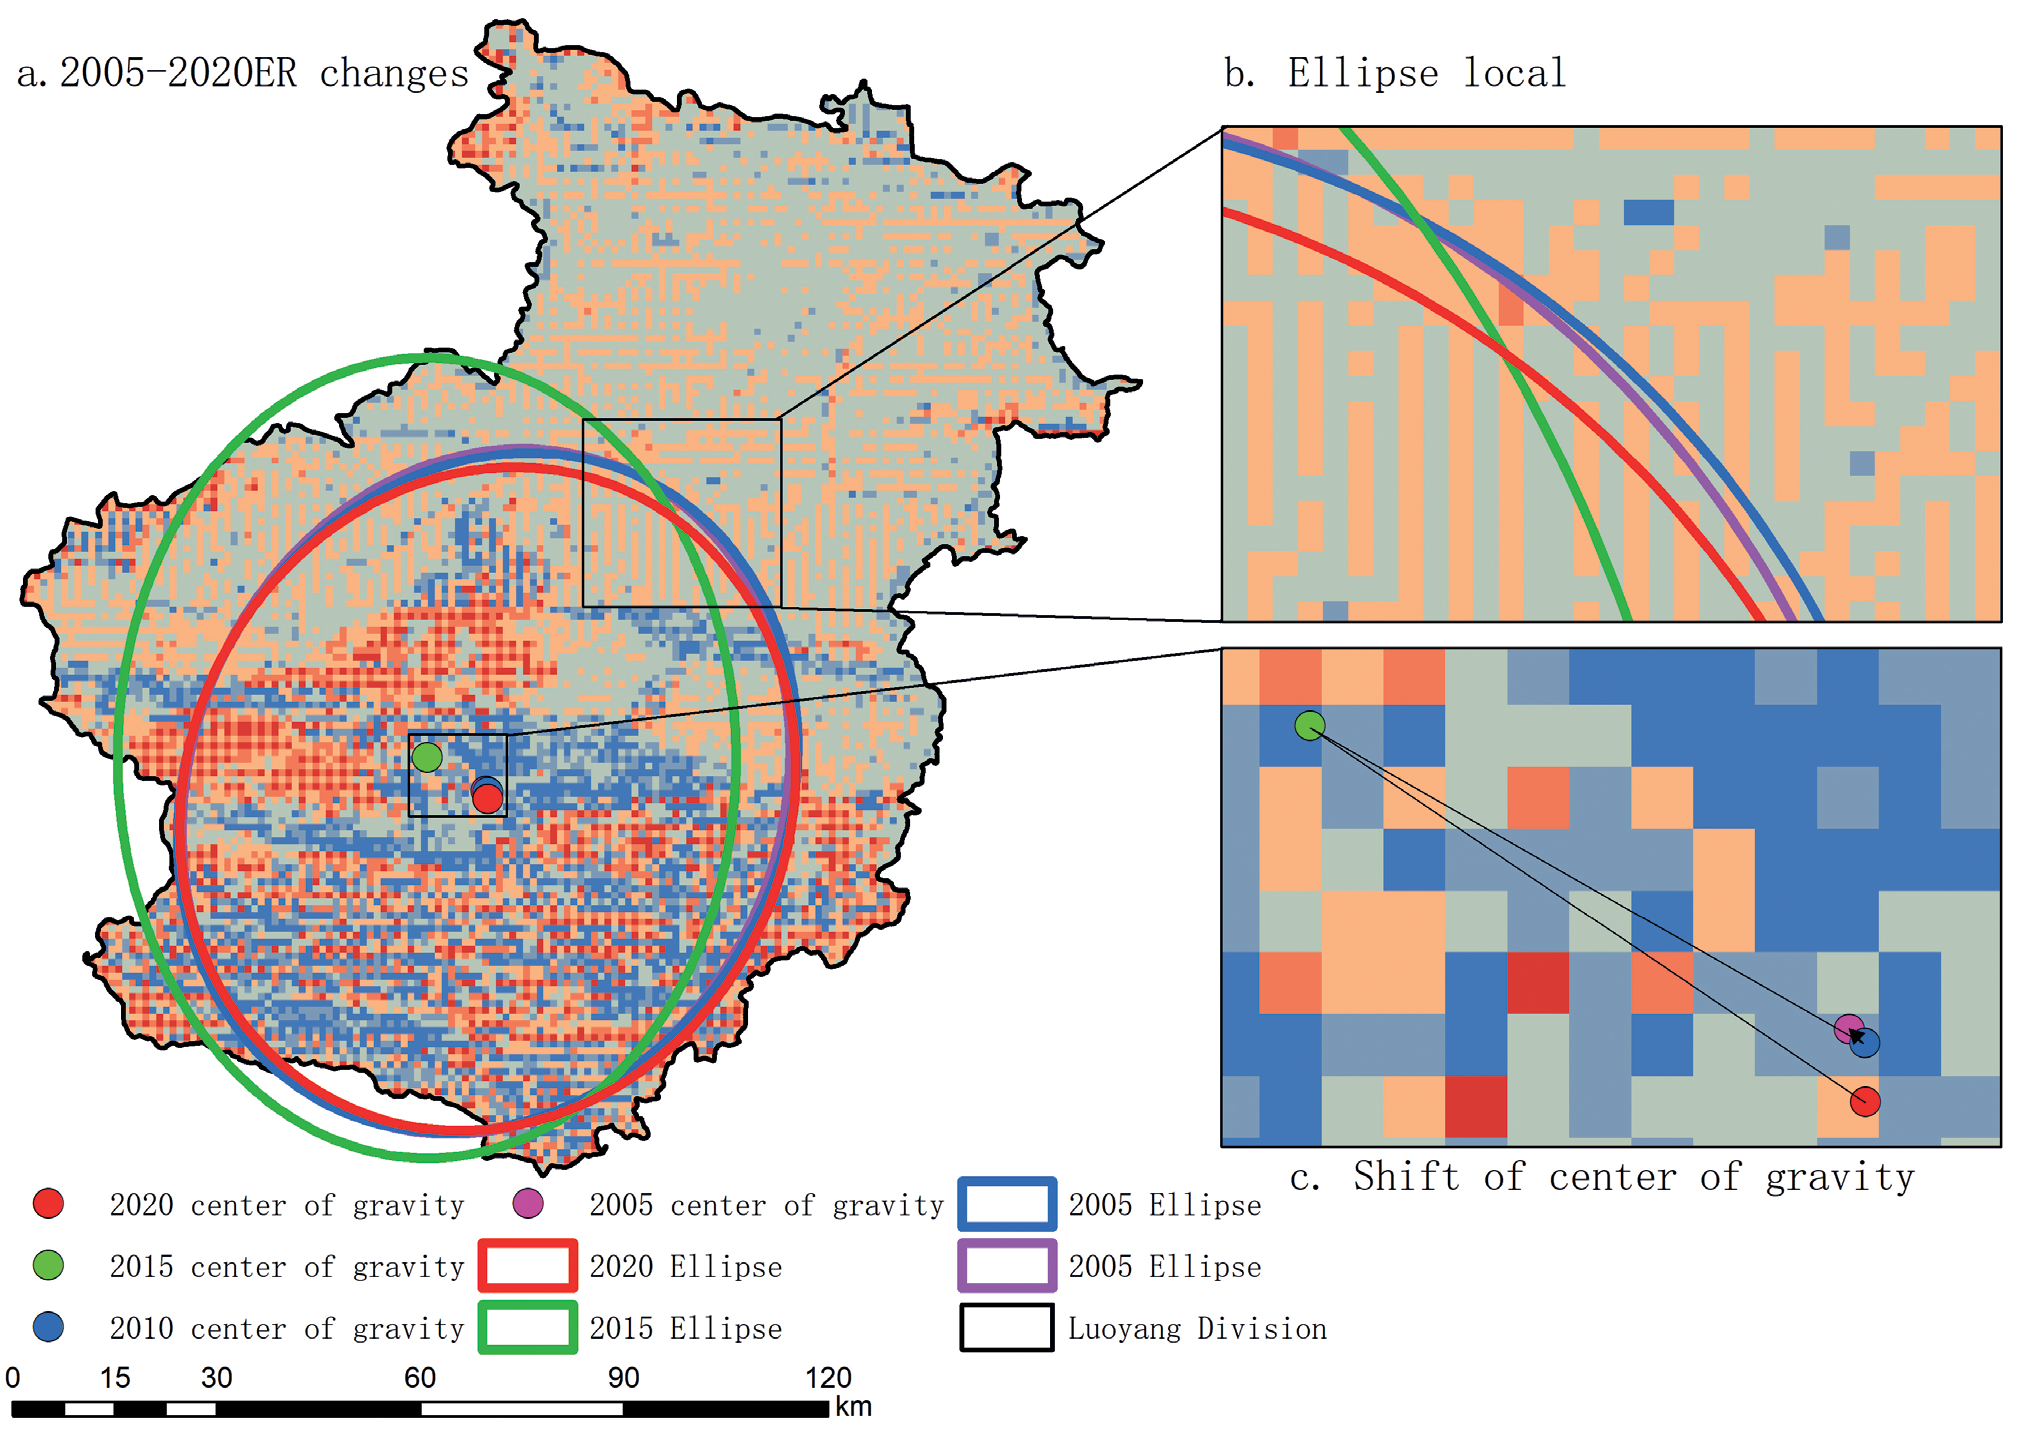
Table 3.
Overall ecological resilience of Luoyang City, Moran I.
| year | Moran Index | p-value | z-score | variance |
|---|---|---|---|---|
| 2005 | 0.429 | 0.00001 | 106.373 | 0.000016 |
| 2010 | 0.432 | 0.00001 | 106.949 | 0.000016 |
| 2015 | 0.012 | 0.00041 | 3.532 | 0.000013 |
| 2020 | 0.448 | 0.00001 | 111.068 | 0.000016 |
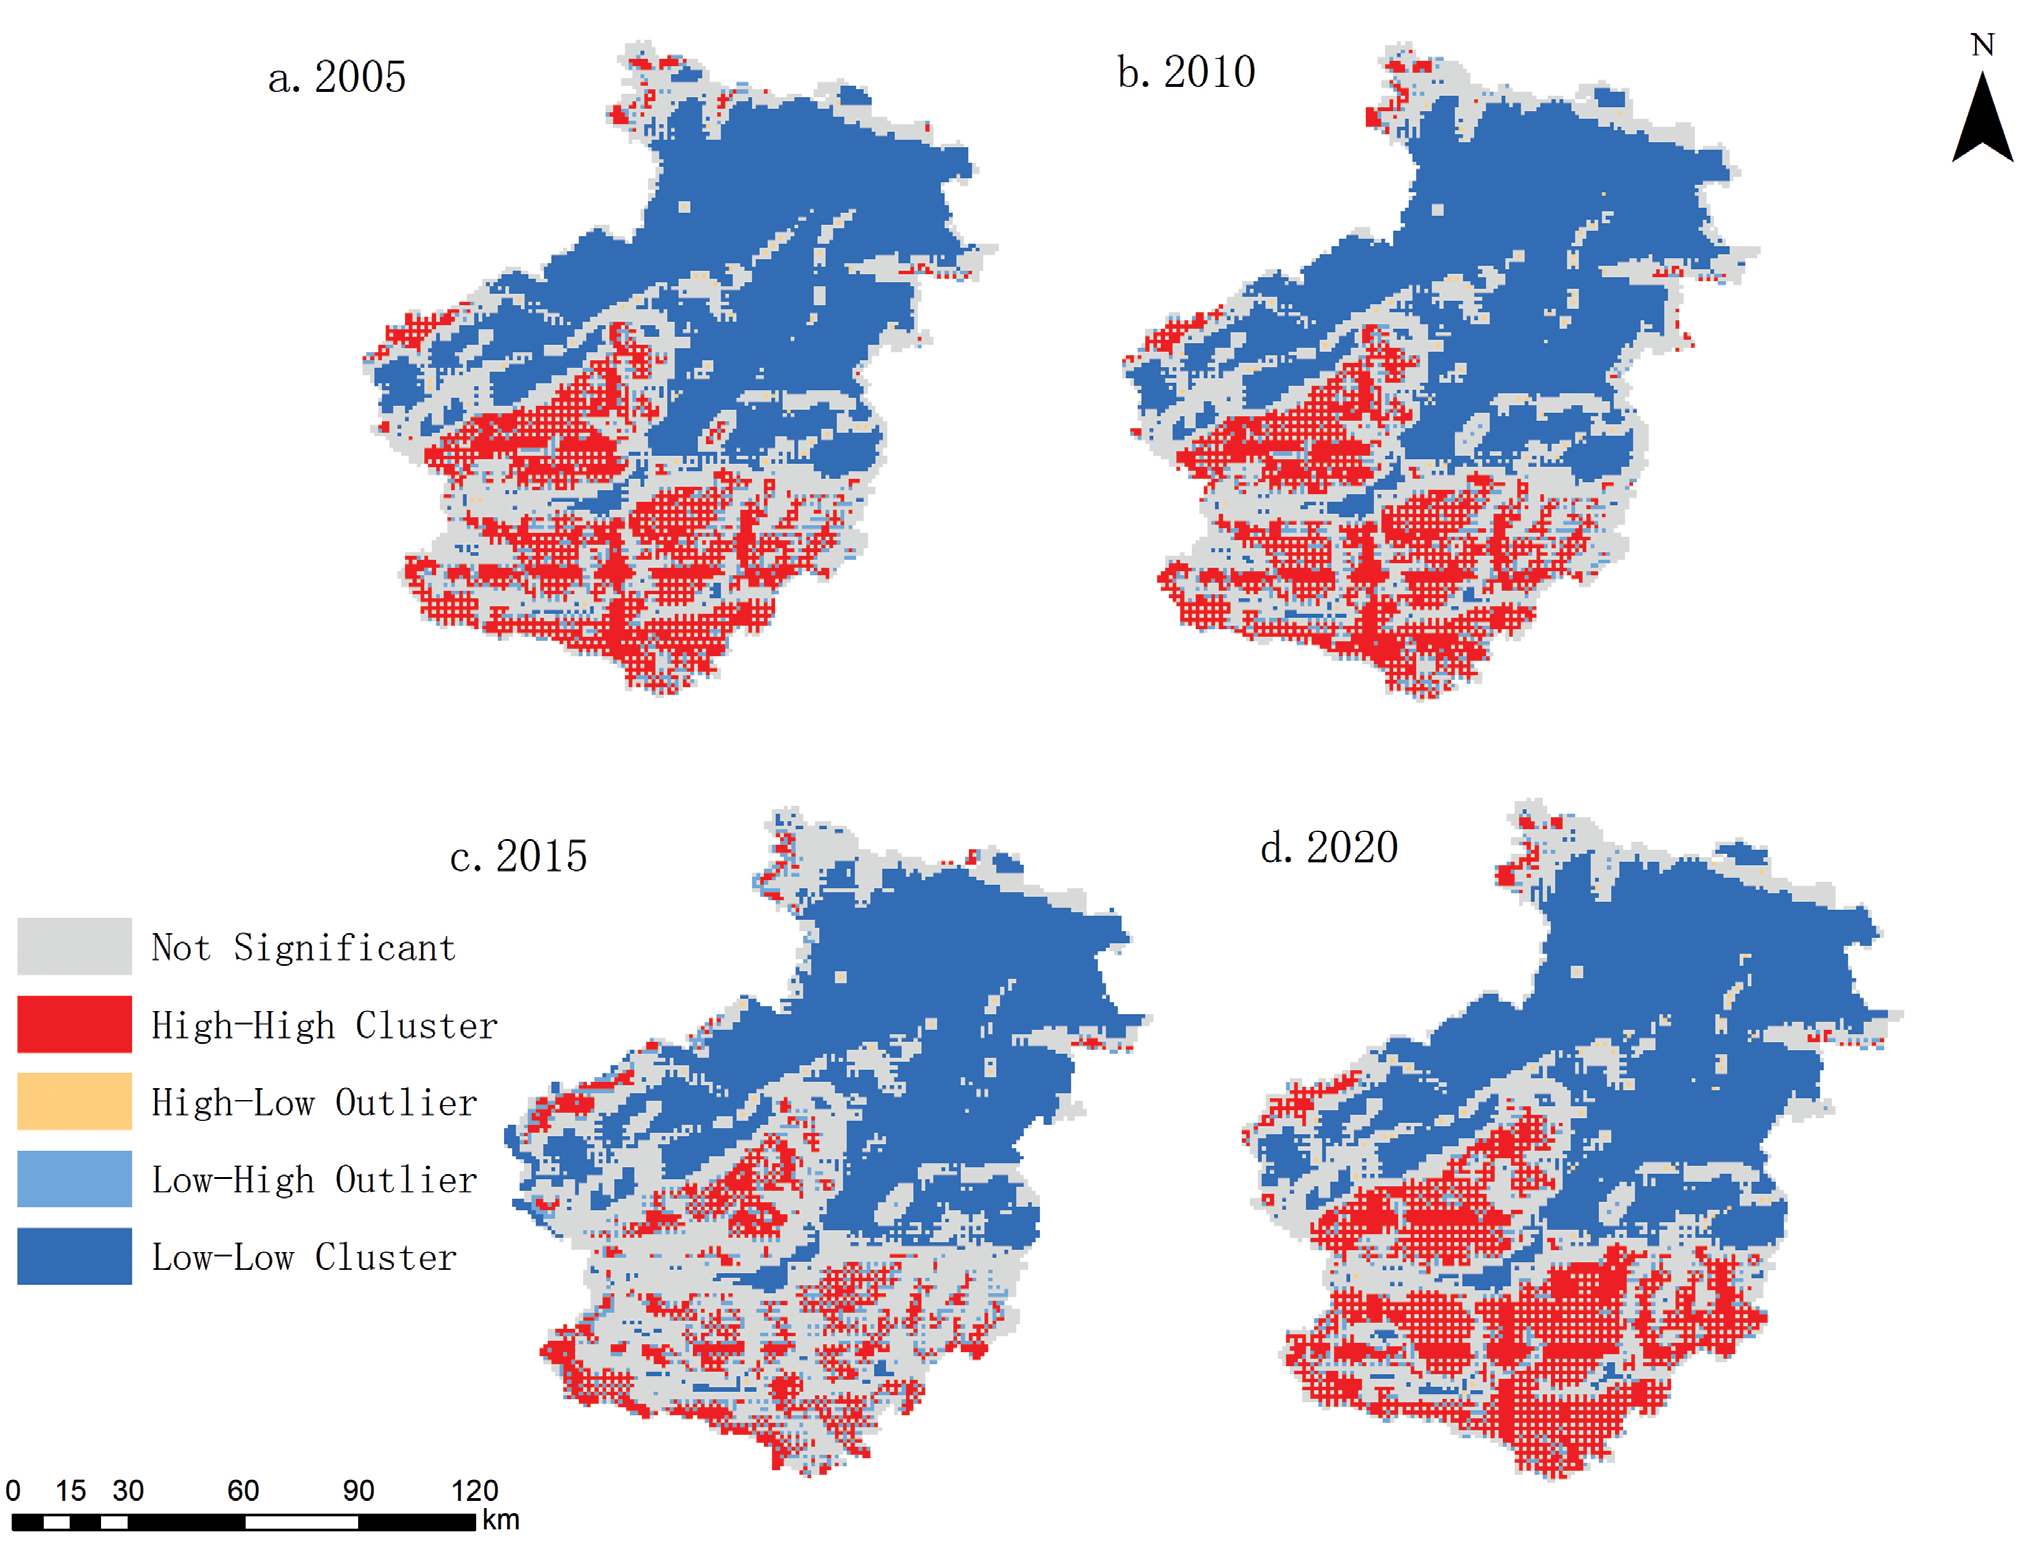
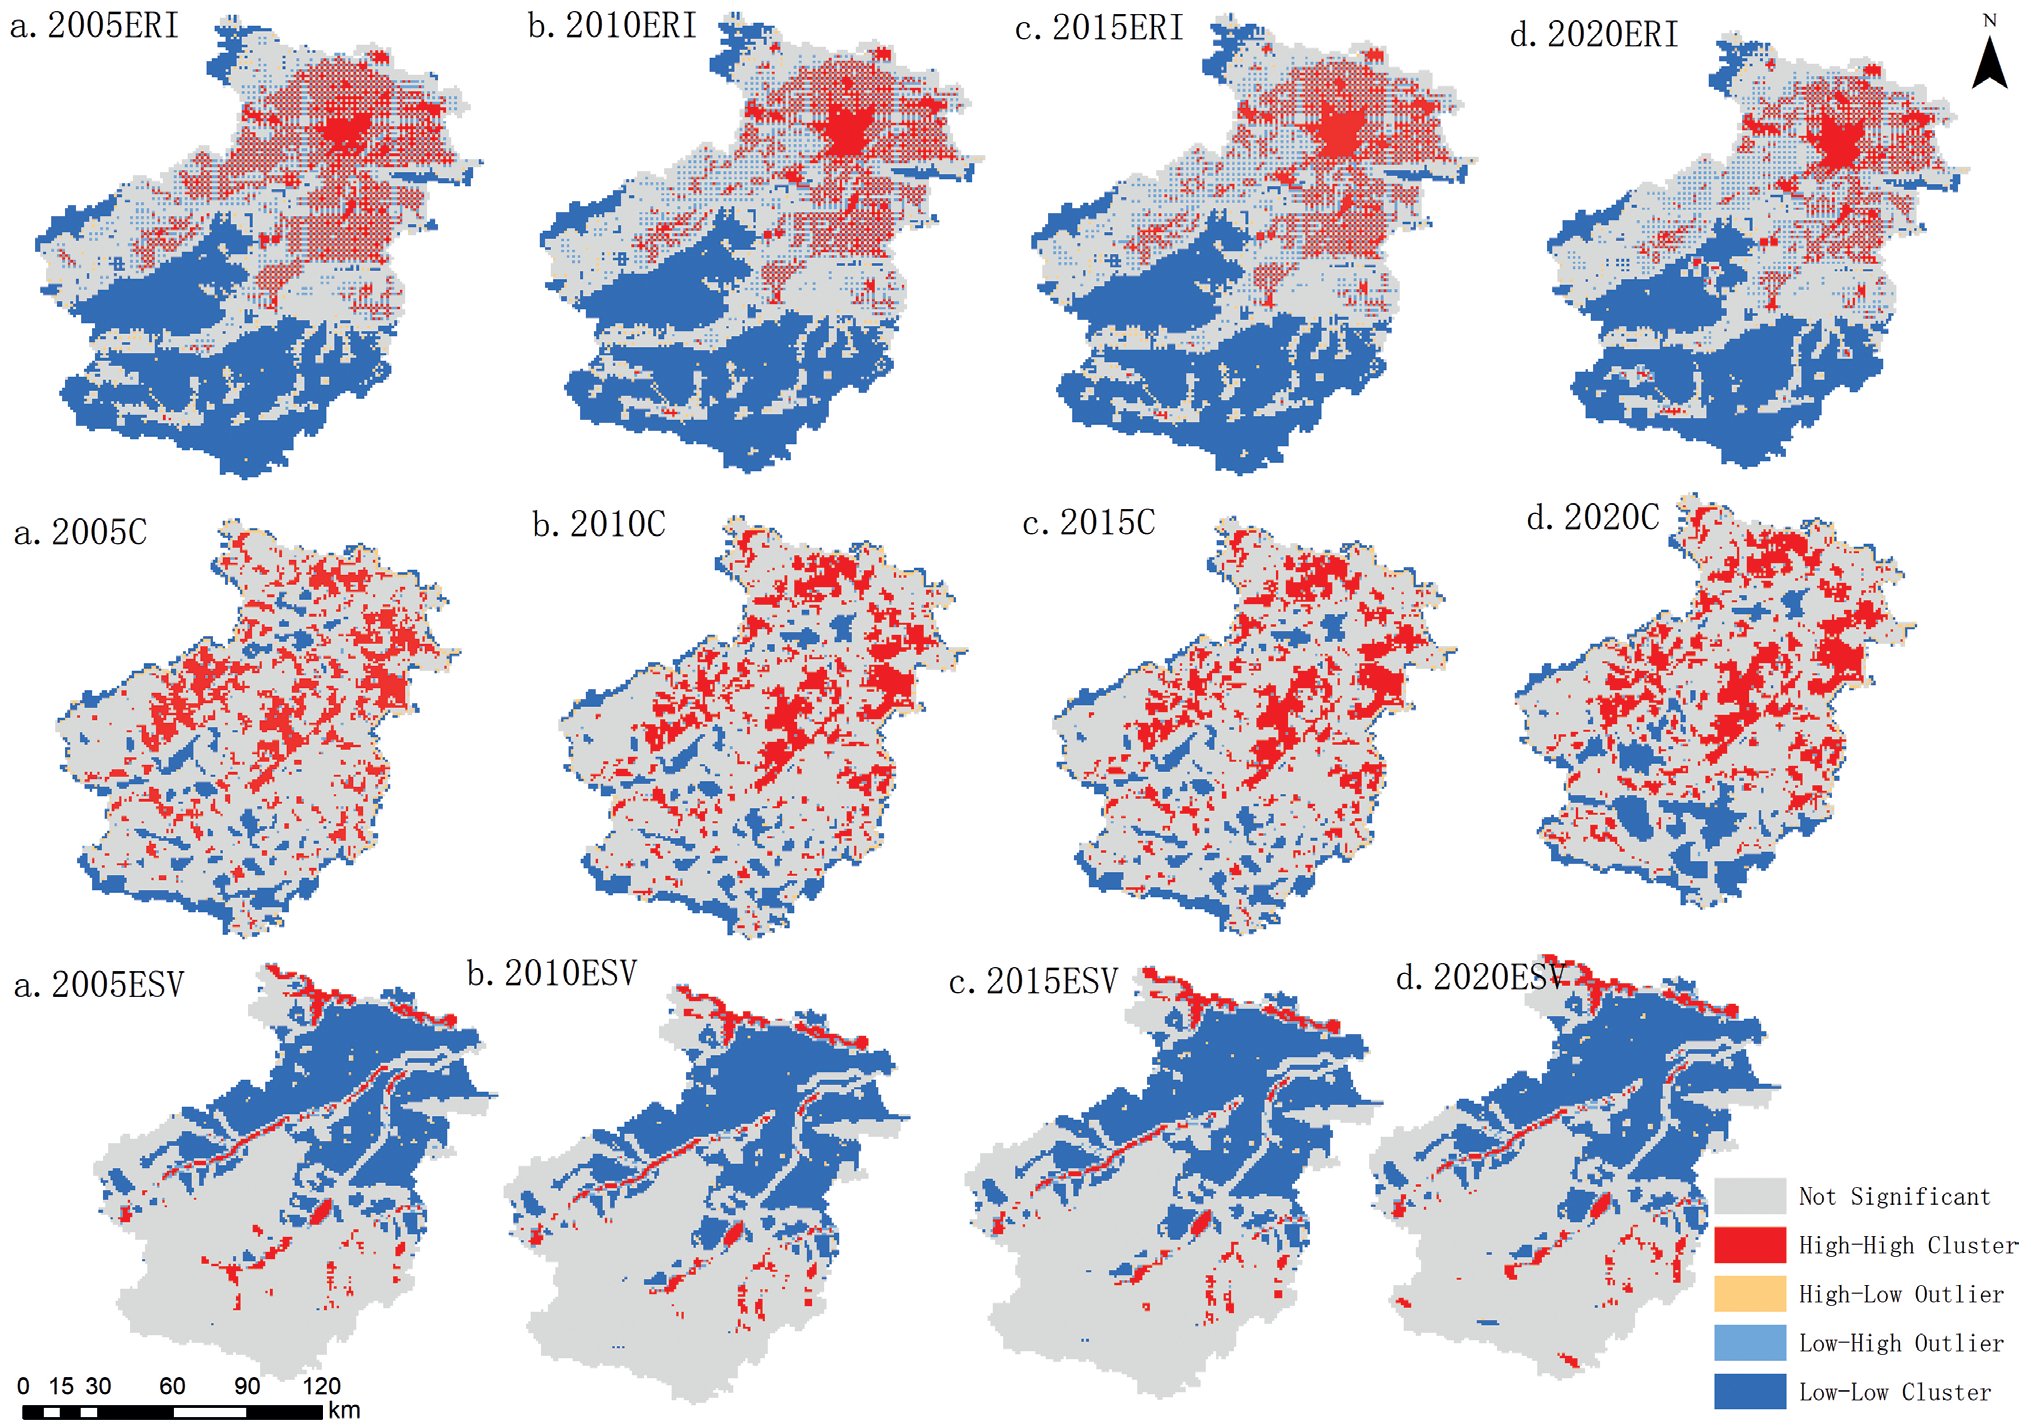
The ecological resilience of Luoyang City is not only constrained by intra-regional factors but also by inter-regional interactions. Therefore, this spatial autocorrelation should be fully considered when formulating and implementing ecological protection and restoration measures, and corresponding strategies should be adopted for the characteristics of different regions to achieve more effective ecological management and sustainable development. It can be found that the spatial aggregation pattern and distribution characteristics of ecological toughness in Luoyang City in the four years are similar (Fig. 8), all of which are dominated by the high-high and low-low aggregation types, i.e., the regions with high and low ecological toughness are each more likely to be spatially aggregated. A few regions also show a high-low type of aggregation of ecological toughness. High-high ecological resilience aggregations occurred mainly in the southern woodland, mountain range, and southern mountain region, and this type of aggregation was spatially clustered and scattered.
The land use type in the high-high agglomeration area is mainly forest land. The low-low type agglomeration area is mainly concentrated in the central area of the Luoyang city core, showing scattered points distribution of spatial agglomeration. This low concentration forms a vast contiguous zone in the city’s center, exhibiting extensive diffusion. In addition, the satellite cities of Songxian, Luanchuan, and Ruyang have also merged into a considerable agglomeration area. These low-low concentration areas are mainly composed of building land and agricultural land. Compared with 2010, the spatial distribution of the local Moran index of ecological resilience in Luoyang City in 2015 and 2020 is suggested by the southern part of the central-type agglomeration area in the county, which is dominated by urban and rural construction land and farmland. The scope of the agglomeration area is narrowed compared with that in 2005, while the spatial distribution of the high-high aggregation area has no obvious changes.
Similarly, to deeply analyze the spatial distribution of ecological resilience constitutive indicators, a global autocorrelation analysis was conducted on the spatial distribution pattern of the ecological resilience subsystem risk, connectivity, and potential of Luoyang City for four years by using the spatial autocorrelation analysis function of the ArcGIS 10.6 software (Fig. 9).
Risk high-high type aggregation mainly occurs in the northern, mountainous, and southern mountainous areas; this type of aggregation is spatially distributed in the form of clusters and scattered points, superimposed on the spatial distribution pattern of land use in Luoyang city for analysis. High-high type aggregation of the region’s land use type is mainly for construction land and arable land. The connected areas exhibiting low-low type aggregation are chiefly situated in the southern portion of the region; this type of aggregation in the spatial distribution of point-like, and low-low type aggregation in the central region of the spread of the scope of the weakening, and the potential of the high-high aggregation during the study period, mainly rivers, forest land is dominated by the low-low aggregation of the area is mainly for the urban area, the county city and the surrounding urban construction areas. Overall, in addition to the decrease in the range of risky high-high aggregation and the increase in the range of connected low-low aggregation during the study period, the spatial distribution of local Moran index aggregation of the subsystems in 2020 tends to be stable as a whole when compared with that in 2005, which also provides the basis for a better understanding of the kernel of the change in ecological resilience.
Analysis of Factors Influencing Ecological Resilience in Luoyang City
Digging deeper into the key factors affecting urban ecological resilience and understanding their driving mechanisms are crucial to enhancing Luoyang’s ecological resilience. The geo-detector model with optimal parameters is used to conduct an in-depth study of the core influencing factors in the urban ecological resilience indicator system (Fig. 10).
To ensure the accuracy of the ecological resilience study, 11 spatial scales, ranging from 0.5 km to 3 km, were designed based on the reality of the study area and concerning the results of the research on spatial scale effects. Various grids were generated for a comprehensive analysis (Fig. 11). Parameter optimization includes spatial discretization and spatial scale optimization. For spatial discretization, multiple classification methods were used, different classifications were set, and the drivers’ explanatory power (q-value) was calculated by the OPGD model to filter out the optimal solutions. In spatial scale optimization, the q-value quartiles of the drivers at different spatial scales are compared, and the optimal spatial scale is determined to capture sufficient information and avoid analytical bias.
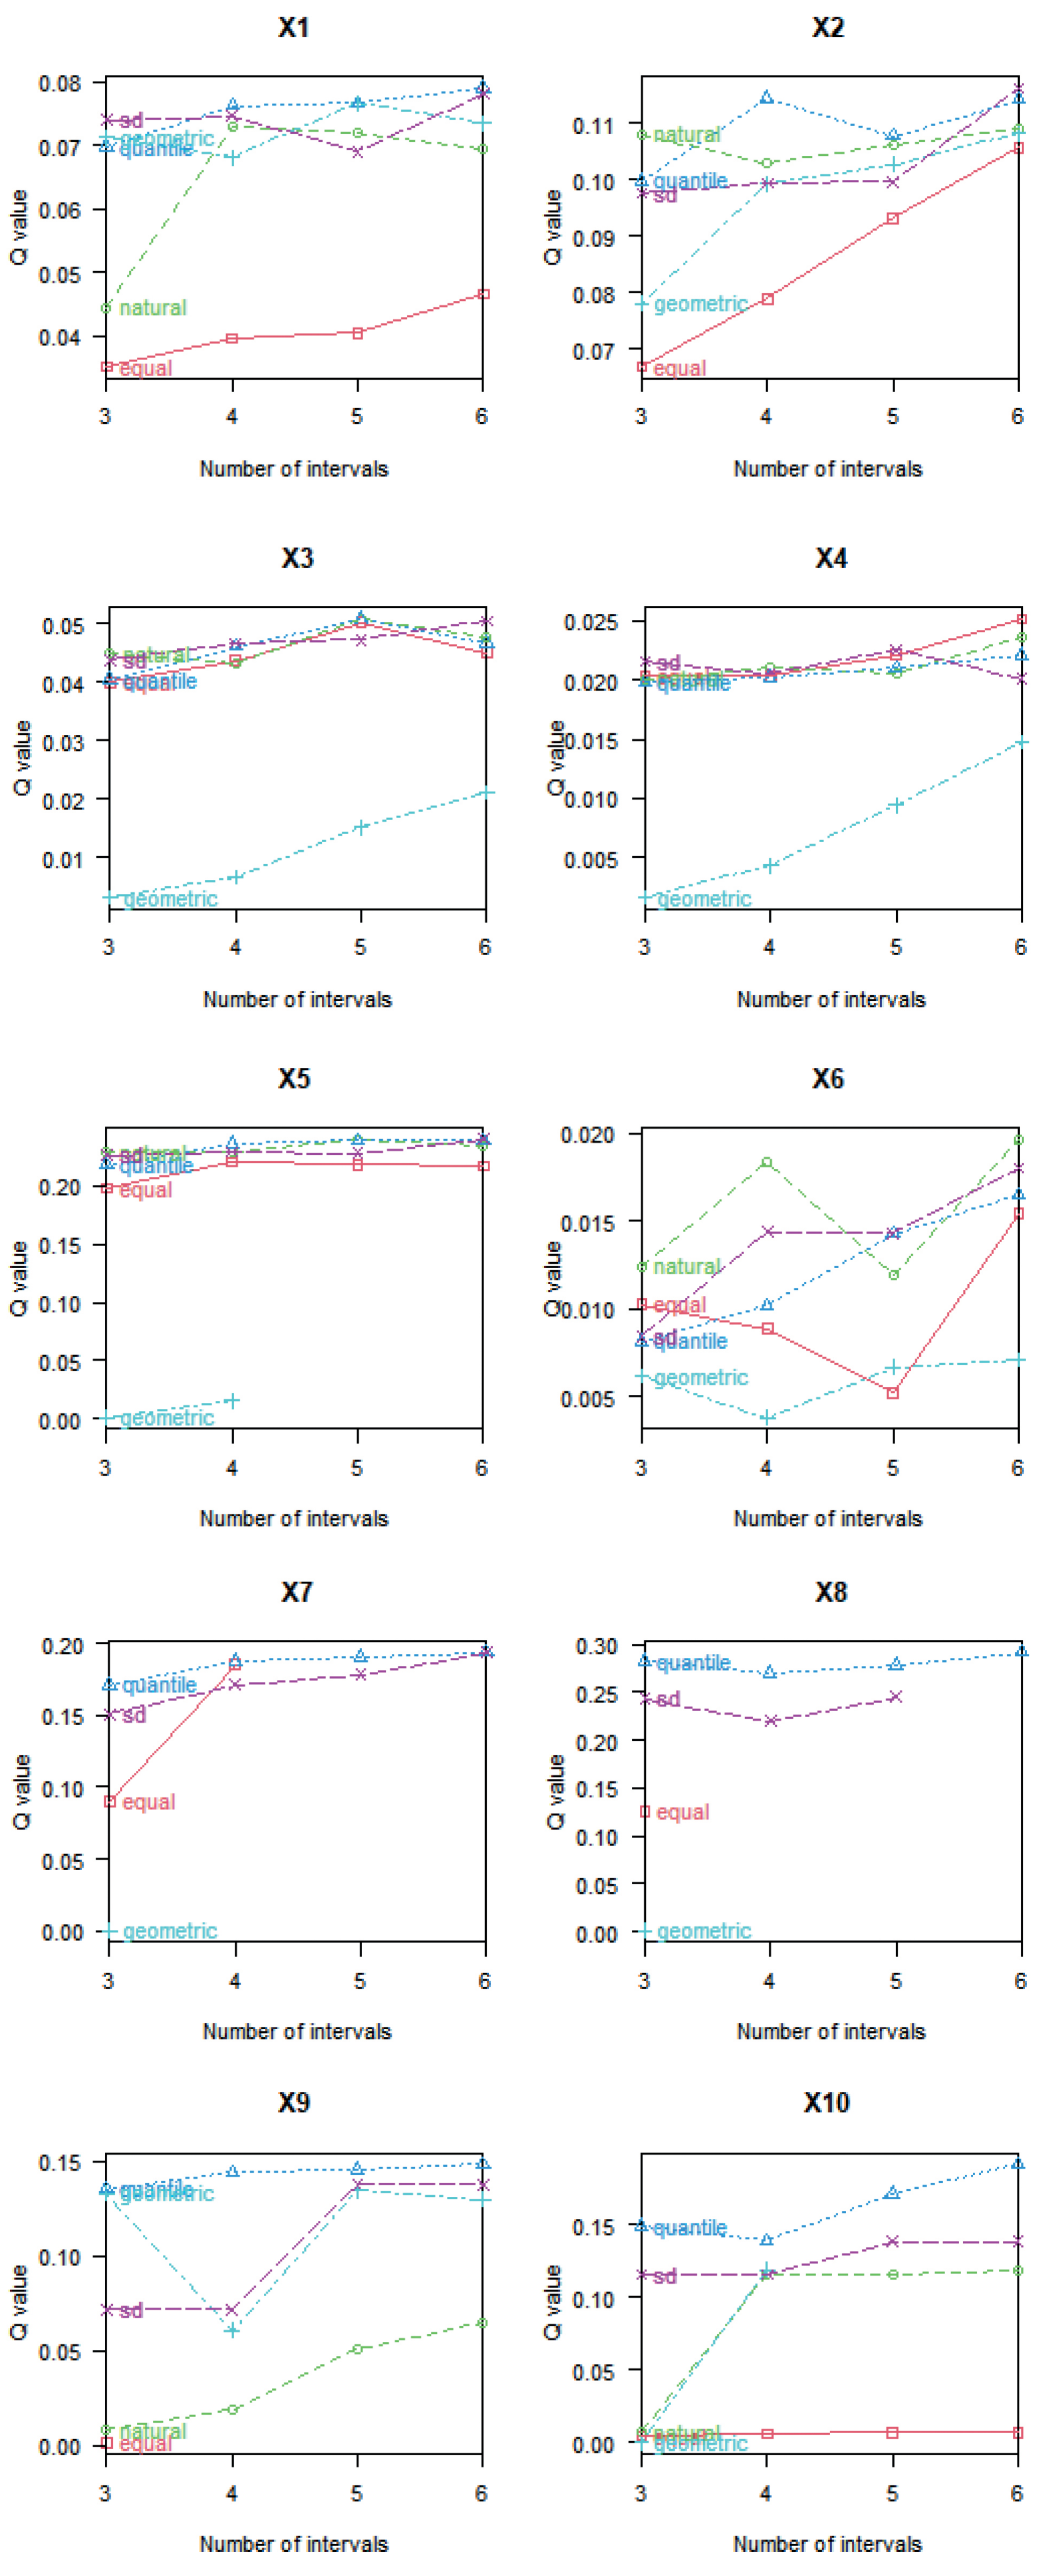
When exploring the association between drivers and geographic phenomena, differences were found in the ability of different discretization methods to reveal the relationship between them (Fig. 12). In the case of slope, for example, the explanatory power of the standard deviation classification method was 1.14 times higher than that of the equal interval method. Therefore, the optimal discretization method and several classifications must be selected for different drivers. For distance from provincial roads, equal-interval method is classified as optimal for 6 categories; for NDVI and distance from county roads, natural breakpoint method is optimal, but the former is optimal for 6 categories and the latter is optimal for 5 categories; for mean annual temperature, standard deviation classification method is classified as optimal for 6 categories; for DEM and nighttime lighting, mean annual precipitation, population density, and GDP, quartile method is optimal for 5 categories and the latter is optimal for 6 categories. Choosing the appropriate discretization method and the number of classifications can more accurately reveal the impact of drivers on ecological resilience and provide a scientific basis for developing effective enhancement strategies.
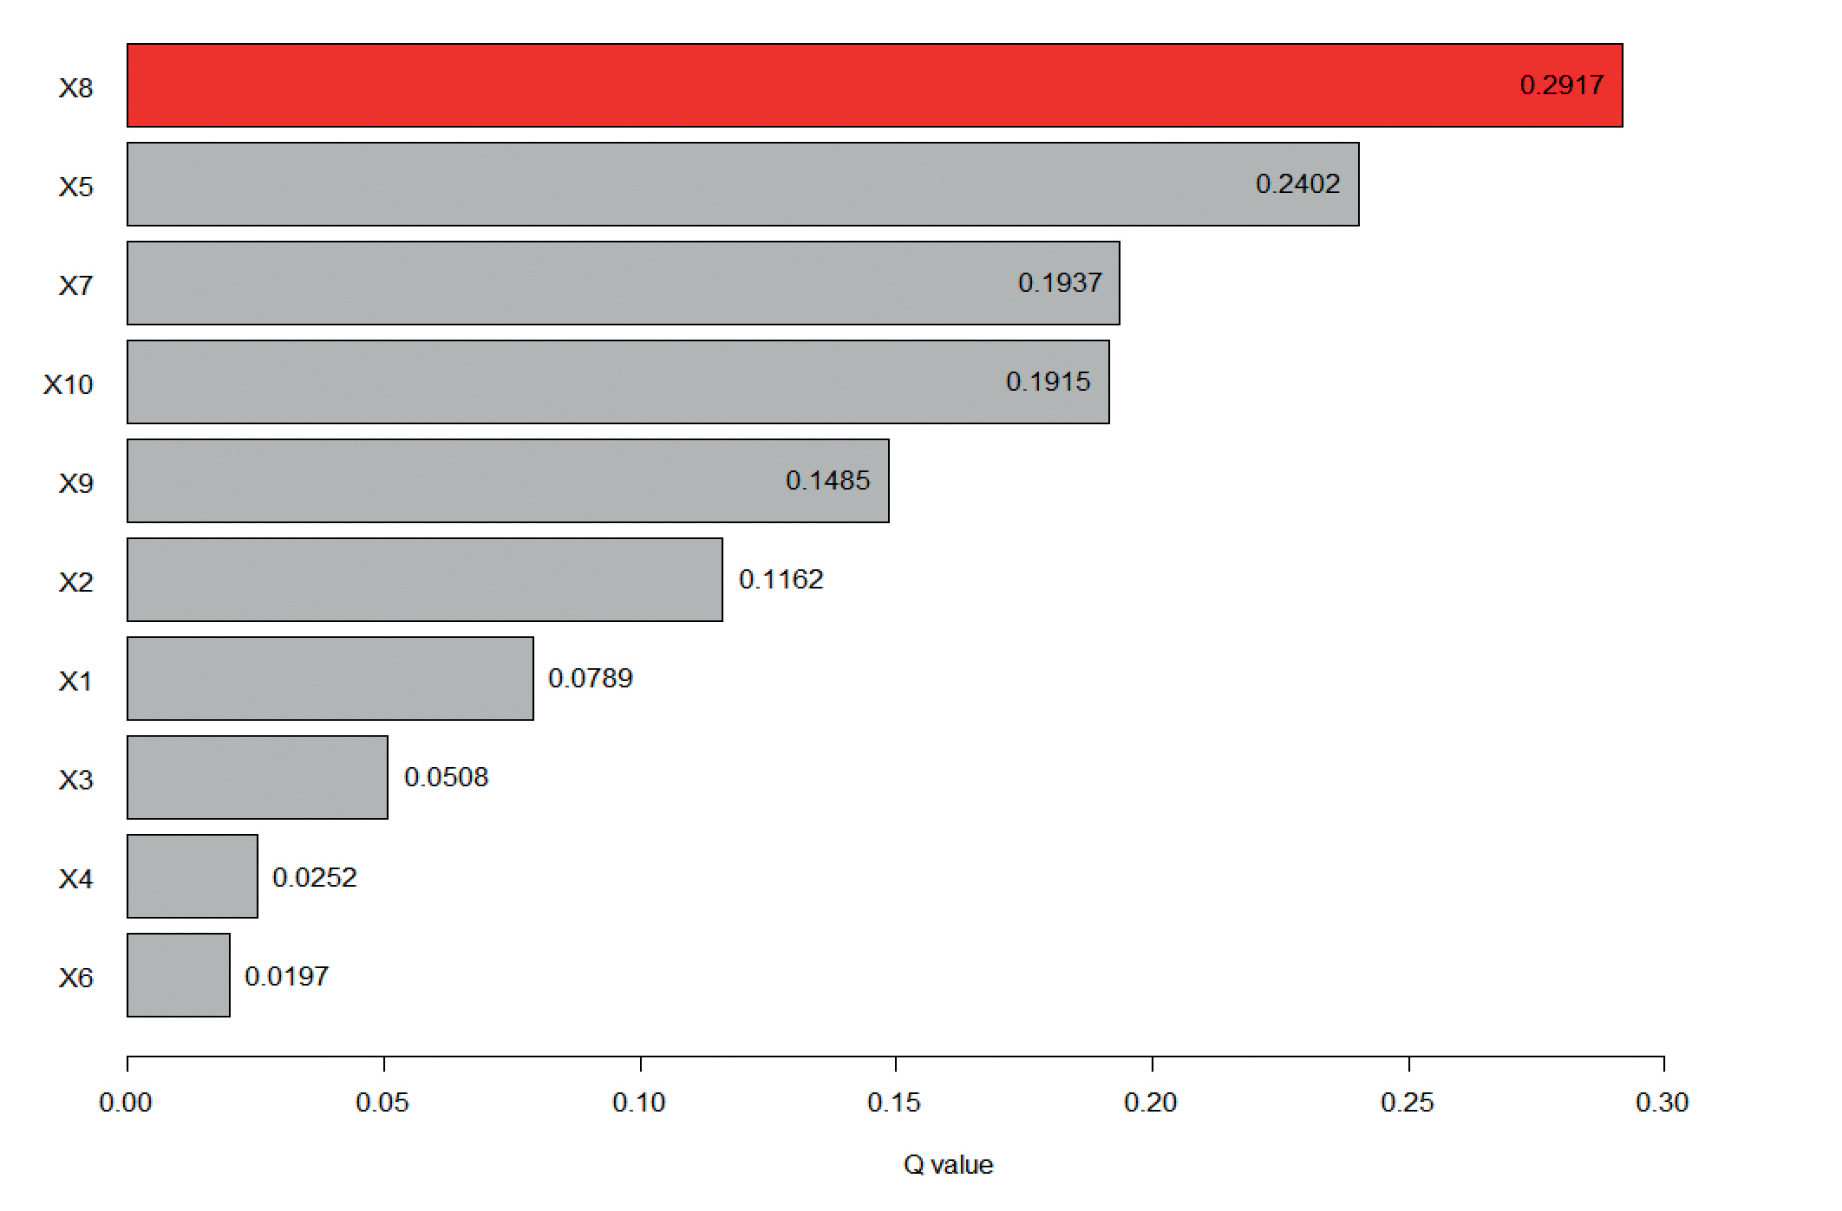
From the results of single-factor detection (Fig. 13), the single-factor explanatory power of natural environmental and locational conditions on ecological resilience is greater than that of socioeconomic factors. Among them, the driving force of annual average precipitation (X8) and DEM (X5) on ecological resilience, respectively, is 0.291 and 0.240, which is the main driver of the spatial and temporal distribution of ecological resilience, followed by the annual average temperature (X7), which is 0.193, and the driving force of the distance from the provincial road (X4) and the NDVI (X6) is small, which is only 0.025, 0.019. The analysis can be obtained that the impact of each influence factor q value from large to small discharged on the ecological toughness value of the impact of the top five average annual precipitation (X8) > DEM (X5) > average annual temperature (X7) > GDP (X10) > population density (X9), indicating that the strength of each influencing factor to drive the ecological toughness level value of the gap between the difference in the future optimization of the ecological toughness level of the research and exploration should be focused on the natural environment and the perspective of the region.
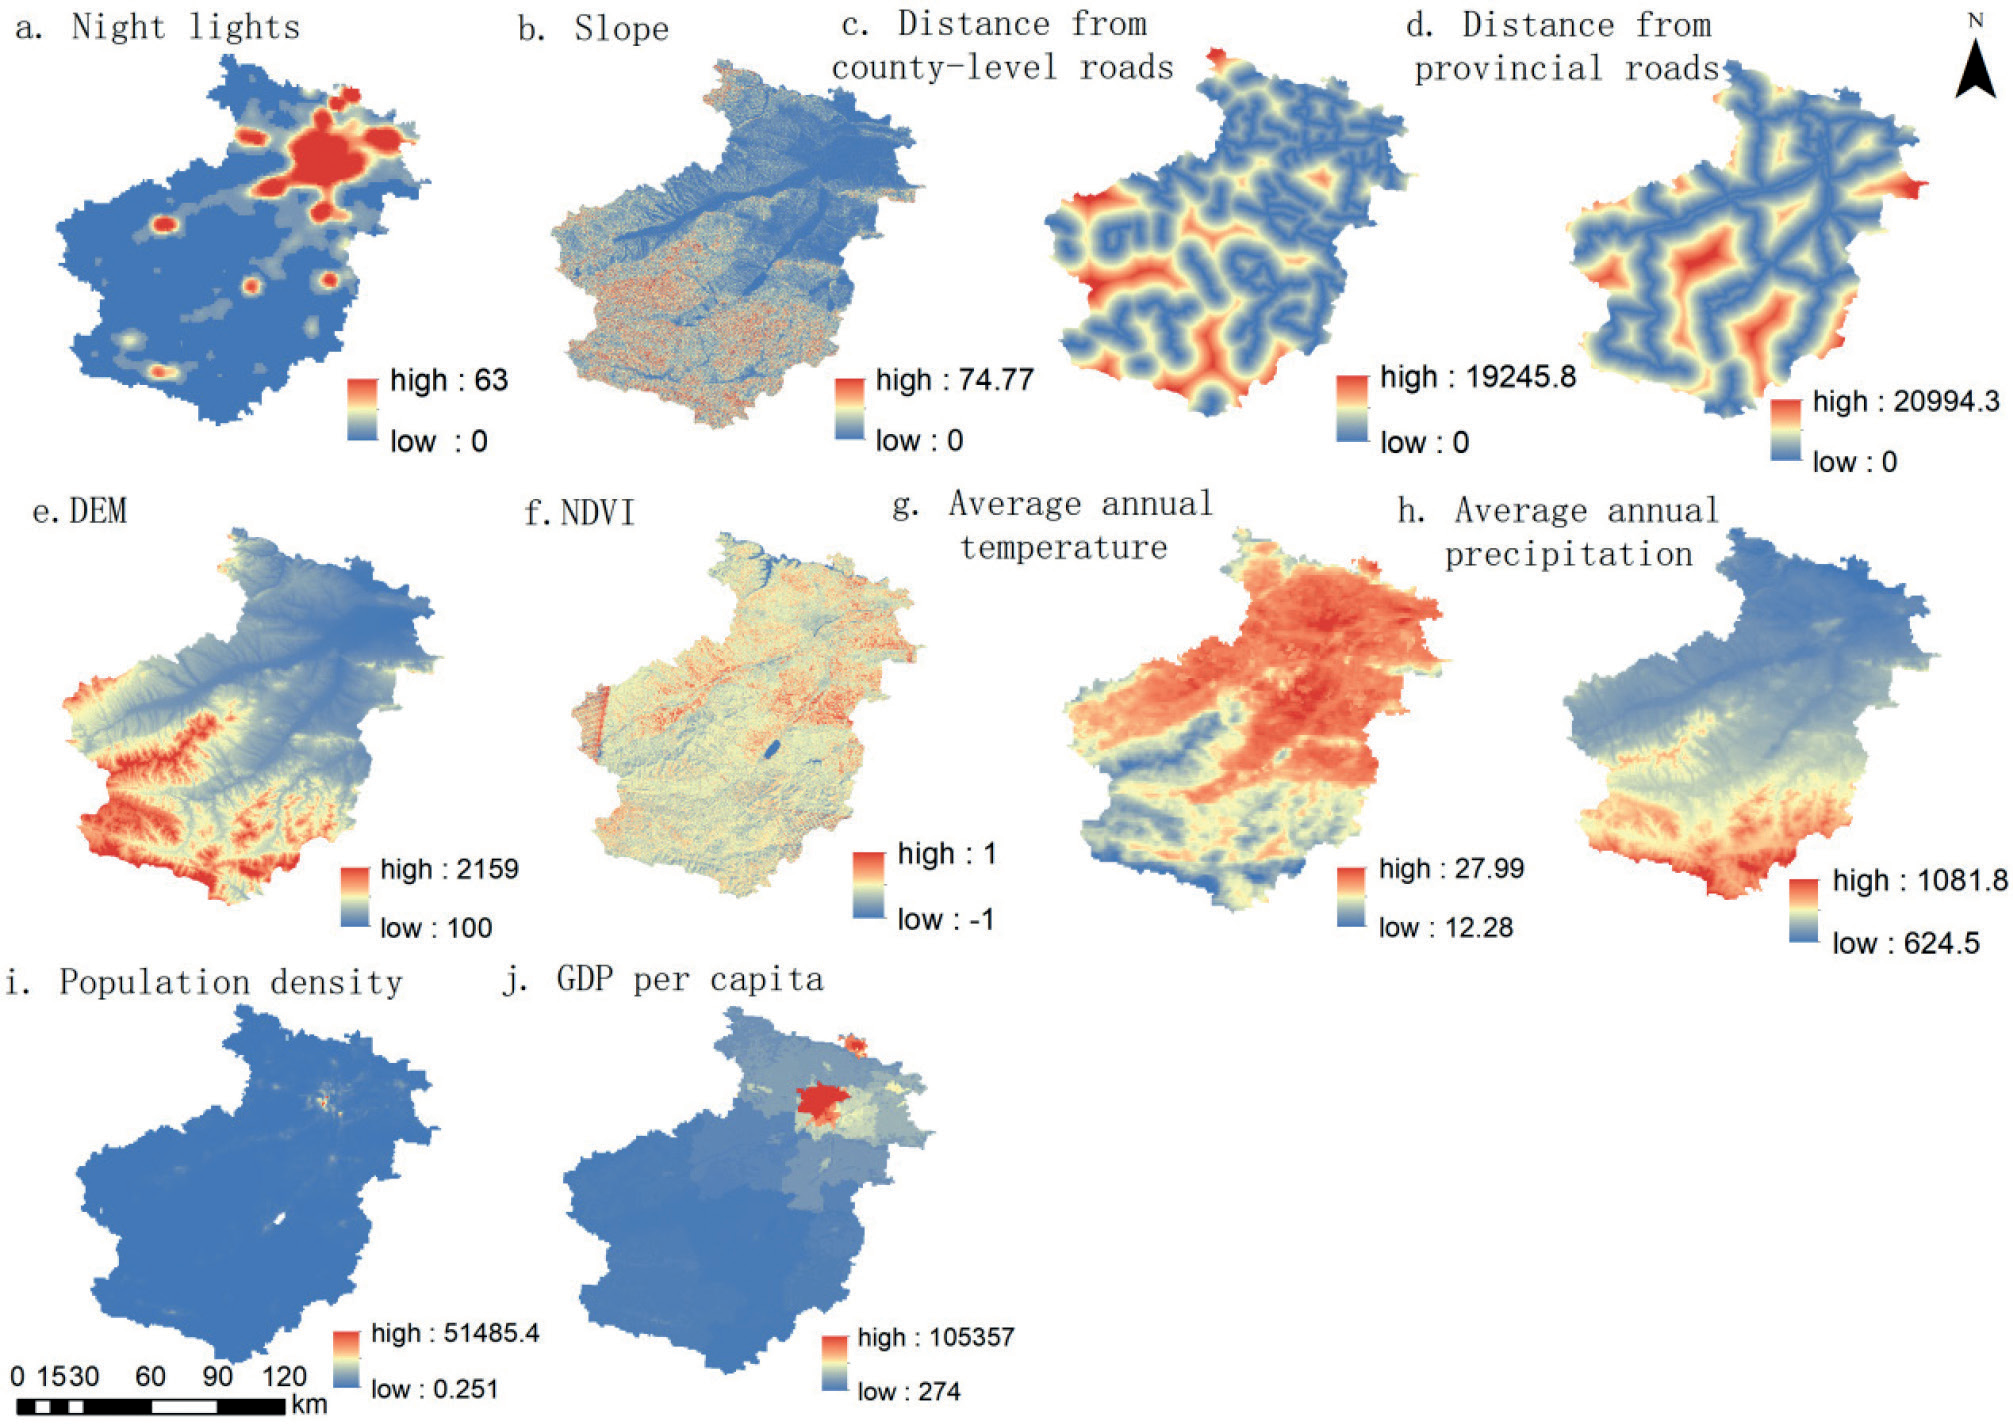
Fig. 11.
Comparison of size effects of spatial units for q values and 90% quantile of driving factors.
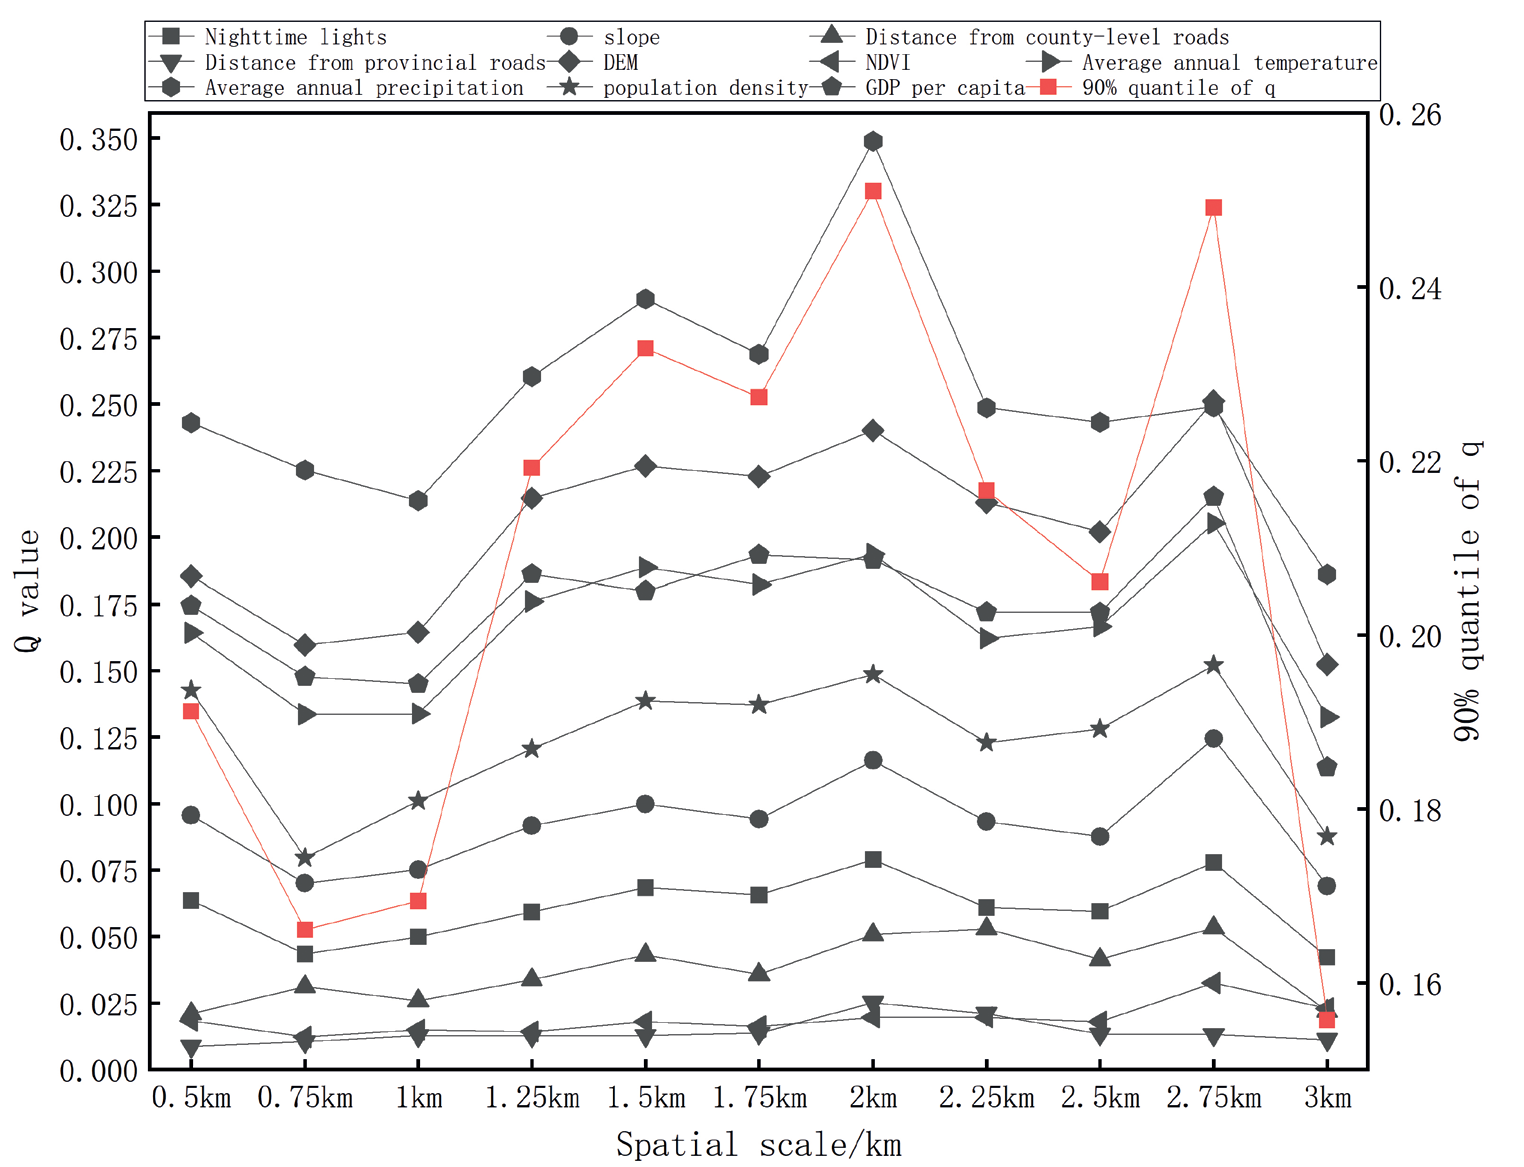
Fig. 12.
2 km optimal spatial discretization.
Note: The part of the figure without a numeric value fails the significance test.
The interaction probes showed that the factor explanatory power of ecological resilience was mainly nonlinearly enhanced and two-factor enhanced after the different influencing factors’ actions. The interaction probes were utilized to study the relationship between the spatial differentiation characteristics of the interactions of each probed factor (Fig. 14). The q-value of any two factors on the interaction is greater than that of any one variable alone, indicating that all the probes will enhance the influence after two-by-two interaction, which also confirms that the development and change of ecological resilience is a complex process of multi-factor interaction.
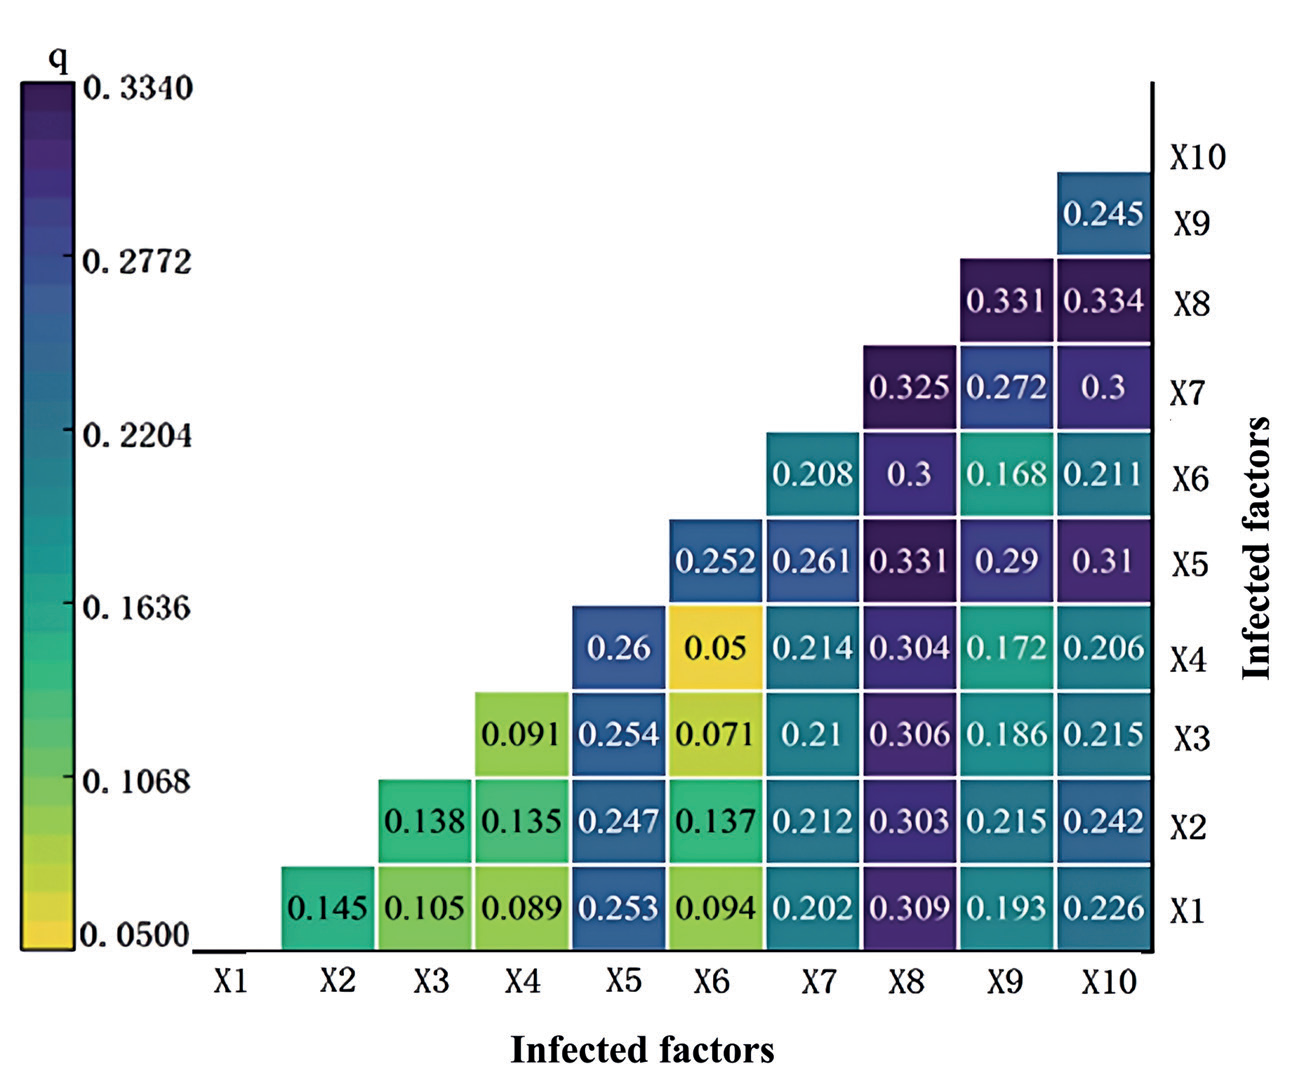
On the whole, the combined effect of different factors enhanced the explanatory power of ecological resilience, among which the interaction of mean annual precipitation (X8)∩GDP per capita (X10) had the strongest explanatory power of 0.334, followed by the interaction of mean annual precipitation (X8)∩population density (X9) and DEM (X5)∩mean annual precipitation (X8) with 0.331, and that with the interaction of distance to county roads (X4)∩NDVI (X6) with 0.05. The interaction of socio-economic factors and locational conditions with natural factors significantly enhanced the explanatory power, and the interaction of social and economic factors and locational conditions with natural factors had the strongest explanatory power, with 0.05, was the lowest at 0.05. The explanatory power of socio-economic factors and locational conditions was significantly stronger after interacting with natural factors.
Discussion
Ecological resilience has become a hot topic in current research, but its research is still mainly theoretical, and the practice of quantitative assessment is relatively scarce [31]. Due to the difficulty of data acquisition, it is difficult to reveal the specific characteristics at the micro level [32]. In this study, we attempted to utilize land use data and combine ecological elements, such as the landscape pattern index and the ecosystem service value parameter, to more comprehensively reveal the micro-differentiated characteristics of ecological resilience in Luoyang. Ecological risks were modeled mainly through risk assessment, and potentials were represented with the help of ecosystem service values. The selection of these methods and indices is somewhat influenced by subjective consciousness and lacks a more rigorous and authoritative reference standard. Therefore, future research needs to dig deeper into the connotation of the concept of ecological resilience to promote more precise and in-depth research in this field. This is consistent with the research in [33], which uses time-series datasets such as farmer survey data, farmer land ownership data, and micro land use data to explore the spatiotemporal evolution characteristics of social-ecological landscape resilience, revealing the evolutionary relationship between social-ecological landscape subsystems and overall landscape system resilience. This indicates that micro-scale research can provide more detailed and specific information on ecological resilience.
A city is an intricate socio-ecological system. Its ecological resilience emerges from the synergy of multiple economic, social, resource, and environmental dimensions. To realize the goal of urban resilience, these elements need to develop in a coordinated manner. These facets ought to be integral to any appraisal of urban ecological resilience, necessitating a holistic and consolidated evaluation approach that taps into diverse data sources to augment the precision and comprehensiveness of such assessments [34]. As most researchers have pointed out [35], urban systems are complex, and urban resilience is a comprehensive concept involving multiple dimensions, evaluated through geographic spatial data, landscape pattern analysis, and landscape dynamic simulation modeling to assess ecosystem resilience at the management scale. In addition, micro-ecological resilience assessment of each element is an important direction for future research, which can help deeply understand the meaning of urban ecological resilience and provide scientific guidance for sustainable urban development.
Drawing from ecological resilience theory, the Luoyang-specific urban ecological resilience evaluation model effectively gauges a city’s aptitude to navigate unpredictable ecological hazards and withstand pressures amidst the dual influences of anthropogenic and natural ecological systems. Elevated levels of ecological resilience denote heightened tolerance, bounce-back capacity, and adaptability to environmental catastrophes; conversely, areas with lower resilience consistently feature prominently across varying epochs. Given the urban ecosystem’s exposure to a fluctuating, intricate milieu, bolstering the resilience quotient becomes pivotal for fostering a city’s healthy and enduring prosperity. In 2021, Feng Xinghua conducted a risk connectivity potential evaluation using Shenyang as an example [36], indicating that artificial adjustments to different zoning conditions in Shenyang can improve urban resilience to a certain extent, have a positive effect on urban risk prevention and control, and promote the development of urban resilience. Displayed similar results to Luoyang City.
With the acceleration of economic growth, the transformation of land use is becoming increasingly complex. A large amount of ecological land is converted into building land, which leads to the continuous shrinking of natural ecological space and the intensification of structural fragmentation. As a result, the ecological connectivity and stability of the landscape are declining, posing significant challenges to maintaining ecological balance and habitat integrity within the city limits.
Conclusions
Through the lens of resilience theory, this paper establishes a quantitative research method by devising an ecological resilience measurement model grounded in risk, connectivity, and potential. In addition, the spatial distribution and heterogeneity are analyzed, which breaks through the previous one-sided evaluation methods. Explore and measure various factors that comprehensively affect the development of ecological resilience in a single city. Based on the grid-scale research unit, the city’s micro-difference characteristics of ecological resilience are finely described. The distribution pattern of ecological resilience in Luoyang City is low in the north and high in the south. High resilience areas are related to natural ecologically rich areas, such as Songxian County and Luanchuan County. In general, the ecological resilience level has declined, and the ecological protection areas in the south and the Funiu Mountains have higher ecological resilience due to the rich forest resources, high vegetation coverage, and being less affected by human activities.
From 2010 to 2020, the focus of ecological resilience shifted to the northeast, and the resilience of the south-central region was gradually better than that of the north. Compared with 2010, the spatial distribution of the local Moran index of Luoyang’s ecological resilience in 2015 and 2020 was mainly manifested in the narrowing of the scope of the central and southern districts and counties, while the spatial distribution of high-high-type gathering areas did not change significantly. The results of single-factor detection show that the driving force of the natural environment and location conditions on resilience is greater than that of social and economic factors. The influence of each influencing factor on the ecological resilience value is ranked from high to low: annual average precipitation > DEM > annual average temperature > GDP > population density. This shows that the research on optimizing ecological resilience should focus on the natural environment and location perspective. The interactive detection shows that the explanation of different factors in ecological resilience is mainly nonlinear enhancement and two-factor enhancement. Therefore, through the scientific discretization method and classification number selection, the influence of driving factors on ecological resilience can be more accurately revealed, which provides an important basis for formulating scientific and effective promotion strategies.
The ecological restoration of national territory should be tailored to local conditions, and restoration measures should be selected based on the characteristics and resilience of the ecosystem. The ecological space of Luoyang City is divided into seven categories, among which the low ecological resilience and fragile areas need to reshape their ecosystems to promote sustainable development. The ecological potential enhancement zone is making positive progress, supporting the city’s ecological development. The ecological connectivity enhancement zone is affected by various factors and has low ecological connectivity. It is necessary to improve the ecosystem and expand the ecological space. At the same time, the ecological risk challenge areas are distributed along the river, and the ecosystem is fragile. It is necessary to strengthen the threshold research on the risk resistance of the ecosystem service functions in the river basin and improve the risk resistance. The natural environment in the ecological resilience enhancement zone is well preserved, and it is necessary to protect the natural environment and reduce the negative impact of human activities. As a link connecting various regions, the ecological resilience and stability zone must optimize the ecological spatial structure.

