

Introduction
Ecosystem services are the benefits that human beings obtain directly or indirectly from the ecosystem [1, 2]. An intact and functional ecosystem can provide numerous valuable services for human beings, and it can directly or indirectly affect their survival and development [3]. However, with the acceleration of urbanization, the depletion of natural capital and the loss of ecosystem services are being increasingly incurred [4]. Strengthening the research on ecosystem services is not only needed for maintaining ecosystem stability, but also serve as the basis for safeguarding ecological civilization and realizing regional sustainable development. At present, China is in the critical stage of socio-economic transformation, and the ecological environment is attached with great importance. In addition, the construction of ecological civilization is being mentioned at the national strategic level, and ecological security assessments, ecological red line divisions and ecological reconstruction divisions are also being constantly deepened [5]. As an important guarantee for national ecological security, mountainous areas in southwest China are the main battlefield for ecological civilization construction and the ecological barrier for social and economic development in plain areas [6]. With the rapid development of social economy, the contradiction and conflict between the vulnerability of the mountain ecosystem and high-intensity human activities have made mountainous areas gradually become the problem area of economic development, and the resource environment and ecological security problems brought by land use change have become increasingly prominent [7, 8]. Therefore, these issues have led many scholars to discuss the dynamic change of law regarding land use/land cover(LULC) [9, 10], as well as its impact on ecosystem services from different aspects [11, 12].
Ecosystem service value (ESV) is an important parameter through which to quantify the intensity of ecosystem services [3], and it can help to evaluate the relationship between human economic society and natural ecosystems. The value of each ecosystem service is closely related to human welfare [13]. The study of the differentiation and change in the ESV in temporal and spatial structures can better serve the construction of ecological civilization and the sustainable development of a social economy; as such, it has become the focus of academic circles and relevant government departments. The ESV value can be used to measure the state of the ecological environment, but there is no unified accounting method at present [14]. In 1997, Costanza conducted the first quantitative global assessment of the ESV with the application of the public willingness-to-pay method [15], and later refined it in 2014 [16]. However, it has limited direct applicability to different countries and needs to be tailored to regional heterogeneity [17]. Subsequently, Chinese scholar Xie Gaodi compiled a table of the “equivalent value of ecosystem services per unit area of China’s ecosystem” based on actual conditions, which provided an important basis for the calculation of the ESV in China [18, 19], and was often used over a wide geographic range for the low data requirements and simple accounting processes. However, when estimating the ESV, there were great differences in the calculation results due to the differences in natural conditions, socio-economic status, and population development level in different regions [20, 21]. As an important component of natural geographical elements, terrain affects land use change to a certain extent and has an important impact on land use pattern and spatial structure characteristics [22, 23]. Then, what spatial differentiation of the ESV will be brought about by different terrain gradients? What kind of laws exist? How will these laws guide the construction of regional ecological environments? Previous studies have shown that the ESV is closely related to geomorphic features, and the spatial differentiation of the ESV reflects evident geographical distribution characteristics [24, 25]. Exploring the distribution characteristics and rules of the ESV from the perspective of topographic gradients is helpful in better understanding the correlation among the driving factors of LULC changes [26].
The characteristics of terrain are characterized by elevation, slope, and topographic relief. Existing studies on topographic gradients mainly involve the calculation of the terrain position index only, albeit with the use of elevation and slope parameters [27]. In fact, topographic relief is a numerical measure of the terrain cutting depth and an important index through which to characterize geomorphic types [28]. Actually, the comprehensive determination of multiple indexes including slope, elevation and topographic relief can more truly reflect the characteristics of mountains [29]. Therefore, elevation, slope, and relief parameters should be combined to calculate the topographic position index when classifying the topographic gradient. Yuxi City, as a typical mountainous area in southwest China, is in the western margin of the Yunnan–Guizhou Plateau with significant topographic gradient. Based on the topographic gradient effect, this study studied the ESV and LULC changes in Yuxi City, as well as explored the impact of LULC change and the topographic gradient on the ESV so as to provide a theoretical basis for ecological environment construction and land management. It also provides certain references for ecological civilization construction, the sustainable development of a social economy, as well as for the formulation and implementation of territorial space planning in plateau and mountainous areas.
Materials and Methods
Study Area
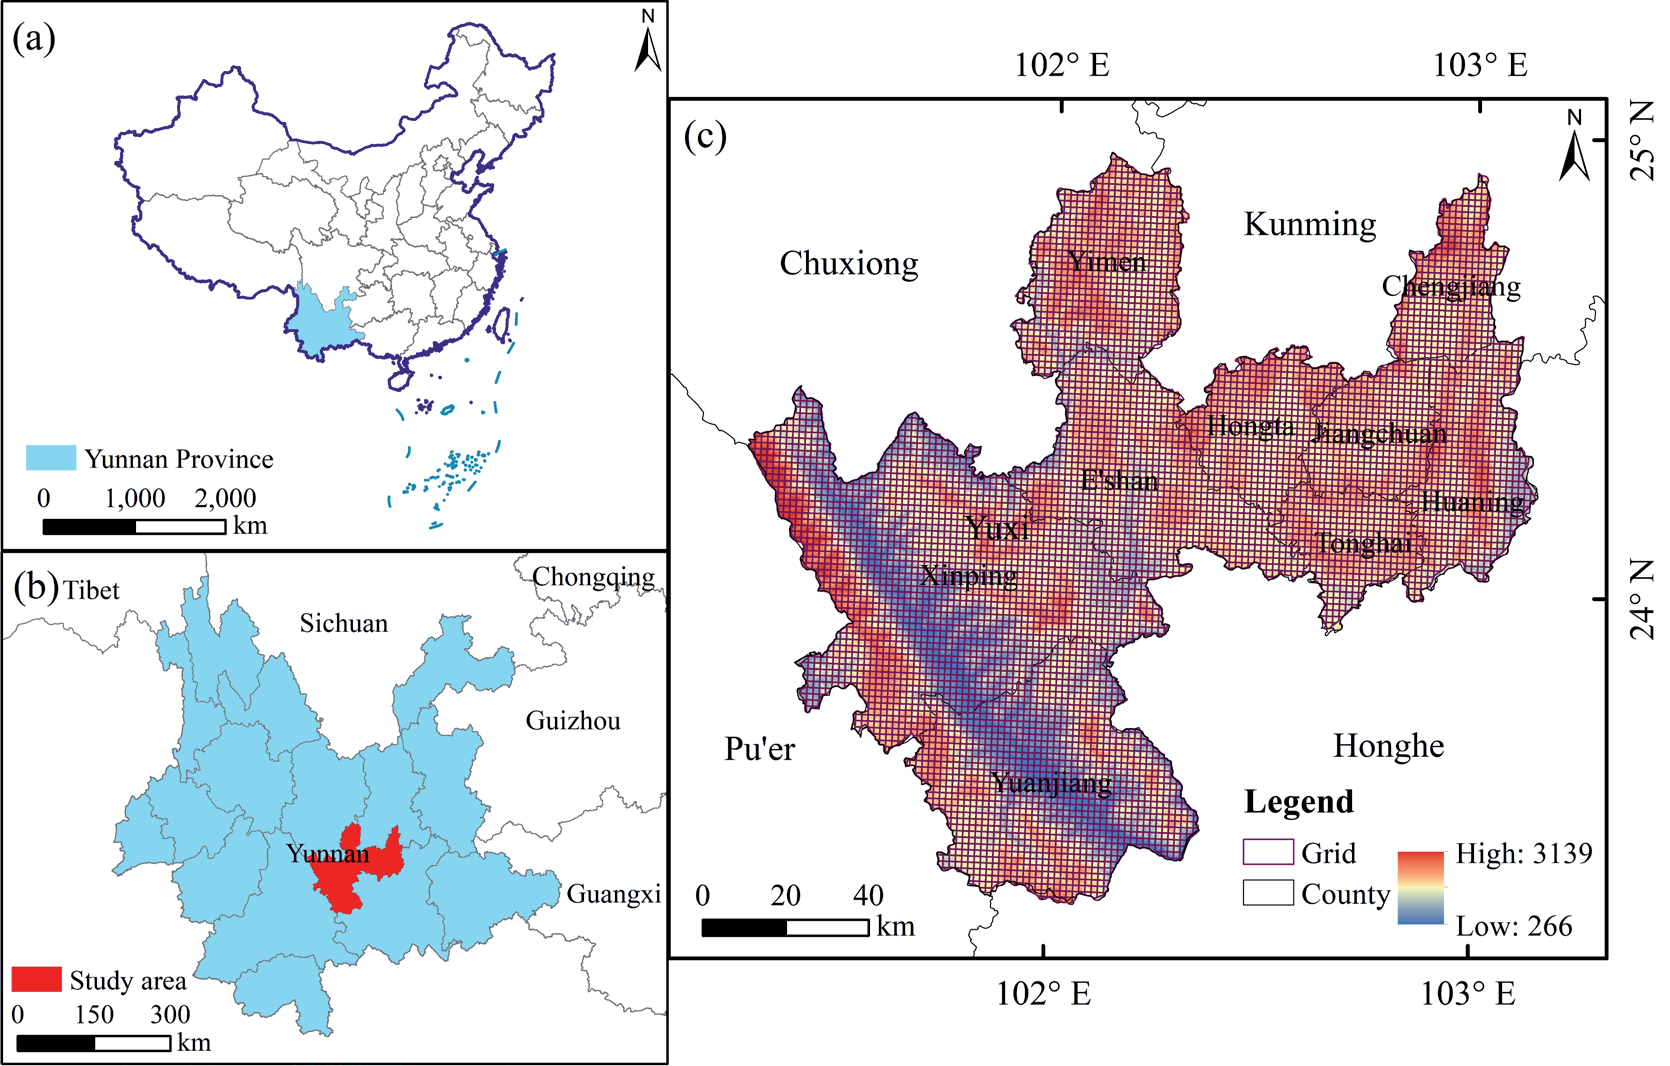
Yuxi is located in the center of Yunnan Province in the southwest border of China (23°18′59′′~24°57′20′′N, 101°16′25′′~103°09′03′′E) (Fig. 1). It is a typical mountainous area with significant topographic gradient characteristics. The terrain is high in the northwest and low in the southeast, with a staggered distribution of mountains, canyons, plateaus, and basins. The western area is mainly populated with a deep-cut alpine valley landform. The Central Yunnan mountains belong to the central eastern area, where there are mainly mountain landforms and most of the terrain undulates. In addition, there are many intermountain basins of different sizes scattered between the mountains. The eastern area is mainly dominated by plateau lake – basin landforms, with three plateau lakes: Fuxian Lake, Xingyun Lake, and Qilu Lake. Chengjiang, Jiangchuan, and Tonghai lacustrine basins are formed around the three lakes, with flat and open terrains [30]. As is the case in low– latitude areas, these lakes belong to a subtropical plateau monsoon climate, where the sunrise time is long, and the heat is relatively rich. Due to the wide difference in the elevation of the terrain, the vertical climate is evident. From the top of the mountains to the bottom of the valleys, the annual and diurnal temperature difference is significant [31], which also forms the clear vertical characteristics of the vegetation and the significant differences in the ecological environment.
Data Sources and Processing
In order to analyze the characteristics of the terrain gradient effect of the ESV, the following steps were adopted: (1) to investigate and obtain the natural environmental conditions such as terrain data in the study area; (2) based on the LULC change data, the status quo of the LULC areas and their temporal-spatial change characteristics were analyzed; (3) to calculate and analyze the temporal and spatial changes in the ESV based on LULC data; and (4) the topographic position index was calculated by combining elevation, slope, and topographic relief parameters, and the response characteristics of the ESV were also analyzed from the topographic position gradient.
The data supporting this study mainly include three categories. (1) The digital elevation model (DEM) data (30 × 30 m), which were obtained from the Geospatial Data Cloud (http://www.gscloud.cn, accessed on 20 Sep. 2022), slope data, and relief data. These were calculated from the DEM data that were analyzed with ArcGIS10.6, but as the extraction of relief had a scale effect, it was necessary to first determine the optimal statistical window by means of a mean change point analysis, which was conducted as per previous reference[28]. (2) The Landsat series images were downloaded from the United States Geological Survey (USGS) website (https://earthexplorer.usgs.gov, accessed on 6 Oct. 2022). Image resolution was 30 m and the time series were 2000–2020, and the images were divided into three periods (2000, 2010, 2020). These data were generated through manual visual interpretations with an accuracy of more than 85%, and such that they could meet the research needs. The LULC types were divided into 6 primary categories, including cultivated land (CL), grassland (GL), forest land (FL), wetland (WL), water bodies (WB), and built-up land (BL). (3) The data on the output, sown areas, as well as the average price of corn, wheat, and rice were obtained from Yuxi Statistical Yearbook (accessed on 10 Nov. 2022) during the 2000–2020 period, and also the Compilation of National Agricultural Product Cost and Benefit Data (2020) (https://www.yearbookchina.com/, accessed on 12 Nov. 2022).
Methods
LULC Transfers Chord Diagram
The visualization of the relationships between data can be presented by a transfer chord diagram, in which the data points are arranged in circular and radial orders, and lines are used to show the relationships between the data [26]. In the transfer chord diagram, different colors and the thickness of the lines show the different types of connections and strengths. The LULC change mainly reflects the mutual transfer relationship between different land-use types. Therefore, the transfer chord diagram can be used to visually display the transfer matrix of LULC change and to realize the visualization of the direction and intensity of land-use type transfer.
Calculation of the Ecosystem Service Value
In order to eliminate the impact of crop price fluctuations on the total value, the ESV equivalent per unit area, which was revised by Xie in 2015 [32], was revised in this study based on the output, planting areas, and the average price of each crop in 2020 for the three food crops in Yuxi. The average grain yield of Yuxi from 2000 to 2020 was 6008.36 kg/hm2. Based on the average selling price of grain in Yunnan Province in 2020 (the Compilation of National Agricultural Product Cost and Benefit Data (2020)), the average selling price of three kinds of grain in Yunnan Province in 2020 was thus calculated to be 2.7224 CNY/kg. Studies have shown that the economic value provided by a natural ecosystem is 1/7 of the grain value provided by farmland per unit area [33], thus the equivalent factor of ecosystem service in Yuxi City was determined to be 2336.74 CNY/hm2. Combined with the actual situation, land-use types were combined and classified to respectively obtain the equivalent ESV for the cultivated land, grassland, forest land, wetland, water areas, and built-up land in Yuxi City (Table 1.).
According to the topographic features, area size, and elevation of Yuxi City, three kinds of grids (500 m × 500 m, 1.5 km × 1.5 km and 3 km × 3 km) were constructed as pre-selected evaluation units. With the help of analysis tools in ArcGIS 10.6 software, the grid size of this study was finally set as 1.5 km × 1.5 km through a trial calculation [31] (Fig. 1). Then, the ESV in each grid could be calculated separately according to the following formula:
where ESV is the ecosystem service value of the grid; Ajis the area of the jth ecosystem of the grid; and Eijis the equivalent of the ecosystem service value per unit area of ith ecosystem function in the jth ecosystem.
Spatial Autocorrelation Analysis
The spatial analysis module of ArcGIS10.6 was used to analyze the spatial autocorrelations of the ESV. Based on the bivariate Moran’s index of GeoDa software, the global spatial correlation between the ESV and topographic position index was explored. The formulas used were as follows.
n n
n∑∑ωkl (Pk − Pmean ) (⋅ Pl − Pmean) Global Moran s I' = k=1 ln=1 n n
Where Pk and Pl are the values of patch k and l, respectively; ωkt is the weight coefficient matrix; and n is the number of patches.
Terrain Position Index
To fully reflect the spatial differentiation of the topographic gradients, three topographic factors were used to classify the topographic gradient on the basis of elevation and slope when combined with topographic relief. The formula used was as follows.
where T is terrain position index; E, S, and T are, respectively, the elevation, slope, and topographic relief value of any point; E̅ , S̅ , and T̅ are, respectively, the average elevation, slope, and topographic relief where the point is located.
Land-Use Type Distribution Index
To eliminate the dimensional influence, the LULC-type distribution index was constructed to describe the distribution of different LULC types on the topographic gradient. The calculation formula used was as follows.
Table 1.
ESVs per unit area in different land ecosystems.
where Ii is the land-use type distribution index, Si is the total area of the ith land-use type, Sie is the area of the ith land-use type at the eth topographic gradient, Se is the total area of the eth topographic gradient, and S is the total area of the study area. When Ii>1, then this indicates that the land-use type has a dominant distribution on a certain topographic gradient; the higher the Ii, the clearer the dominance.
ESV Distribution Index
In order to better compare the individual ESVs of the different gradients and to rationally locate the dominant regions, the ESV distribution index was introduced according to the distribution index of the land-use type. The calculation formula used was as follows.
ESV ESV
where IESV is the ESV distribution index, ESVi is the total value of the ith service type, IESVie is the value of the ith service type at the eth topographic gradient, IESVe is the total ESV of the eth topographic gradient, and ESV is the total ESV of study area. If IESV>1, then this indicates that the ecosystem service type has a dominant distribution on a certain topographic gradient.
Results
Characteristics of LULC Change
Spatial Distribution of the LULC Areas
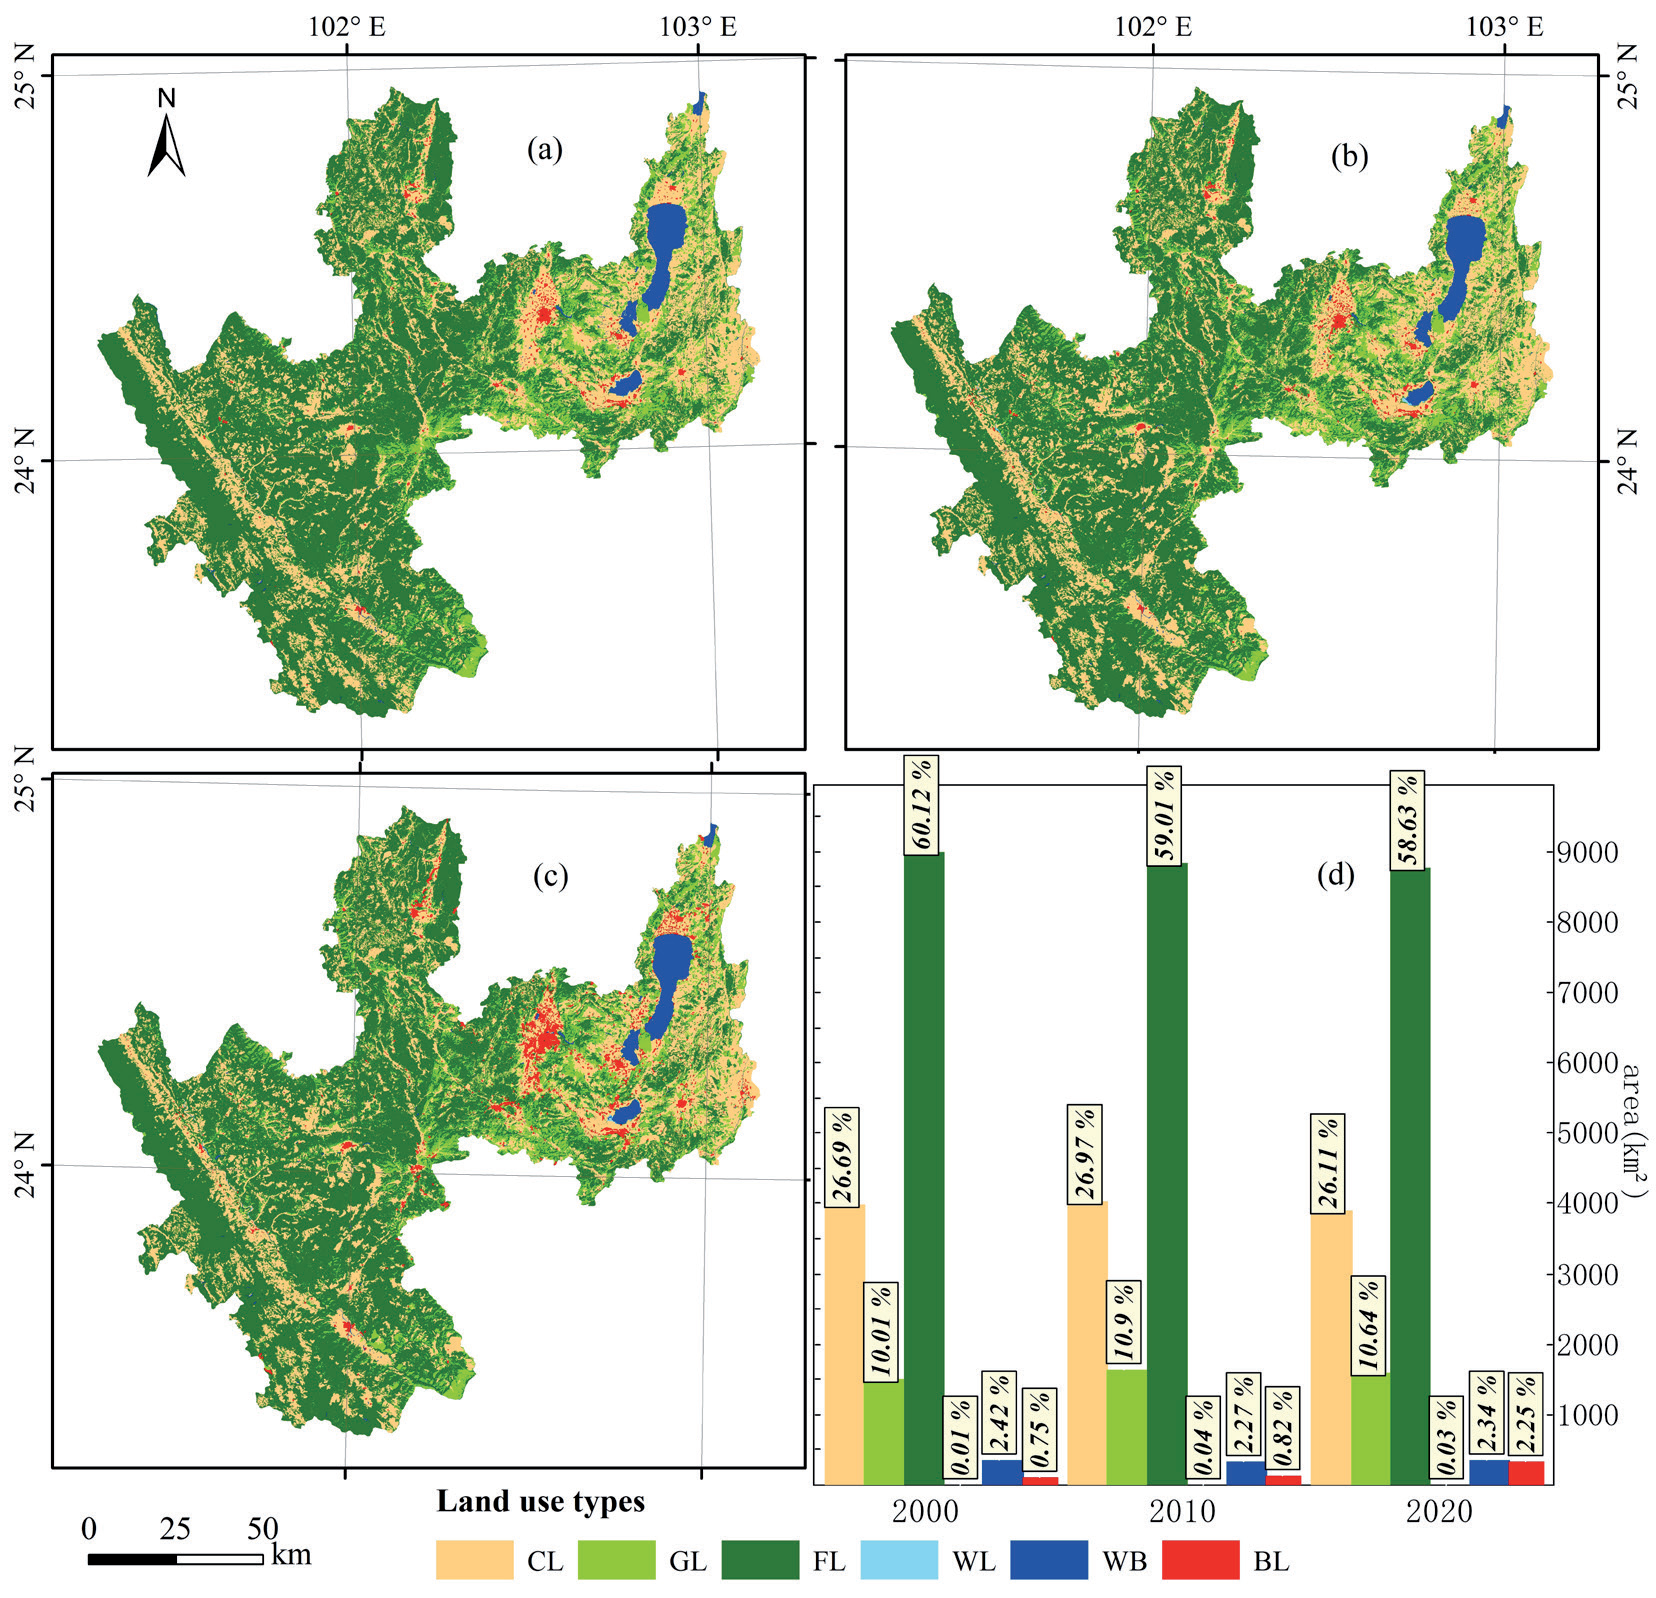
The cultivated land and built-up land are mainly distributed in the eastern and western areas of Yuxi City, mainly in the lake plain and gully river channel areas, which is where the terrain is relatively low and the slope is gentle. The forest land covers the most extensive area in all directions, especially in the central and western mountainous areas. The grassland is mainly distributed in the east and middle, and it also has a large area of coverage in the north and south. The waters are mainly concentrated in the east, including the three lakes – Fuxian Lake, Xingyun Lake, and Qilu Lake – from north to south. There are a few wetlands, and the coverage of them is not clear (Fig. 2a-c). Among the six LULC types, the area of forest land is the largest, ranging from 877392.39 to 899624.74 hm2 (Table S1.), thus accounting for 58.63% to 60.12% of the total area. These are followed by the cultivated land, ranging from 390713.41 to 403567.10 hm2, thus accounting for 26.11% to 26.97% of the total area (Fig. 2d). During the study period, the area of forest land clearly decreased, which was followed by cultivated land; however, the built-up land increased significantly.
LULC Change
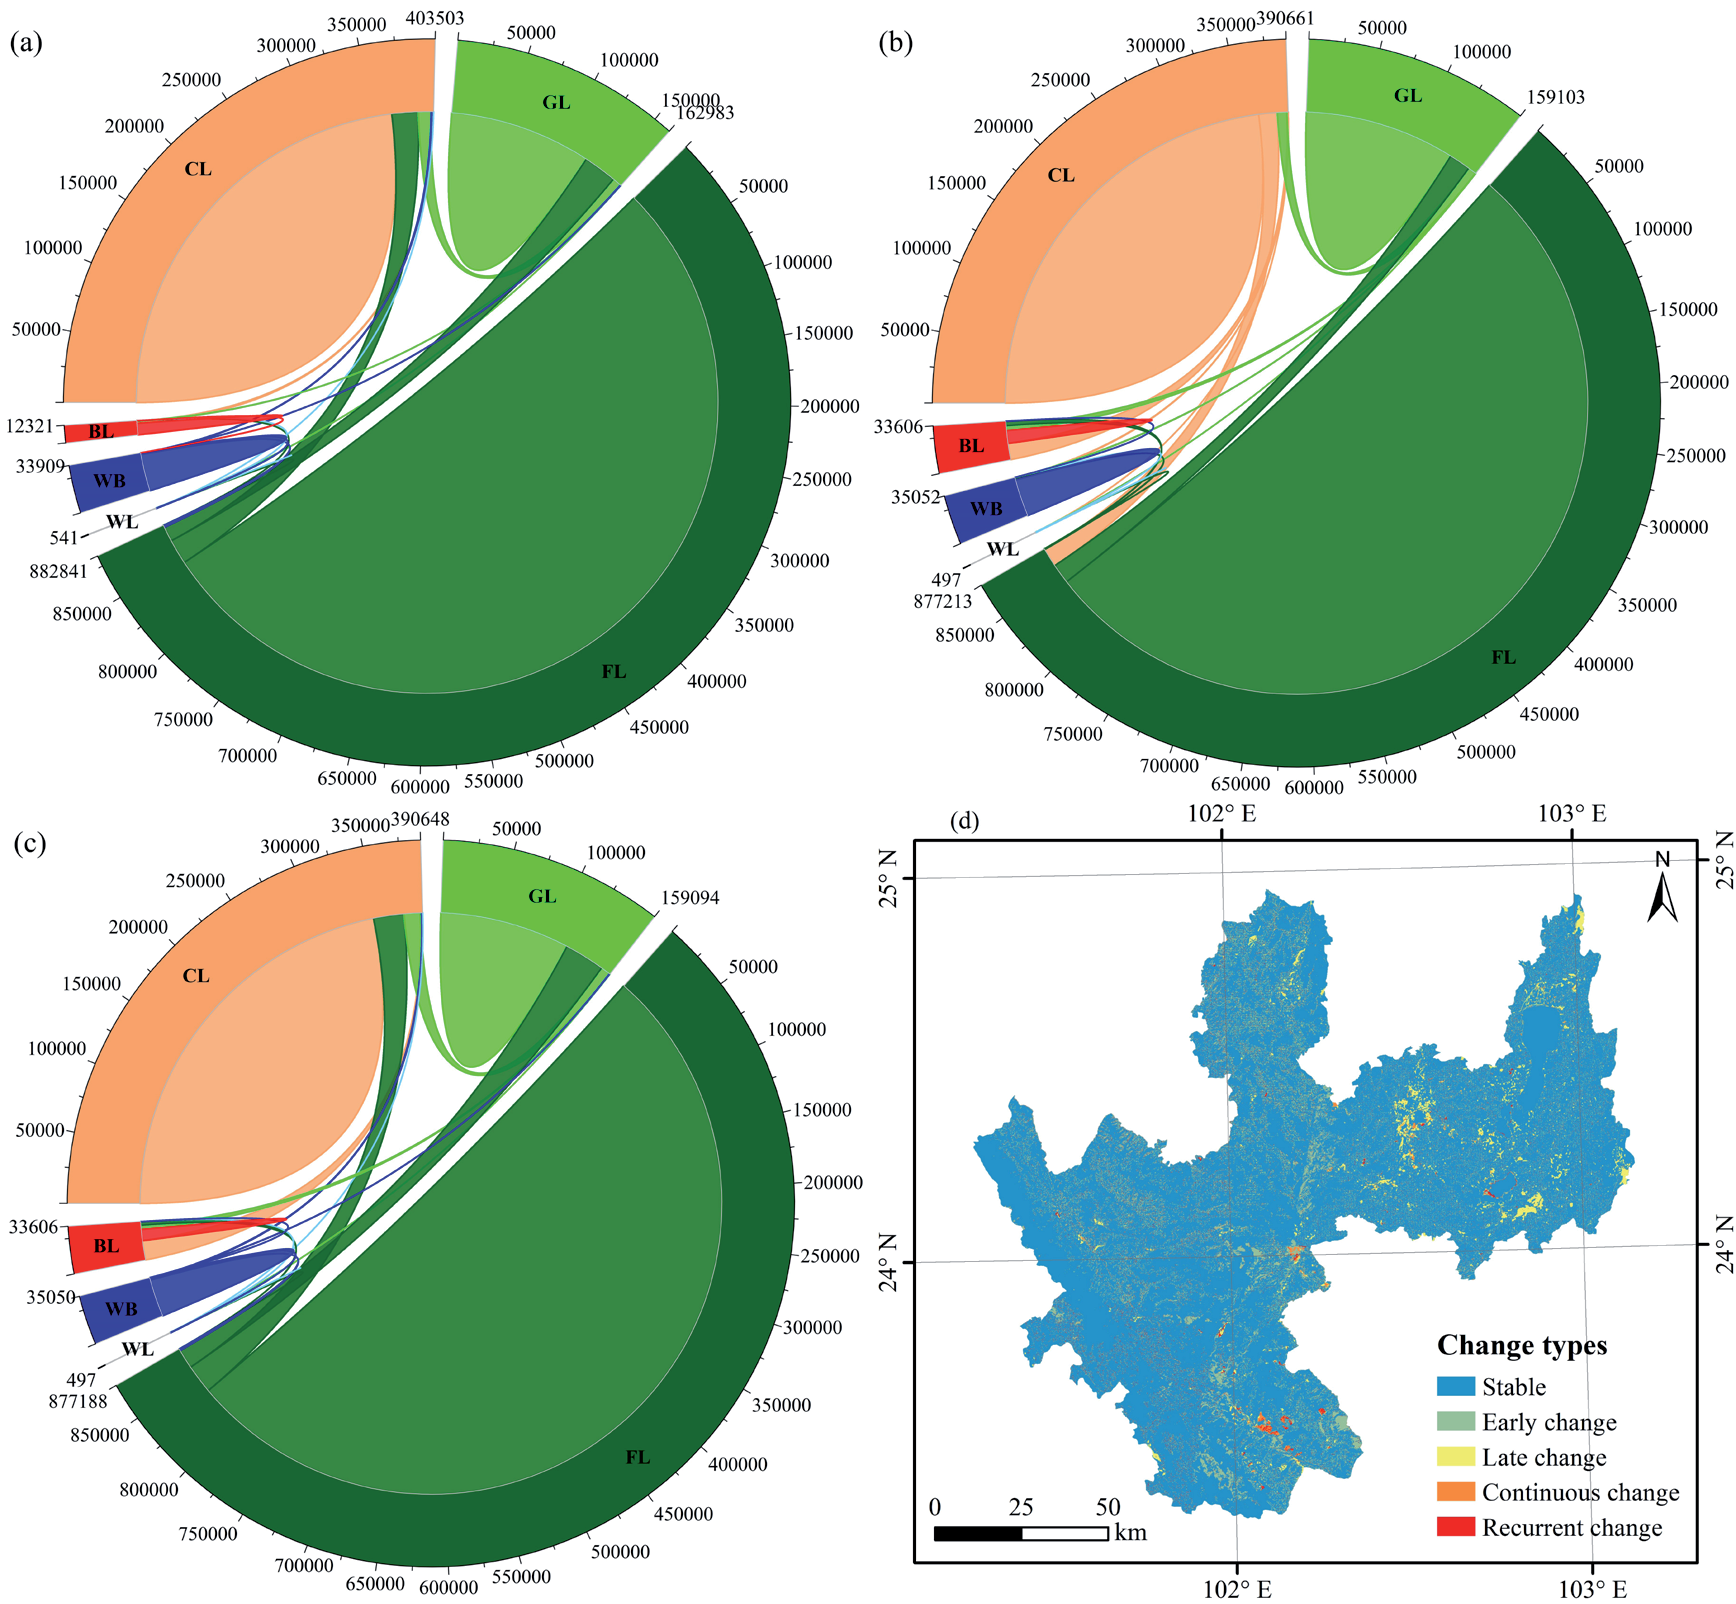
The chord diagram of LULC transfer shows that the land transfer from 2000 to 2010 was slightly higher than that from 2010 to 2020, and that it mainly occurred in the forest land, cultivated land, and grassland areas, which were the main land-use types (Fig. 3a-c). From 2000 to 2010, the transfer-out area of the forest lands was the largest, accounting for 46.47% of the total transfer area; followed by cultivated lands, accounting for 27.93%; and the third was grasslands, accounting for 21.30% (Table S2.). The transfer-in area of forest lands, cultivated lands and grasslands were similar, accounting for about 31% of the total transferred area. From 2010 to 2020, the transfer of the land-use type still occurred mainly among forest lands, cultivated lands, and grasslands, and the transfer-out area was the same as the previous stage (Table S3.), but the transfer-in area of the cultivated lands and grasslands decreased significantly. The transfer of other land-use types was also evident, especially built-up land, whose transfer-in area accounted for 19.96% of the total transferred area in this stage. The net area of built-up land increased by 21,247.67 hm2 (Table S4.), which represented an increase of 172.66%.
Fig. 2.
LULC distribution and area statistics. (a)-(c) LULC distribution from 2000 to 2020; (d) area statistics. LULC types include cultivated land (CL), forest land (FL), grassland (GL), wetland (WL), water body (WB), and built-up land (BL).
The LULC change characteristic map shows that the stable type was the most widely distributed (1307814.48 hm2, 87.42%) (Table S5.), especially in the central, northern, and western mountainous areas (Fig. 3d), which may be influenced by the fact that the main land-use type was forest lands. There was little difference between the early change area and the late change area, which was 76490.01 hm2 and 72499.63 hm2, accounting for 5.11% and 4.85%, respectively. This indicated that there was no distinct difference in the net change area between the two stages.
Temporal and Spatial Characteristics of the ESV
Sequential Changes in the ESV
From 2000 to 2020, the ESV of Yuxi City showed a decreasing trend, decreasing from 588.33⋅108 CNY to 576.39⋅108 CNY, which represents a decrease of 11.94⋅108 CNY with a change rate of -2.03% (Table 2.) (Table S6–S8.). Among these changes, the decrease rate from 2000 to 2010 was the largest (1.27%), and that from 2010 to 2020 was the smallest (0.77%). Among all LULC types, the ESV of the forest lands contributed the most (77.81%), while the wetlands contributed the least (0.10%). The change trends showed that the ESV of the cultivated lands, forest lands, and water areas decreased, which should be due to the occupation of construction lands on other land-use types. While the ESV of the grasslands and wetlands increased, and that of the wetlands grew the fastest, with an average annual growth rate of 6.90%, which should mainly be due to the implementation of the concept of “ecological livable” areas, as well as the ecological protection and construction of lake wetlands.
Table 2.
ESV changes in the LULC areas from 2000 to 2020.
Table 3.
ESV temporal changes in each ecosystem service type from 2000 to 2020.
In terms of different ecosystem service types (Table 3.), the value of food production increased from 2000 to 2010, while the value of other ecosystem services decreased in all periods. The main reason for this was that the accelerated urbanization process and the continuous reduction in ecological land reduced the ESV. From the perspective of the contribution of the different ecosystem services to the ESV, the value of soil conservation was the largest, contributing 17.46%, which was followed by the value of water conservation, contributing 15.75%. These benefited from the ecological location advantage of rich forest resources in Yuxi City, with the forest land areas reaching 60%. Meanwhile, the water resources are abundant, and the area of rivers and lakes is wide, especially with respect to Fuxian Lake, which covers an area of 216.6 km2. Therefore, the contribution rate of the gas regulation, climate regulation, waste disposal, and biodiversity values were relatively high, while the contribution rate of the food production, raw material, and entertainment cultural values were relatively low, which is mainly related to the topographic features that have more mountains and less flat land.
Spatial Distribution of the ESV
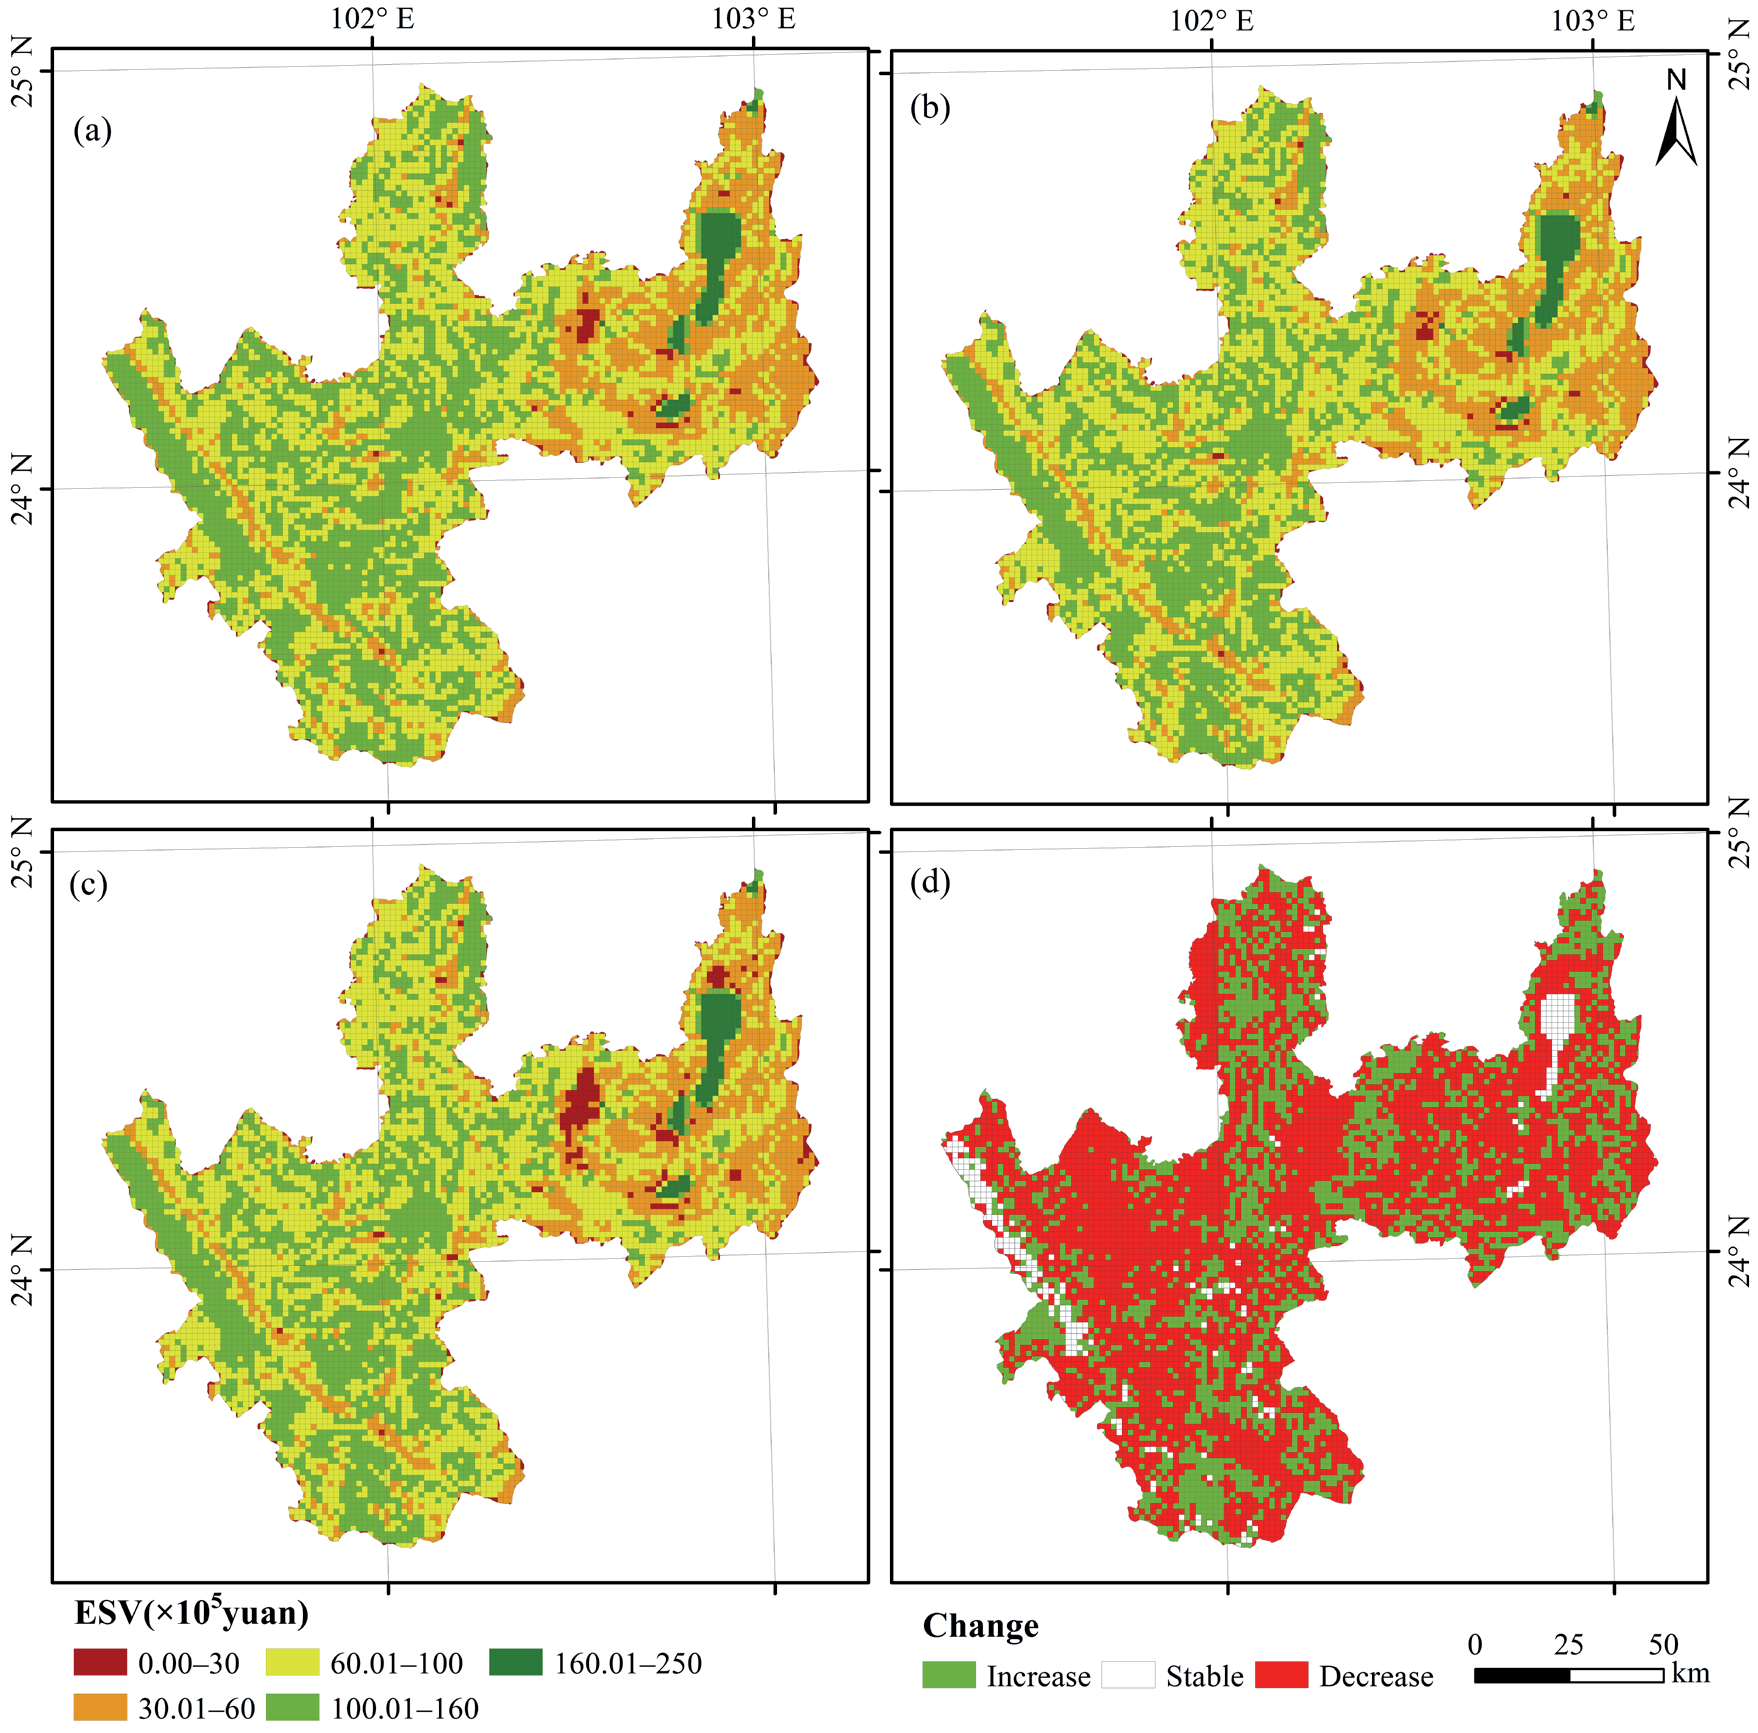
To better reflect the spatial distribution characteristics of the ESVs in different years, appropriate adjustments were made on the basis of natural breakpoint classifications to maintain the consistency of the classification levels. According to its value from large to small, the higher-value zone (160⋅105–250⋅105 CNY), the high-value zone (100⋅105–160⋅105 CNY), the medium-value zone (60⋅105–100⋅105 CNY), the low-value zone (30⋅105–60⋅105 CNY) and the lower-value zone (0.00–30⋅105 CNY) were divided (Fig. 4a-c).
In general, the spatial difference of the ESV in Yuxi City was significantly higher in the west and lower in the east, indicating that the spatial distribution was strongly related to the topographic characteristics. From 2000 to 2020, the areas of the higher-value zone were basically stable, accounting for 1.82% to 1.83% of the total area (Table S9.). It was mainly distributed across the three major lakes, thus forming a massive high-value aggregation area. The proportions of high-value areas and medium-value zones were about 76.62% to 77.91%, and these were mainly distributed in the central region and the Ailao Mountain in the west. The high-value areas showed a continuous decline, while the medium-value areas showed a trend of first rising and then falling. The low-value area accounted for about 19%, and it was mainly distributed in the east and the Yuanjiang River valley, as well as the areas with strong human activities. The lower-value areas accounted for a relatively small proportion, 1.41% to 2.77%, but showed an evident upward trend. These areas were mainly distributed in the urban center of Hongta District and the three lake plains. The growth rate was the fastest from 2010 to 2020, indicating that the urban expansion was rapid and that human activities were the most intense during this period.
Fig. 3.
LULC changes in Yuxi City from 2000 to 2020. (a)-(c) LULC transfer chord diagram from 2000 to 2010, from 2010 to 2020, and from 2000 to 2020, respectively; (d) LULC change characteristics map from 2000 to 2020.
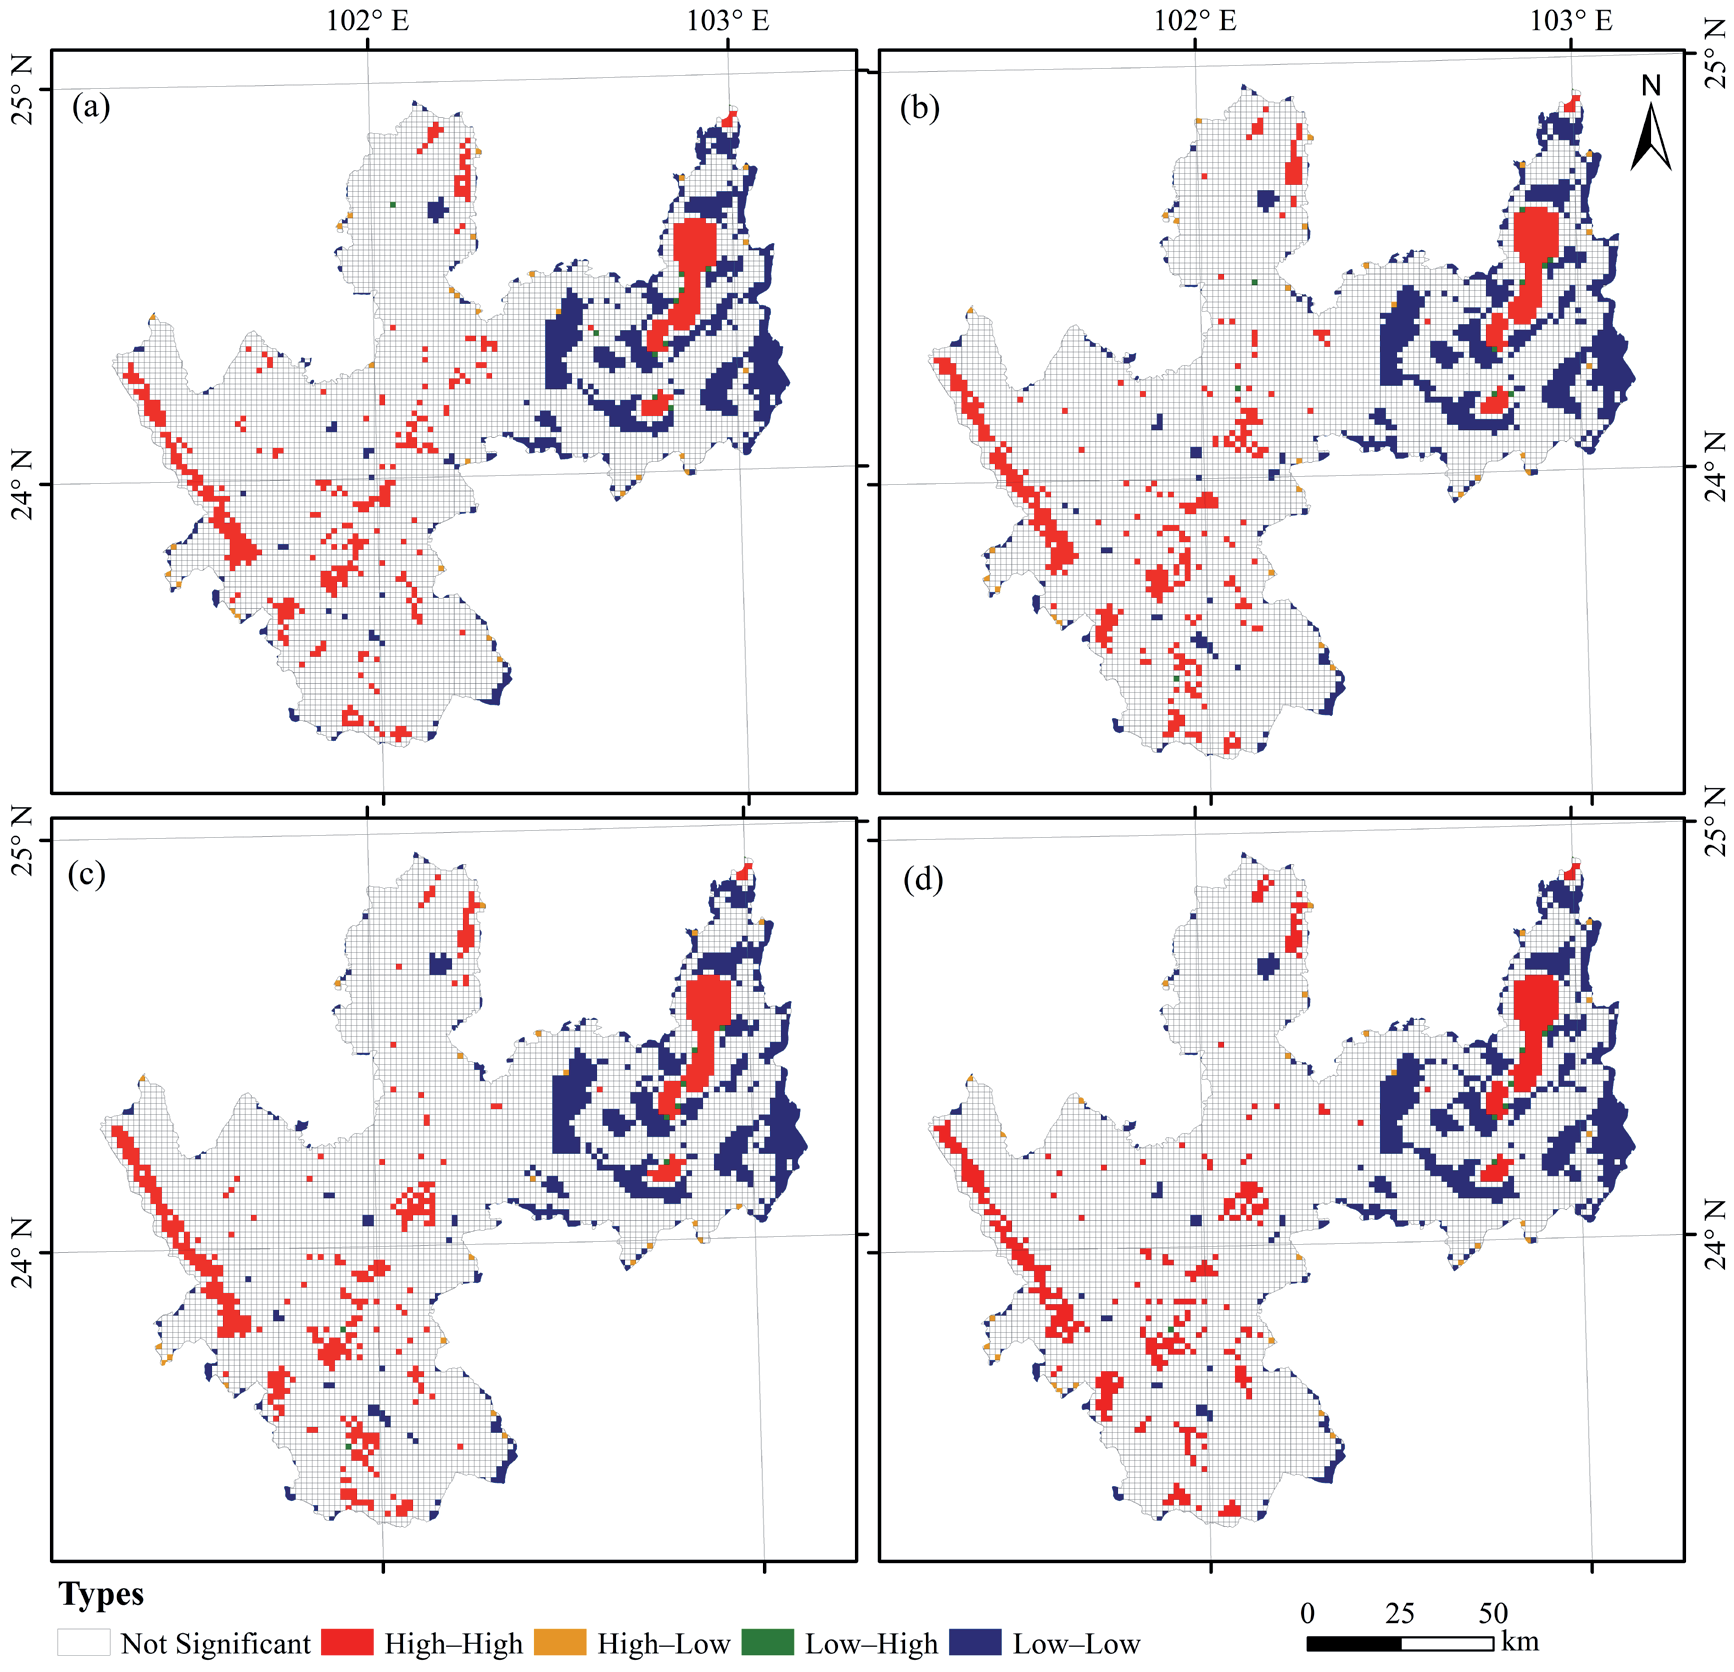
From the perspective of the evolution of spatial patterns, the ESV changes were more evident, with more declining areas than rising areas. The number of descending and ascending grids was 4362 and 2443, respectively, accounting for 61.58% and 34.49% of the total grids, respectively (Fig. 4d). From 2000 to 2010, the declining areas were mainly distributed in the central and western regions, but the declining areas during 2010–2020 were mainly distributed in the eastern region. According to the spatial autocorrelation analysis, the Moran’s I index of the ESVs in 2000, 2010, and 2020 were 0.657, 0.654, and 0.656, respectively, thereby indicating that there was an evident spatial dependence, which presented a high (low) clustering in space. LISA cluster maps were further used to determine the type of local spatial autocorrelations and their significance levels. The local spatial autocorrelation of the ESVs in each year is shown in Fig. 5. for when P = 0.001. The high–high concentration areas were mainly distributed in the three lakes in the east, Ailao Mountain in the west (from northwest to southeast), and certain central mountainous areas. The low–low concentration areas were mostly distributed in the eastern region and formed certain evident low-concentration areas around the three lake plains.
Topographic Gradient Effects of the ESV
Topographic Characteristics and the Terrain Gradient Distribution of LULC Areas
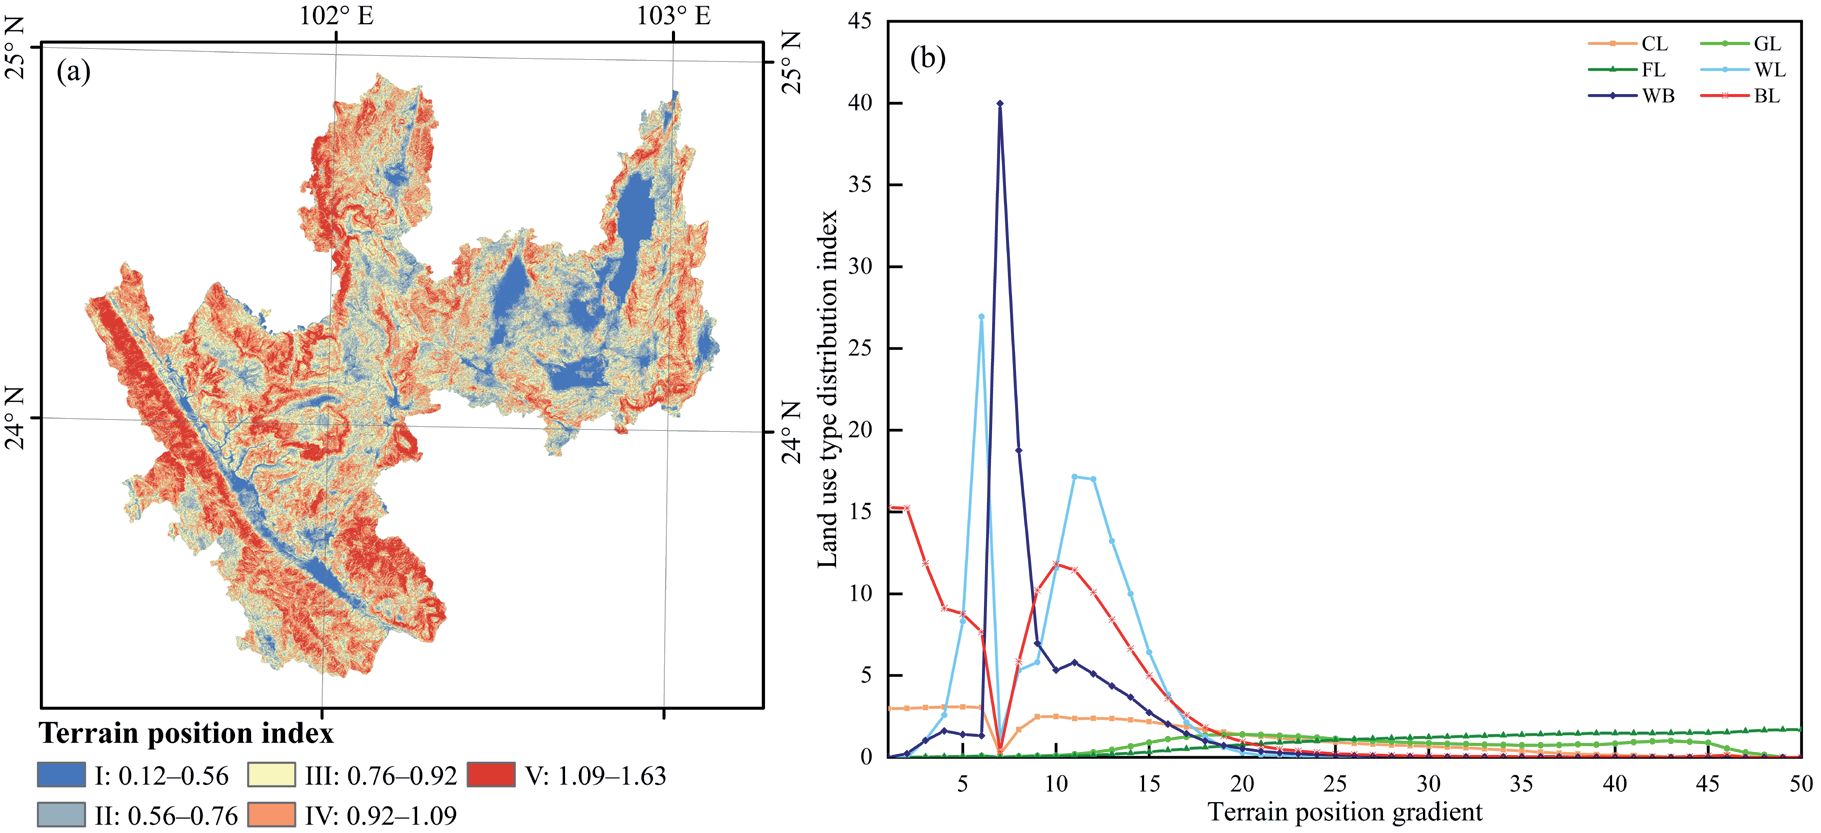
Based on DEM images, the data of the elevation, slope, and topographic relief parameters of Yuxi were extracted by referring to the relevant literature [29, 34]; the topographic potential index was calculated via a raster computer; and the natural breakpoint method was used to divide it into five levels(Fig. 6a). Finally, the gradient classification method was used to further analyze the topographic gradient characteristics. The topographic position index can comprehensively represent the complex topographic and geomorphic features. The gradient area of the topographic positions II, III, and IV accounted for 78.77%, which indicated that Yuxi has a high degree of topographic complexity. Most of the areas were of medium–high terrain, and were mainly distributed in the Ailao Mountain area from northwest to southwest and in the north. The low topographic positions were mainly distributed in the eastern regions with low slope and relief, including Hongta District, the three lake plains, and the eastern part of Huaning County, which were followed by the Yuanjiang River Valley area.
Based on the mean area of the LULC areas on different gradients in three years, the distribution index of the land-use types at their topographic positions was calculated, as shown in Fig. 6b. The topographic position index T (0-1.6212) was divided into 50 levels, and, according to the distribution advantages of each land-use type, it was divided into three sections: low (1-15), medium (15-25), and high (25-50). The high section was the dominant terrain areas of the forest lands; the medium section was the dominant terrain areas of the cultivated lands, grasslands, water areas and built-up lands; and the low section was the dominant terrain areas of cultivated lands, wetlands, water areas, and built-up lands. The low-terrain sections with small slopes and relief degrees are suitable for agricultural development and construction, while the high-terrain sections with high elevation, large slopes and large relief degrees are mainly suitable for mostly forest lands.
Topographic Gradient Distribution of the ESV
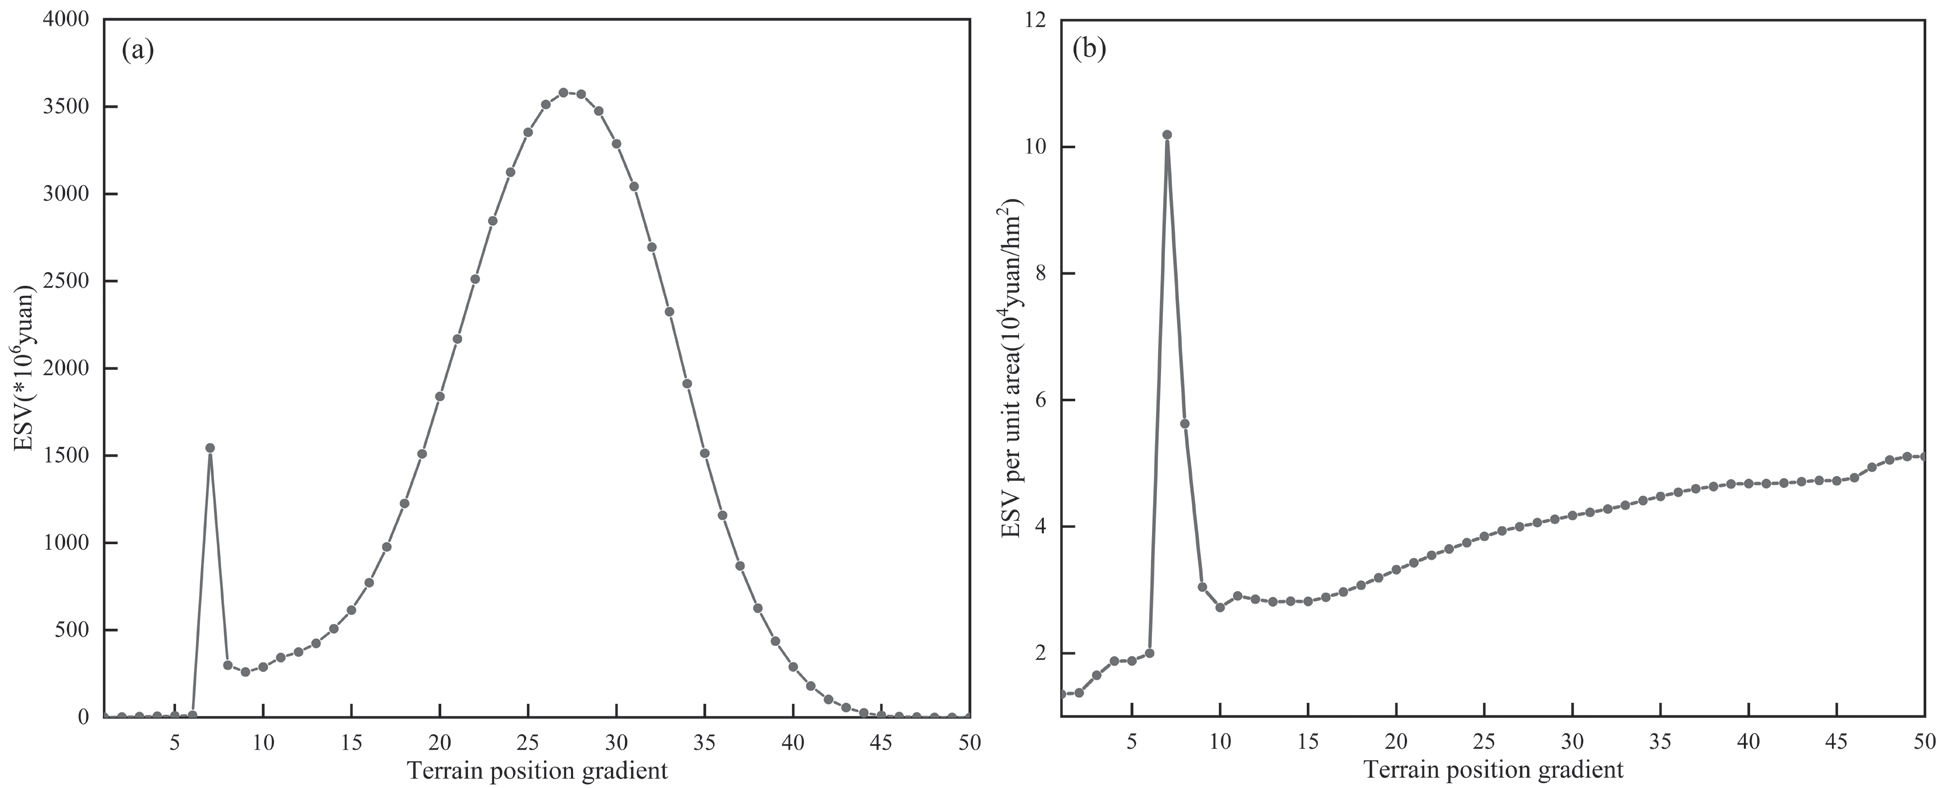
The ESV of Yuxi fluctuated in different topographic gradients, mainly increasing first and then decreasing (Fig. 7a). The ESV increased in an S-shaped curve before the 27th topographic position and reached the first mini-peak (1543.78⋅106 CNY) at the 7th topographic position. This then decreased and increased again, reaching a maximum peak (3580.48⋅106 CNY) at position 27. Then, it continued to decline, and the ESV was at its lowest at position 50 (0.05⋅106 CNY). These trends indicated that the overall ESV varied greatly at different topographic positions. To better display the distribution characteristics of the ESVs at different topographic gradients and to also eliminate the area interference, the impact of the topographic gradients was explored by using the ESV per unit area. As can be seen from Fig. 7b), with the increase in the terrain position index, the ESV per unit area showed a continuous upward trend on the whole (except for the 7th topographic position). It reached its maximum peak (10.19⋅104 CNY/hm2) at the 7th topographic position, and the second peak (5.62⋅104 CNY/hm2) was reached at the 8th position. The fluctuation trend of the ESV per unit area and the total ESV showed a certain negative correlation, indicating that the area of the LULC types with respect to their topographic gradients had a significant impact on the ESV. In the low-terrain position areas, the ESV per unit area fluctuated greatly due to the large distribution of the built-up lands, as well as due to high-population density and frequent human activities. In the middle- and high-terrain position zones, with increases in the relief, the area of human activities and construction gradually decreased; as such, the ESV per unit area gradually increased.
Fig. 7.
Topographic gradient distribution of the ESV. (a) Average ESV of 2000-2020; (b) ESV per unit area.
Correlation Analysis between Individual ESVs and Topographic Position Levels
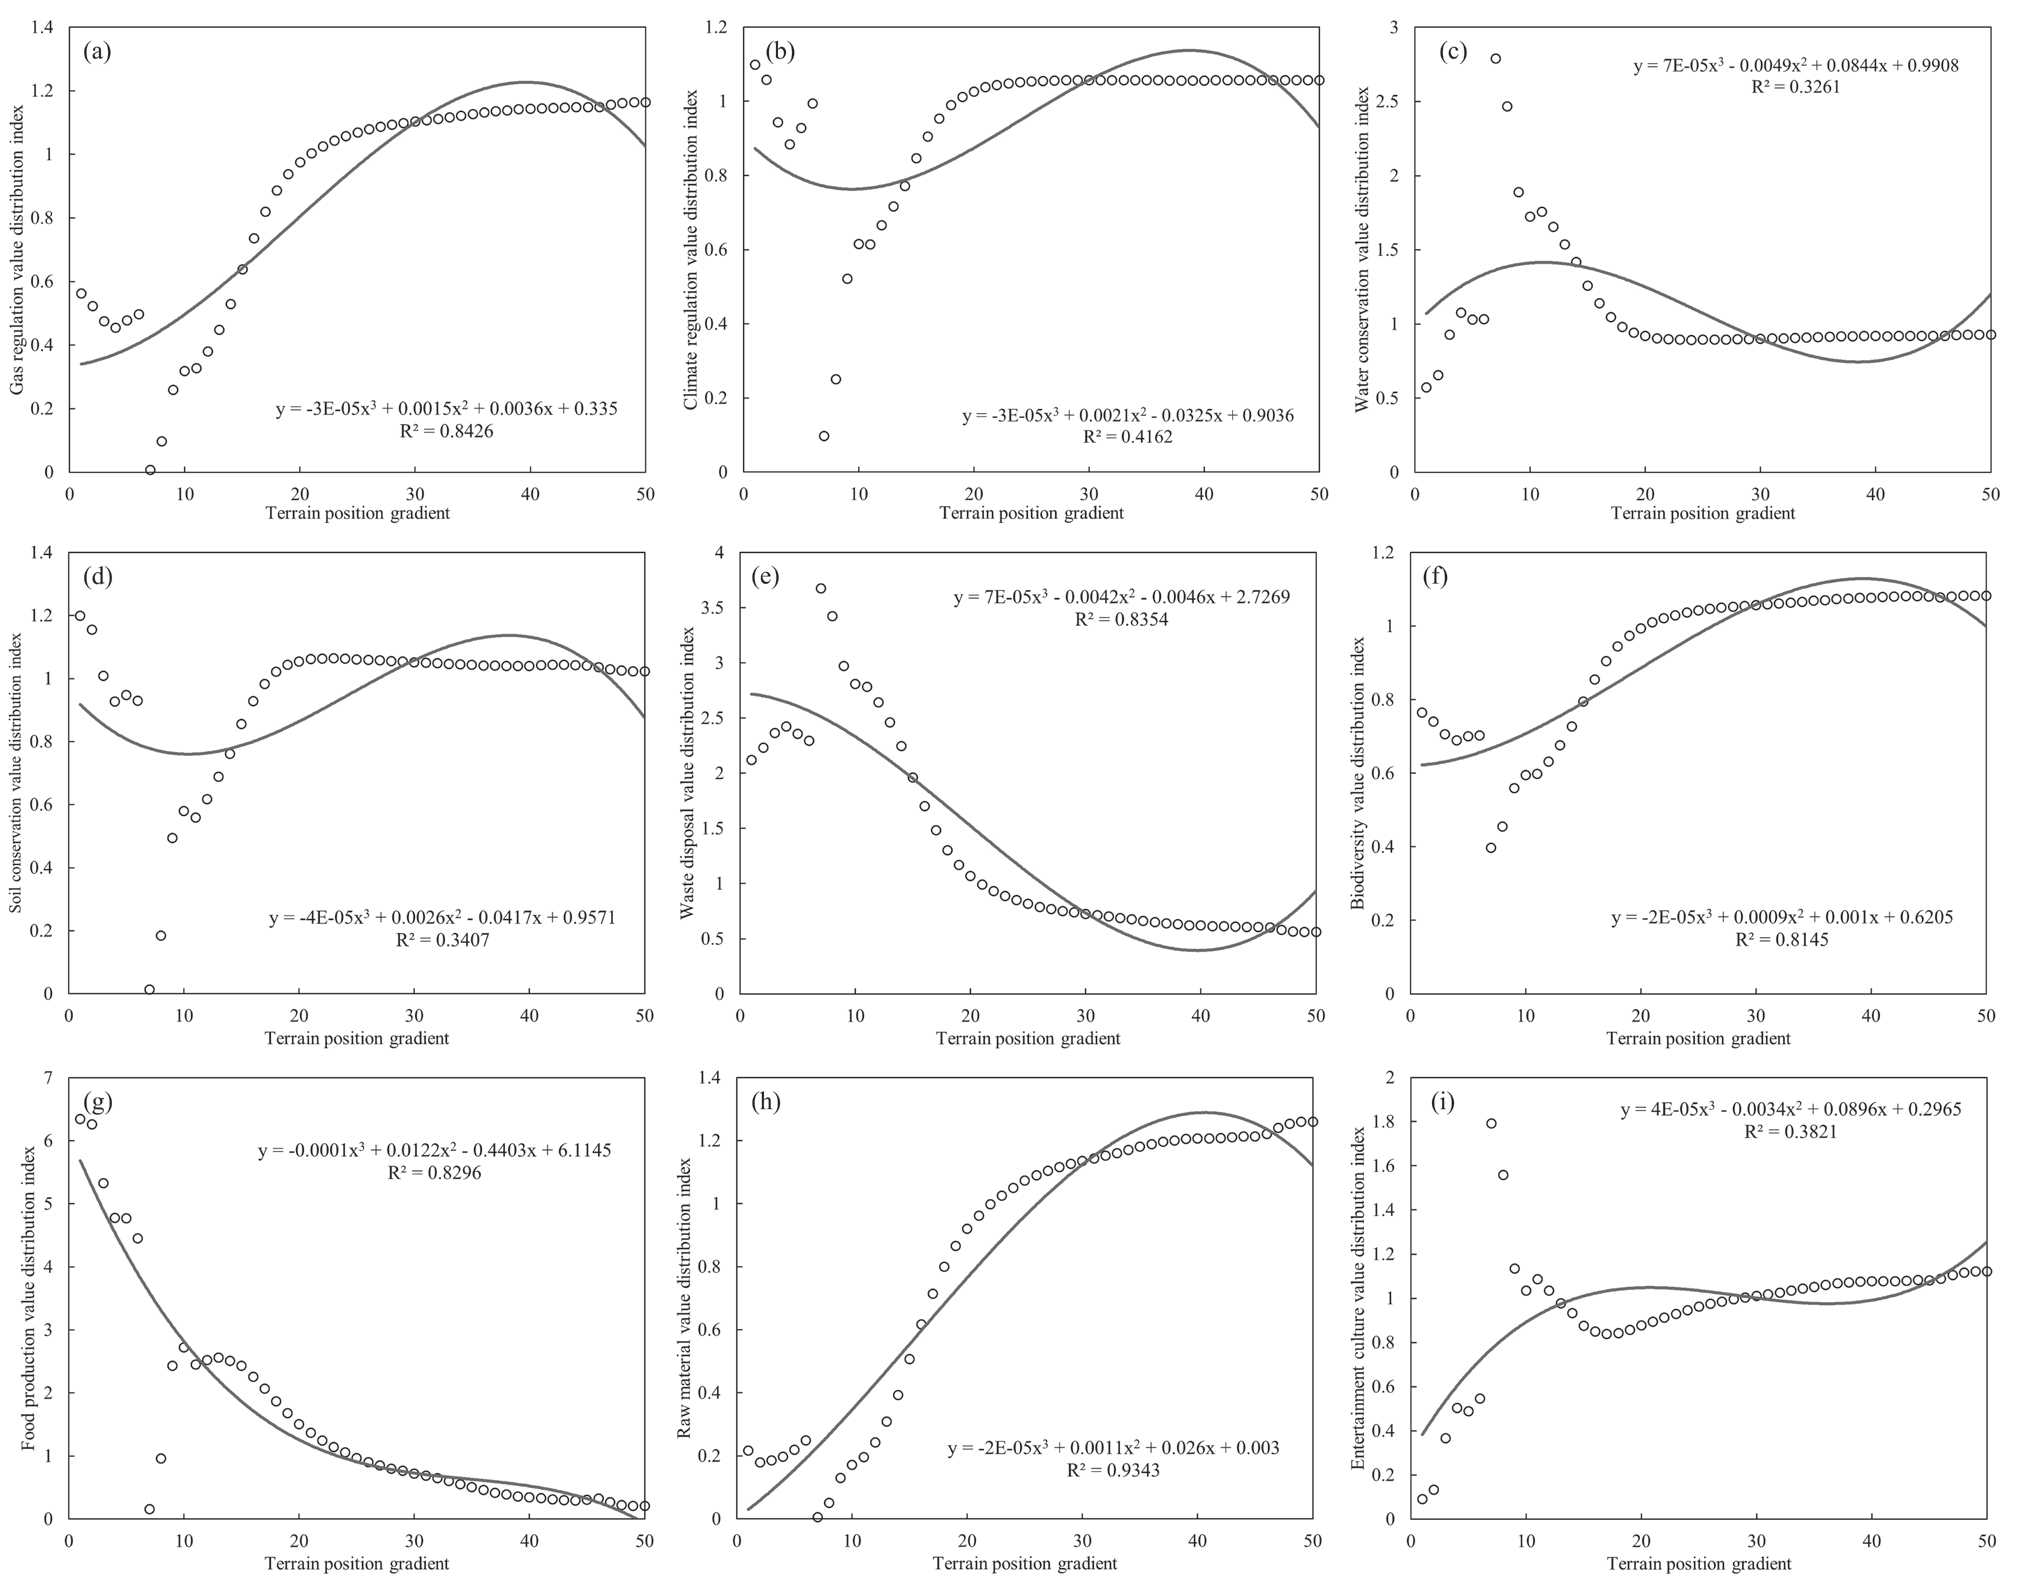
To explore the extent to which the ESV is affected by the terrain, the average ESV of three years at each topographic gradient was classified and summarized, and the distribution index of the individual ESV was also calculated. Then, Origin 2021 software was used to conduct regression analysis on the value distribution index of each ecosystem service and topographic position level, the results of which were shown in Fig. 8. With the increase in the topographic gradient, the individual ESV varied. There was an extremely significant fit between raw material value and topographic position (R2>0.9), and the raw material value increased with the increase in topographic position. The values of gas regulation, waste treatment, biodiversity, and food production were significantly fitted to topography position (R2>0.8). The values of waste treatment and food production decreased with the increase in topography gradient, while the values of gas regulation and biodiversity increased with the increase in topography gradient. The degree of fit between the values of climate regulation, water conservation, soil conservation, and entertainment culture with the topographic position gradient was not obvious (R2<0.5), indicating that the values of these five ecosystem services were less affected by topographic position limitations.
Table 4.
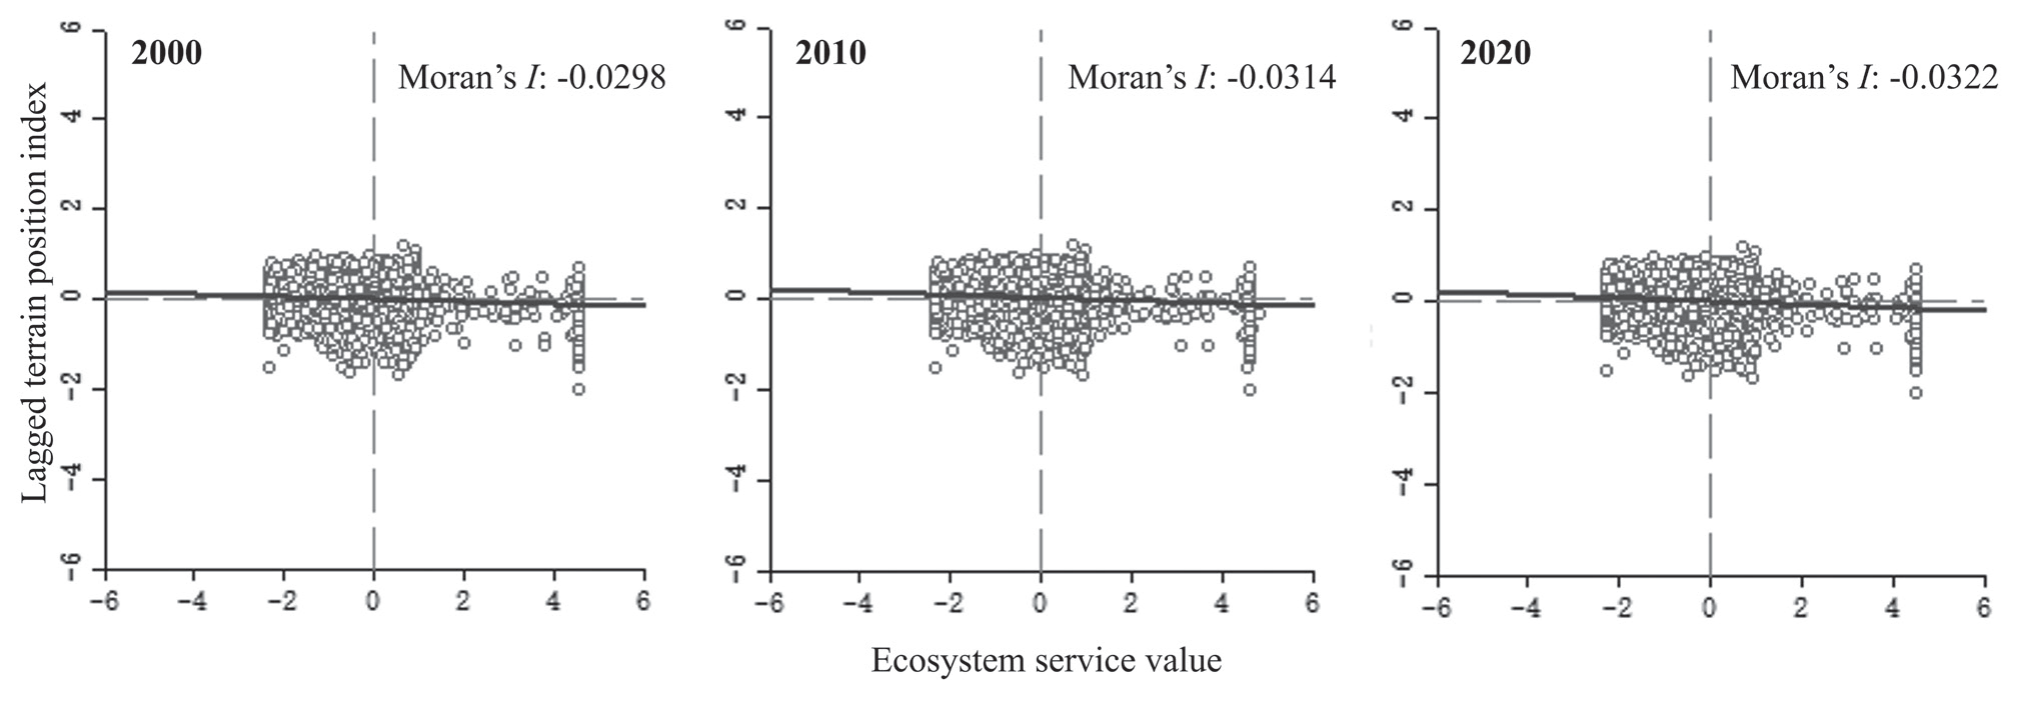
Moran’s I index and significance test results between the ESV and the topographic position index.
| Indicators | 2000 | 2010 | 2020 |
|---|---|---|---|
| I | -0.0298 | -0.0314 | -0.0322 |
| P | 0.001 | 0.001 | 0.001 |
| Z | -7.2132 | -7.6578 | -7.8456 |
[i] Note: I, Moran’s index (when Moran’s I is less than 0, it means that the data present spatial negative correlations, and the smaller the value, the greater the spatial difference); P, probability (P≤0.001 indicates an extremely significant statistical difference); Z, Z-Score (the P-value was statistically significant and the Z-score was negative, thus indicating a higher degree of a clustering of low values).
Spatial Correlation Analysis between the ESV and the Topographic Potential Index
ArcGIS10.6 software was used to calculate the average topographic position index within each grid, and a bivariate global spatial correlation analysis was carried out on the output results. In addition, the ESV was analyzed in GeoDa (a spatial analysis software) to obtain the bivariate Moran’s I index graph (Fig. 9). It can be seen that there was a significant negative correlation between the ESV and terrain position index in Yuxi City, and the spatial negative correlation between them tended to be enhanced. The significance test results of the data are shown in Table 4., and it can be seen that the spatial aggregation effect of the ESV and topographic position index also saw increases.
Discussion
Effects of the LULC Change on the ESV
LULC changes and changes in the ESV were caused by differences in both time and space. As can be seen from the chord diagram and the feature maps of land-use transfer in this study (Fig. 3.), the LULC changes in the study area mainly occurred in low-lying areas, especially in the area with a significant expansion of built-up land after 2010, which is consistent with the temporal and spatial change characteristics of land-use dynamics in previous studies [35, 36]. Unlike plain areas or delta areas with flat terrain(where natural environmental conditions have weak restrictions on the LULC areas) [37, 38], the distribution and change characteristics of the LULC areas in Yuxi are evidently restricted and influenced by the natural environment. Even after 2010, due to being driven by urbanization and government policies, construction lands rapidly expanded; however, it was still difficult to determine the dominant land type. Therefore, the main driving factors of land-use change in mountainous areas were found to be due to economic investment and the improvement of transportation conditions.
The spatial differentiation of LULC types brings a spatial differentiation in the ESV, and the mutual transfer of the LULC types clearly leads to an increase or decrease in the ESV [33, 39]. The results showed that the contribution of different land-use types to the ESV varied greatly. Yuxi City had a high forest coverage rate, and the contribution rate of the forest ecosystem to the ESV was the highest, reaching 77.81%. Although the change range of the ESV was small, as an important part of the ecological barrier in the southwest mountainous area, its decline trend cannot be ignored. Existing studies have shown that the LULC changes caused by climate change and human activities have a particularly significant impact on the ESV [40]. At the same time, differences in natural conditions including climate, hydrology, landform, as well as other factors and human activities such as population, industry, and policy often determine the development and change in the mountain ESV through the decision of land-use layout and the temporal-spatial change in the LULC areas [41]. Therefore, especially for small regions, identifying the response characteristics of the ESV to specific natural and human factors can help accurately implement ecosystem management and formulate differential regulation measures.
Yuxi City has a fragile ecological environment and is the ecological safety barrier in the southwest of China. The ESVs are high, and are mainly affected by natural geographical conditions [36]. However, in the short term, the increasing intensity of human activities and the rapid development of social economy are the main driving factors [41]. In the past 20 years, the overall trend of the ESV has been declining (Table 2.). Although the change rate of the ESV of the cultivated lands, forest lands and water areas were low, the decrease trend was evident. The main reason for these was that the area of forest lands and cultivated lands decreased significantly, and that the construction land increased significantly. Although the policy of returning farmlands to forest lands made the forest land areas account for more than 60% in 2000, due to the natural and geographical conditions, a large amount of construction lands can only come from the cultivated lands, grasslands and forest lands. At the same time, due to the low social and economic levels, the traditional way of production and life of mountain residents still requires the consumption of a large number of trees, as well as a reclamation of nearby cultivated land, thus resulting in the transfer of a large amount of woodland to cultivated lands and grasslands [42]. From 2000 to 2020, the transfer area of forest lands to cultivated lands, grasslands, and construction lands accounted for 41.40% of the total transfer area, and thus brought a decline in the ESV. However, with the implementation of the concept of “building a city by ecology” in recent years, the ecological protection and construction of lake wetlands have achieved evident results, and the decline trend of the ESV has been slowed down to a certain extent. The change in the ESV was consistent with the cyclical change in the ecological policies and economic activities, which further indicated that the LULC changes caused by the change in human activity intensity was the main driving factor in the short term.
Topographic Gradient Effects of the ESV
Topography is an important factor affecting landscape structures and spatial patterns [43]. There are significant vertical differences in the structures and patterns of the LULC areas on different topographic gradients, which further affect the change in the ESV. Previous studies have shown that topographic factors control soil surface properties by influencing groundwater dynamics, as well as by affecting soil erosion and organic carbon (SOC) storage [44], thus producing greatly different conditions for vegetation growth [45] and further affecting ESVs such as biodiversity [7]. In this study, the spatial distribution of the ESV was analyzed, and it was found that the ESV showed clear spatial differentiation. The massive higher-value aggregation area was formed in the three lakes; the high-value area and median-value area were formed in the central region and the Ailao Mountain area in the west; while the low-value area was mainly distributed in the urban center of Hongta District and the three lake plains. The distribution pattern of the ESV was generally high in the mountainous areas and low in the flat areas, which is consistent with the existing relevant studies [46, 47]. The main reasons include the restriction and limiting effect of natural environmental conditions, as well as the stress effect brought about by a high intensity of human activities [48].
In terms of natural environmental conditions, Yuxi City has broken terrain, as well as clear differences in terrain and topography. The region with a high topographic position index has high altitude, high slope, and high topographic relief. Many factors limit human production activities, developments, and construction [28]. These factors can also make higher topographic areas less disturbed and less destroyed by human beings, thus showing that the ESV of a region with a higher topographic position is significantly higher than that of a region with a low topographic position [6, 33]. On this basis, this paper comprehensively considered three topographic factors – namely elevation, slope, and topographic relief – which were calculated via the topographic position index, as well as analyzed through the changes in the land-use type distribution index and the ESV under different topographic position gradients. The results showed that the overall ESV varied greatly at different topographic positions, and the value of the individual ecosystem services also showed clear topographic gradient effects. With the increase in the topographic position level, the overall ecosystem service value increased first and then decreased. The value of the individual ecosystem services fluctuated at the low-terrain position level, but then increased with the increase in the topographic position level. This change trend was consistent with similar studies within the region and in similar areas [49, 50], thus indicating that the results of this study can objectively reflect the spatial differentiation characteristics of the ESV at different topographic gradients. At the same time and when compared with similar studies, since the topographic position index comprehensively considers three topographic factors, it may be more targeted to the special areas in the southwest mountainous area, and it can also provide certain reference ideas for the study of topographic gradient effects in similar areas.
In addition, the study found that different ecosystem services were affected differently by topographic gradients. For example, the value of raw materials was most obviously affected by topographic location, followed by gas regulation, waste disposal, biodiversity conservation and food production. The main reason was that with the increase of terrain position, the increase of forest area brought a significant increase in the value of raw material production, gas regulation and biodiversity maintenance, while the decrease of wetlands, water areas and cultivated lands brought a decline in the value of waste disposal and food production. The results showed that the value of ecosystem services determined by forest land was particularly affected by terrain gradients in mountainous areas [51, 52].
To summarize, the LULC areas and the ESV present clear differences in different topographic gradients. Due to gravity and other effects, the low flat depression areas were mainly distributed in water areas, cultivated lands and construction lands, while the large undulating areas were mainly distributed in grasslands and forest lands. Under the constraint of natural conditions and with the constant interference of human activities, different topographic regions showed evident spatial differences in the ESV, which could provide a factual basis for ecological environment construction and regulation in different regions. In low-terrain position areas, the unordered expansion of construction land should be strictly controlled to protect cultivated land, while in high-terrain position areas, human disturbance should be further reduced to realize a self-restoration of the ecosystem [53].
Limitations and Future Study
While some solid results were obtained in this study, we also recognize that there are still certain limitations to the study. Firstly, there are certain limitations in the calculation of the ESV in this study. Based on the ESV evaluation method developed and widely applied by Costanza [15] and Xie [32], the ecosystem service equivalent factors were modified according to the data of grain yield and price in Yuxi City. However, the heterogeneity and complexity of the ecosystems make it difficult to fully reflect the real ecosystem services. Secondly, the size of the scale has a great influence on the research results. Although the grid scale of 1.5 km ⋅ 1.5 km was selected from the three pre-selected scales through software calculation, its accuracy and suitability are still uncertain due to the large amount of calculation required and other such reasons. In addition, the topographic position index was used to explore the spatial heterogeneity of the ESV, but the weight of the various topographic factors in the influence was not clear, and the different weights of different factors were not considered in the calculation process of the topographic position index. Therefore, further discussion is needed in future research to provide a better practical policy basis for the ecological environment construction in the southwest mountainous areas.
Conclusions
Based on the land use map and DEM images of Yuxi City, the measurement method of the ESV, the topographic position index, the land-use type distribution index, the ESV distribution index, and the spatial autocorrelation analysis method were integrated to analyze the temporal-spatial changes in the LULC areas and the ESV at a grid scale. The results showed that the ESV presented clear differences at different times and spaces. In terms of time, the ESV showed a gradually decreasing trend. In spatial distribution, it showed a significant difference of high in the west and low in the east, which was strongly related to topographic characteristics. The LULC areas had a significant topographic gradient response and presented a three-stage distribution. With the increase in the topographic gradient, the dominant areas of water, cultivated lands, and construction lands gradually changed to forest lands as the dominant type of area. The overall ESV and ESV per unit area were clearly affected by the topographic gradient and showed evident fluctuations. At the same time, the fluctuation trend of both showed a certain negative correlation, indicating that both area and terrain factors have a great impact on the ESV. There were clear differences in the value of each individual ecosystem service, and the dominance of the distribution index was significantly different due to the topographic and area factors. According to the statistical analysis, the topographic gradient had an extremely significant influence on the value of raw materials (R2>0.9), and it also had a significant influence on gas regulation, waste treatment, biodiversity, and food production (R2>0.8). Our study shows that the total ESV, the ESV per unit area, and the individual ESV all had evident responses to the terrain gradient. In this study, the ESV of Yuxi City was estimated and analyzed in detail, and its response characteristics were found. Establishing this provides a good significant reference for regional ecological civilization construction and differentiation measures.

