

Introduction
Land is the foundation for human survival, and 42%-68% of the land surface has undergone land use activities over the past 300 years [1]. However, land is a limited resource. Due to population growth, economic development, bioenergy crop expansion and climate changes in recent years, enormous pressure has been brought to global land resources [1]. Therefore, research on land use and land use changes has become crucial in environmental science [2]. For instance, the Global Land Project added simulated monitoring of land use changes to its core content in 2005 [3]. The research on land use changes focuses on “key areas”, “hot areas” and “fragile areas” [4]. Many achievements have been achieved in land use change research in China. For example, Wang Peng investigated land use of the Lhasa River basin in recent 30 years [5]. Huang Yuqing et al. explored land-use changes in the Yellow River basin during 1995-2018 and their driving factors [6]. In recent years, many studies have also been conducted on land use changes in fragile karst areas. For instance, Wang et al. studied the impact of land use or landscape changes on ecosystem health in karst mountainous areas of southwestern China [7]. Xu Erqi et al. explored the vertical distribution characteristics of land use changes in karst mountainous areas [8]. Kuemmerle analyzed the diverse spatial patterns and heterogeneity of land use change in Europe [9]. Nevertheless, these studies mainly focus on land use changes in non-karst areas and affluent karst areas, while rarely in impoverished karst areas, which limits the management of land resources in impoverished karst areas.
The availability of land resources often determines the economic development and population of a region, which will also have feedback to land resources. Guizhou is a province with a wide distribution of karst geology, where land resources available for development and use are few, and the quality is not high [10]. Due to the intensification of urbanization and the reduction in cultivated land, the limited cultivated land resources have posed constraints to the economic development of Guizhou, which may be more evident in impoverished karst towns [11]. At present, research on land use changes in impoverished karst towns mainly focuses on land use optimization and service value [12, 13], but rarely on their land use changes. In addition, due to the different geographical conditions and development levels in different areas, their land use changes inevitably vary. Therefore, an in-depth exploration of land use changes in impoverished karst areas is of positive significance for promoting land resource management and utilization in these areas.
Economic development and population growth are considered as one of the main factors affecting land use in many studies [14, 15]. However, the relationships of these influencing factors with land use changes in specific impoverished karst areas may change, which is still uncertain. The research area selected for this study is Ceheng County, Guizhou, which is located in the karst area of southwest Guizhou, with severe human-land conflicts and relatively lagging socio-economic development [16]. Ceheng County is located in the rocky desertification area of the Yunnan-Guizhou-Guangxi region, and is one of the 14 concentrated and contiguous areas with special difficulties, with a poverty rate as high as 33.69%. It is also in the last batch of deeply impoverished counties free from poverty in China [16]. On this basis, the current status of land use changes in Ceheng County, Guizhou was analyzed, and the impacts of economic development and population changes on land use changes were deeply analyzed, so as to provide theoretical reference for the management of land resources and the direction of socio-economic development in this county.
Materials and Methods
Research Area
Ceheng County is located in the southwest of Guizhou province, China, with a total area of approximately 2,596.82 km2, governing 11 towns including downtown, Qiaoma, Pomei, Rongdu and Shuangjiang [16]. The county has sufficient sunlight, rich heat and abundant rainfall, with hot summer and cool winter, and rain and heat in the same season [17]. The highest altitude is 1,634 m, the average annual sunshine is 1,514 h, the average annual temperature is 19.2ºC, and the annual frost-free period is 305 d. With the three-dimensional climate characteristics dominated by South-Asian tropical monsoon climate, it is known as the “natural greenhouse”, and is suitable for the growth of various plants [18]. The exposed strata in the Ceheng area are only the Upper Permian, Lower-Middle Triassic and Quaternary. The Triassic has the largest distribution and is widely distributed throughout this area, accounting for over 98% of the total area, while the Permian and Quaternary have the smallest distribution, less than 2% [19]. The geostructure of the phosphate mining area in Ceheng County is located in the east-west tectonic deformation zone of the Youjiang basin in southwest Guizhou. The tectonic style is characterized by a tight anticline-syncline, with intervals of some dome-basin structures with relatively weak deformation [20].
Data Source
The land use data of 2010, 2013, 2016 and 2019 were from the Center of Resource, Environmental Science and Data, Chinese Academy of Sciences, with a resolution of 30 m. The current status of land use were obtained using ArcGis, and the land use area was calculated. The land-use patterns included cultivated land, construction land, grassland, forest land, garden land, and other lands. The economic and demographic data were sourced from the China Statistical Yearbook (Township).
Results
Spatiotemporal Trend of Land Use in Ceheng County
The current status of land use in Ceheng County 2010-2019 was shown in Fig. 1. The land use in Ceheng County was dominated by forest land, and Shuangjiang, Badu and Yangba towns had the highest proportions. Land use in the towns of Rongdu, Qiaoma and Yata towns was dominated by cultivated land. From 2010 to 2019, there was a significant decrease in cultivated land and grassland, especially in Qiaoma and Yata towns, and a significant increase in construction land and other lands. The decrease in cultivated land and grassland mainly occurred in 2016-2019, the increase in other lands in 2013-2019, and the increase in construction land in 2016-2019. Overall, no significant changes were found in garden land.
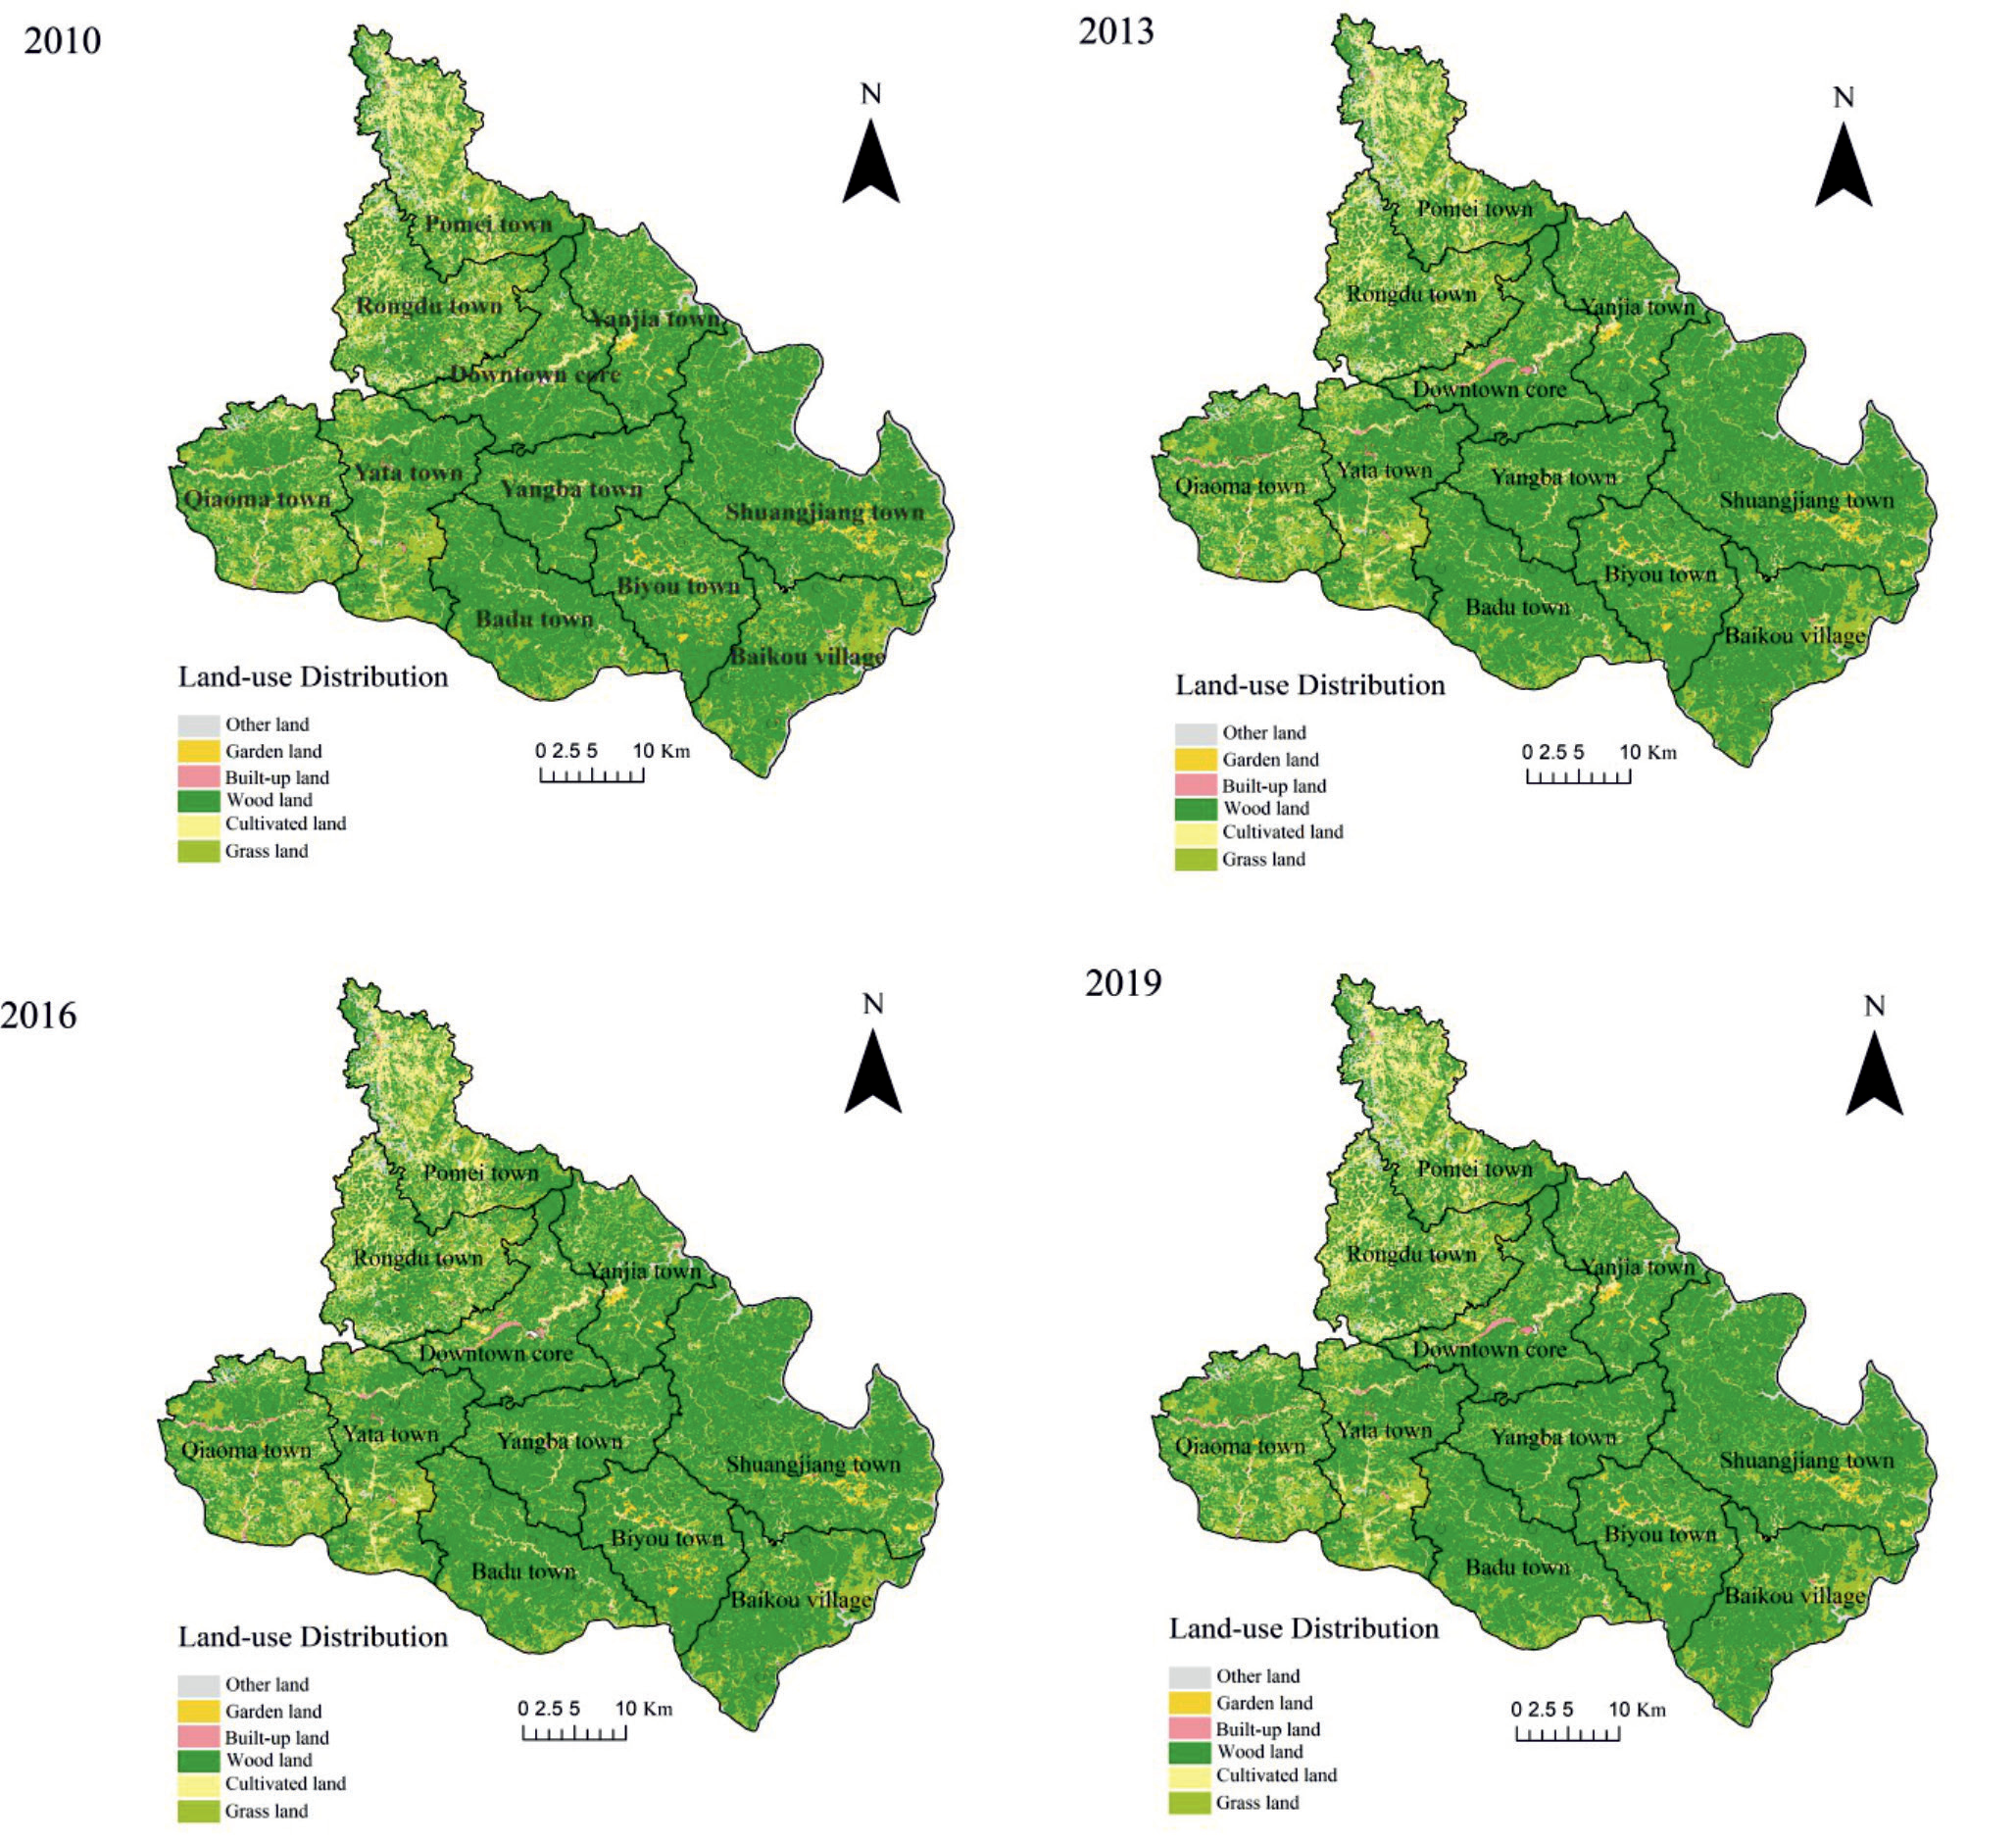
Table 1.
Area statistics of the main types of land use changes in Ceheng from 2010 to 2019.
Core Type and Directions of Land Use Changes in Ceheng
Cultivated Land is the Core Types of Land Use Changes in Ceheng
The land use changes in Ceheng County were mainly manifested as the changes in six patterns of land use (Table 1), namely the conversions from cultivated land to grassland, cultivated land to construction land, cultivated land to forest land, cultivated land to other lands, cultivated land to garden land, grassland to cultivated land, forest land to cultivated land, and other lands to cultivated land. It was clearly observed that all six types of land use changes mentioned above were correlated with cultivated land. Cultivated land conversion accounted for 66.05% of the total conversions, and other land conversion accounted for only 33.95%. Overall, cultivated land, grassland and other lands were converted by 4,815.59, 715.52, and 33.29 km2, respectively, while forest land was converted into 3,441.70 km2. Therefore, it is inferred that cultivated land is the core type of land use change in Ceheng, followed by forest land.
Directions of Land Use Changes in Ceheng
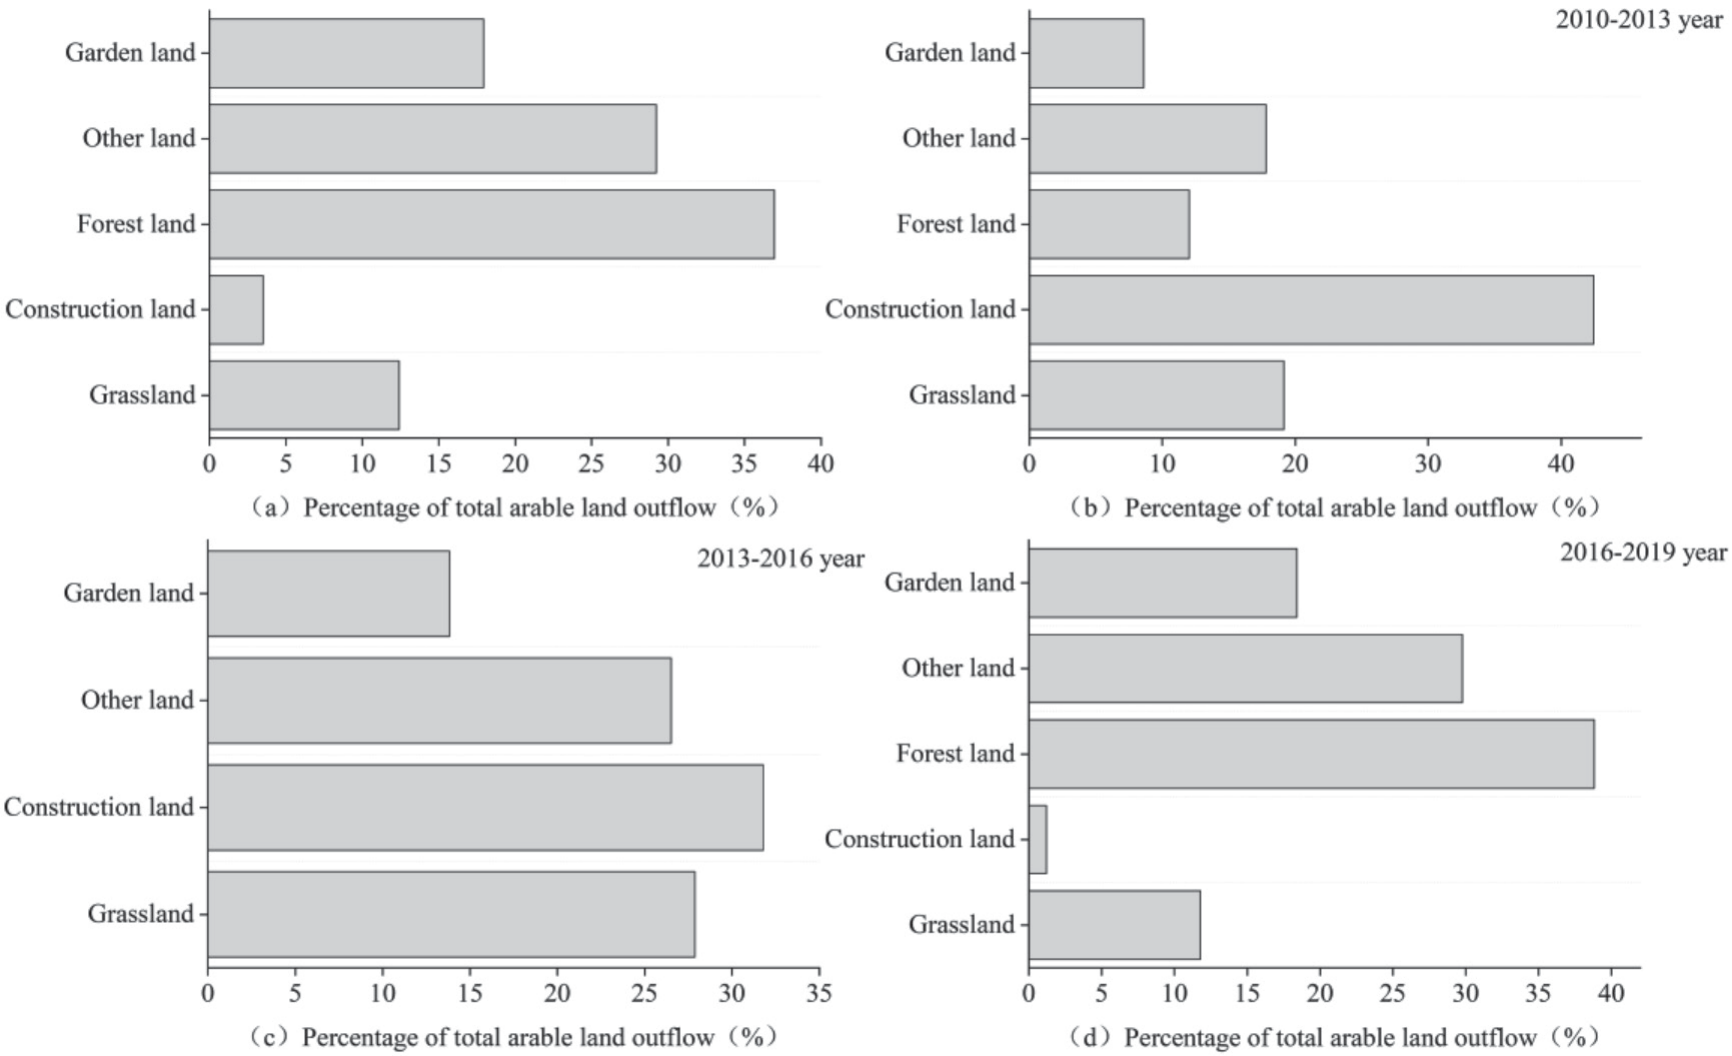
Fig. 2a) presented that in 2010-2019, cultivated land was mainly converted into forest land, accounting for 36.96% of the total outflow. Overall, the proportions of various land use changes to the total outflow of cultivated land were forest land>other lands>garden land>grassland>construction land. Further analysis revealed that the proportion of construction land to the total outflow of cultivated land was the highest in 2010-2013 and 2013-2016, 42.46% and 31.78%, respectively, with the highest proportion in 2010- 2013. The proportion of construction land from 2016 to 2019 was the lowest, only 1.21%. The proportion of forest land in the total outflow of cultivated land was the highest in 2016-2019 (38.83%), and no cultivated land was converted into forest land in 2013-2016. In 2010-2013, 2013-2016 and 2016-2019, garden land, other lands and grassland all accounted for a certain proportion of the outflow of cultivated land. The proportions of garden land and other lands were 2016- 2019>2013-2016>2010-2013, while the proportion of grassland was 2013-2016>2010-2013>2016-2019.
Spatiotemporal Differences in Land Use Changes in Ceheng
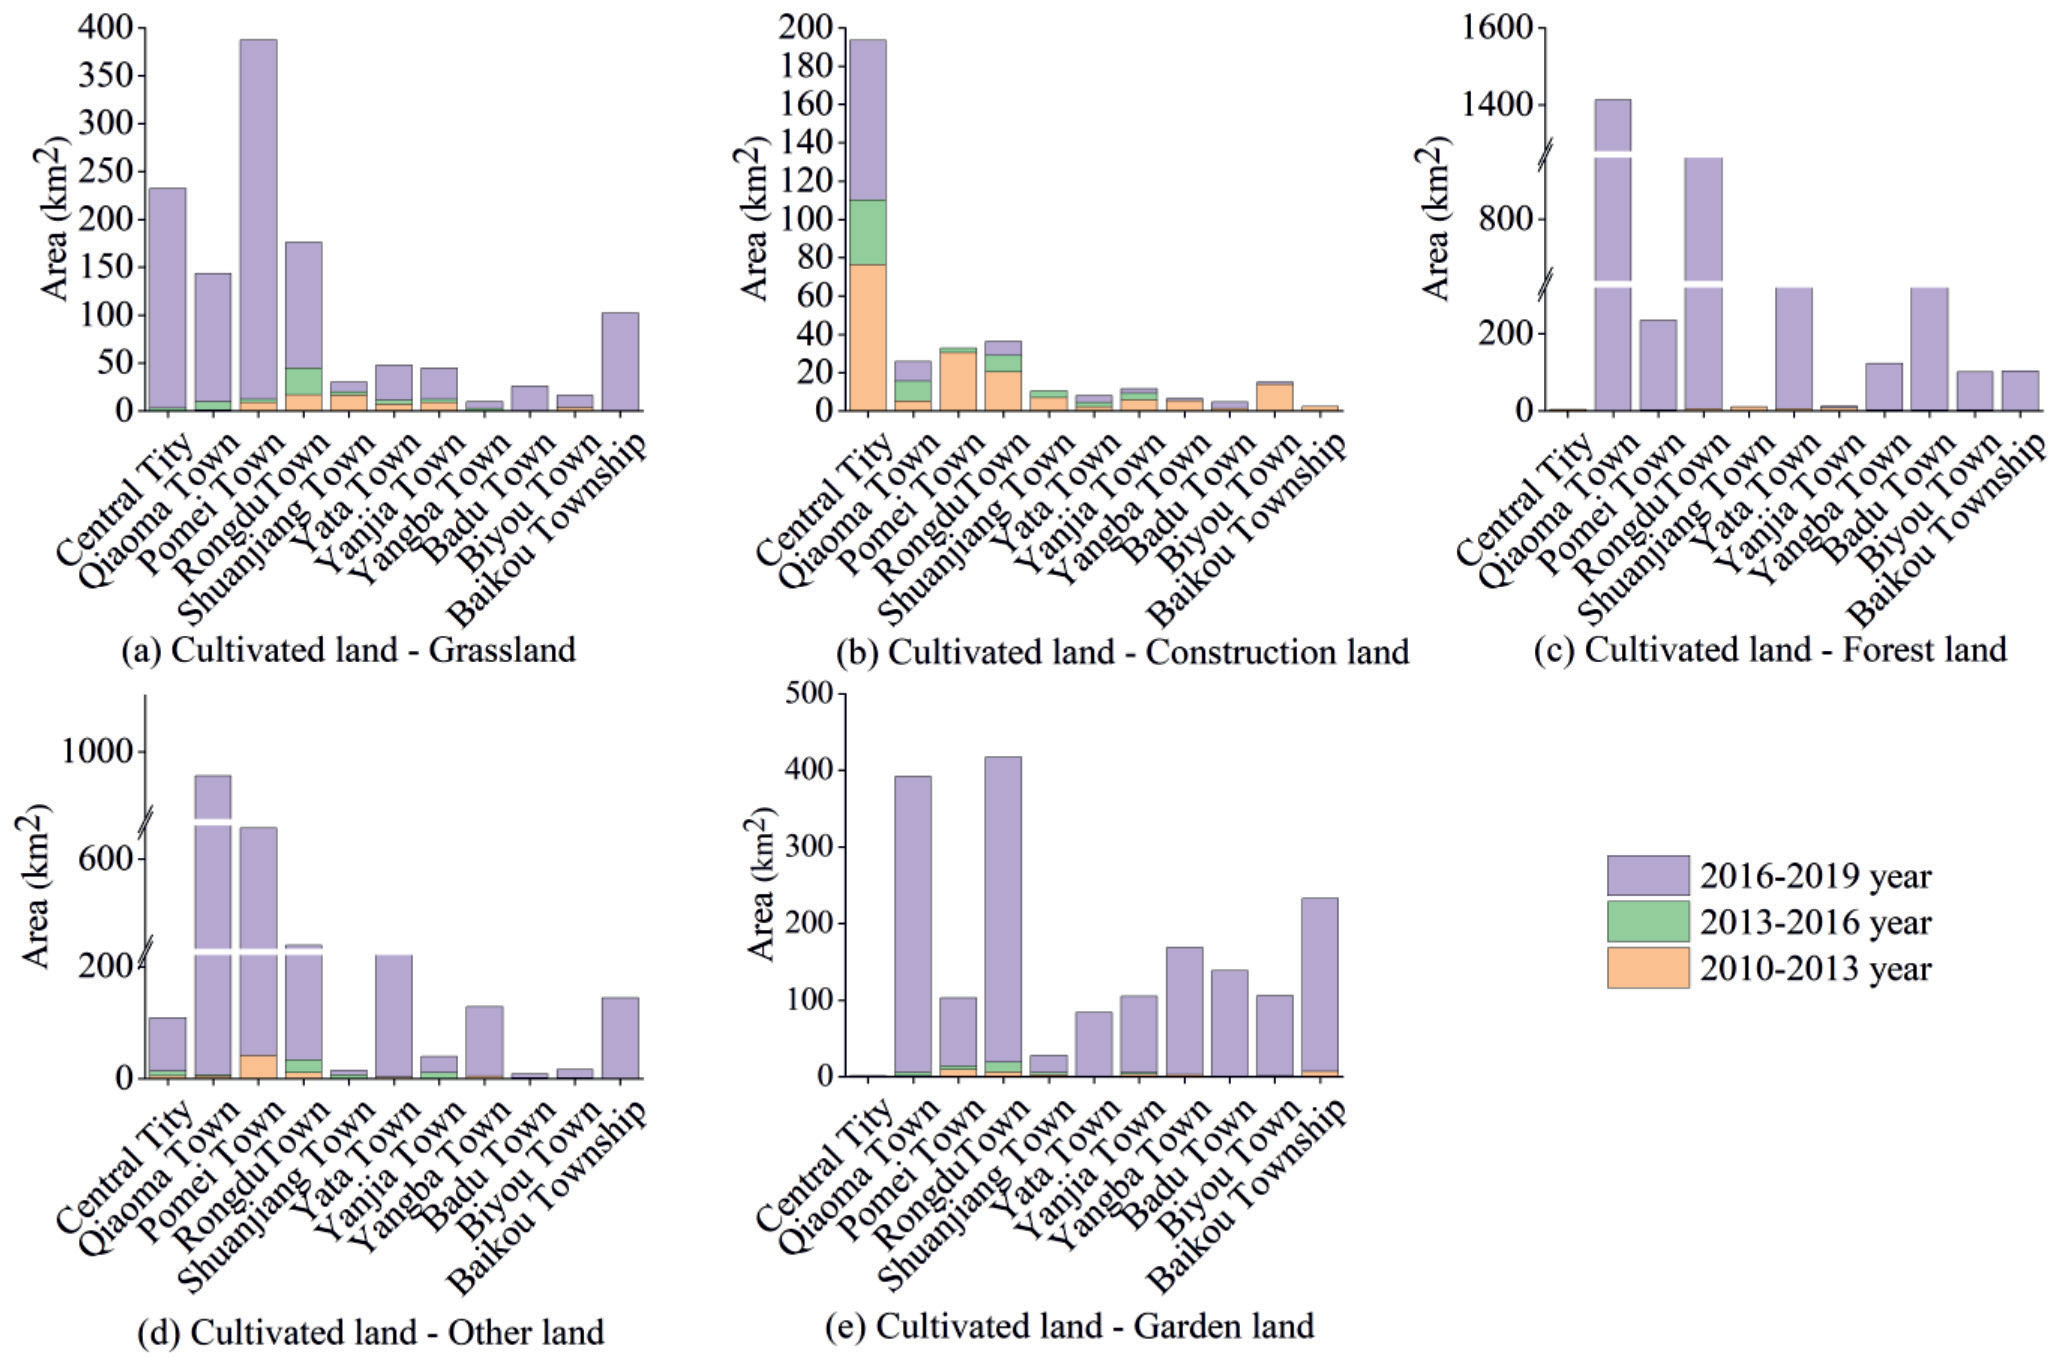
The trends of land use changes in Ceheng County were shown in Tables 2-3 and Fig. 3. The overall trends of land use changes in different towns of Ceheng from 2010 to 2019 were displayed in Table 2. The largest areas of cultivated land conversion to grassland, construction land, forest land, other lands and garden land were located in Pomei, downtown, Qiaoma and Rongdu, respectively. Qiaoma town had the area with the highest proportions of forest land and other lands converted from cultivated land. The highest conversion rates of grassland, forest land and other lands into cultivated land were in Yata, Rongdu and Baikou towns, respectively. From the three different periods of 2010- 2013, 2013-2016 and 2016-2019 (Fig. 3), the conversion of cultivated land to grassland, forest land, other lands and garden land in 11 towns including downtown, Qiaoma and Pomei town occurred mainly in 2016- 2019. Differently, the conversion of cultivated land to construction land occurred mainly in Qiaoma town in 2013-2016, downtown, Yata town and Badu town in 2016-2019, and Pomei town, Rongdu town, Shuangjiang town, Yanjia town, Yangba town, Biyou town and Baikou town in 2010-2013.
The conversions of grassland, forest land and other lands to cultivated land during 2010-2013, 2013-2016 and 2016-2019 were seen in Table 3. The conversion of grassland to cultivated land in Yata Town mainly occurred from 2013 to 2016, in downtown, Qiaoma, Yanjia and Yangba Town from 2016 to 2019, and in Pomei, Rongdu, Shuangjiang, Badu, Biyou and Baikou town from 2010 to 2013. The conversion of forest land to cultivated land in Rongdu and Yata towns occurred during 2013-2016, in Qiaoma, Biyou and Shuangjiang towns during 2010-2013, and in Pomei, Yanjia, Yangba, Badu and Baikou towns during 2016-2019. In downtown, there was no situation where forest land was converted into cultivated land. The conversion of other lands to cultivated land in most towns occurred mainly in 2010- 2013, but only in 2016-2019 in Shuangjiang and Yangba towns and 2013-2016 in downtown.
Correlations between Regional Development and Land Use Change
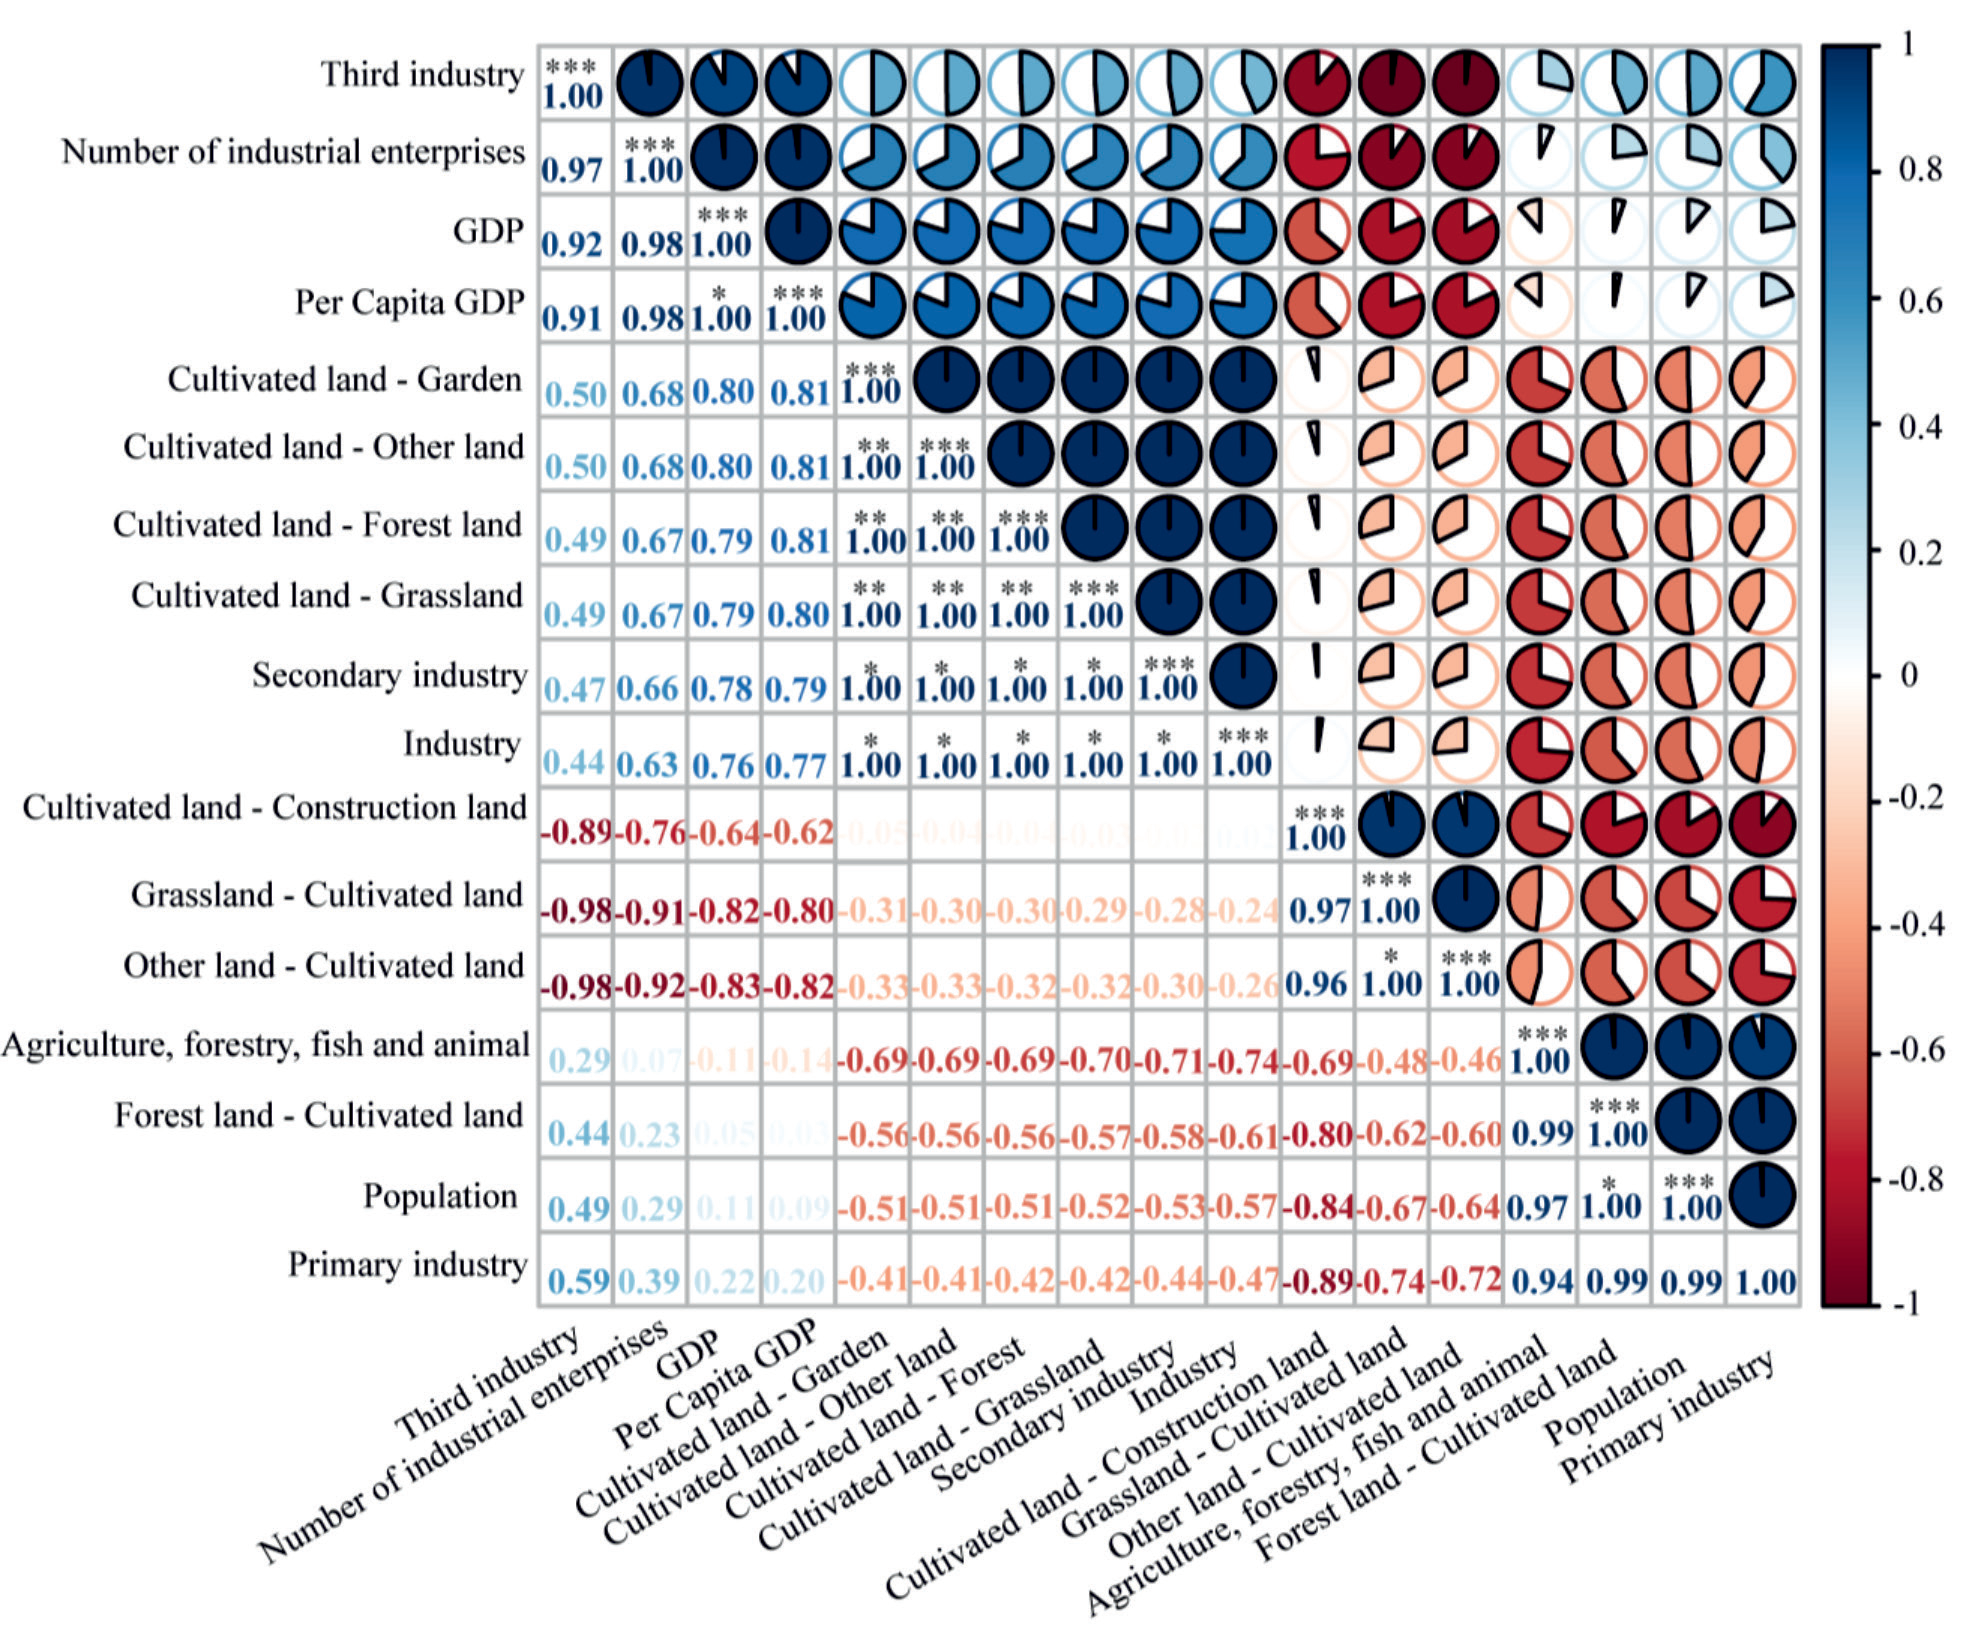
This study further investigated the changes in the population and different industries of Ceheng from 2010 to 2019, and calculated them as variables (Table 4), revealing that except for negative growth in population and industrial enterprises, all other economic indicators showed positive growth. In economic indicators, regional gross domestic product (GDP), the added value of the tertiary industry, and per-capita GDP all showed linear growth, namely 2016-2019>2013-2016> 2010-2013. In addition, the added value of the primary industry, the added value of the secondary industry, the added value of the industry, and the total output value of agriculture, forestry, animal husbandry, and fishery presented nonlinear growth. The added value of the primary industry was 2013-2016>2016-2019>2010-2013, the added values of the secondary industry and industry were 2016-2019>2010-2013>2013-2016, and the total output value of agriculture, forestry, animal husbandry, and fishery were 2013-2016>2010-2013>2016-2019. Fig. 4 exhibited the correlations between land use changes and economic and demographic changes. The results demonstrated that except for the conversion of cultivated land to construction land, the conversions of cultivated land to grassland, forest land, other lands and garden land all had significant positive correlations with the secondary industry and industry. Among the conversions of grassland, forest land and other lands to cultivated land, only the conversion of grassland to cultivated land showed a significant positive correlation with population. No significant correlations were found in other situations.
Table 2.
General differences in land use changes in different townships in Ceheng, 2010-2019.
Table 3.
Differences in the inflow of arable land in different communes in the three time periods of 2010-2019 year.
Discussion
From 2010 to 2019, the land use pattern in Ceheng County was mainly forest land, which is highly consistent with previous studies [21, 22]. The ecological environment in karst areas is fragile, with severe soil desertification and erosion. The land use mainly based on forest land is conducive to ecosystem stability [7, 23]. It has been shown that natural ecosystems dominated by forest land have high ecological vitality and resilience, and areas with high ecosystem health levels are distributed in forest land and ecological restoration areas [7], indicating that the “ecological cropland-conversion” policy implemented by the government after the 1990s has achieved significant results in large-scale returning farmland to forests, afforestation, and closing hillsides to facilitate afforestation [24]. Through further analysis, this study found that cultivated land was the core pattern of land use in Ceheng County, mainly with a decreasing trend of cultivated land over the years. In the early years, due to population growth and economic development, local residents destroyed forests and reclaimed land to increase the area of cultivated land. As the pressure on residential areas increased, most cultivated land has been converted into construction land. When the harm caused by ecological environment destruction is recognized, returning farmland to forests and grasslands has become mainstream. For decades, people’s lives have mainly been around cultivated land, which is related not only to that China is a major agricultural country, but also to that Ceheng County is an agricultural county with “forestry, livestock, vegetables, aquatic products, and sucrose” as its characteristic industries [25]. Therefore, research on land use in Ceheng County should focus on the changes in cultivated land in that cultivated land cannot be reduced without restrictions, and it is necessary to maintain the protection and construction of basic farmland [26].
It has long been a consensus that population changes and economic development are likely to cause changes in land use [27]. The correlation analysis in our study showed that the conversions of cultivated land to grassland, forest land, other lands and garden land were significantly positively correlated with the secondary industry and industry, and the conversion of forest land to cultivated land was significantly positively correlated with population, further demonstrating that population changes and economic development do indeed affect regional land use patterns and may even play a major role [28-30]. Of course, population changes and economic development are not the only driving factors for land use changes. It has been shown that natural conditions and national policies are also important factors driving land-use changes [23]. For instance, a study has demonstrated that land-use changes are influenced by terrain [31]. The impact of national policies on land use can be summarized in the following two aspects: one is population policies or regional poverty alleviation policies. The study of Feng Qing et al. has shown that in the practical process of poverty alleviation, a large number of people are relocated from Ceheng County to alleviate poverty, thus reducing the pressure on land resources, which is of positive significance for the ecological restoration and maintenance of geologically fragile karst areas [16]; and the other is land management policies. For example, the policy issued by the provincial government states that Ceheng County must strengthen the construction and protection of basic farmland, and prohibit non-agricultural construction from occupying farmland [26]. Therefore, in the current and future development, it is necessary to integrate the impacts of a series of factors such as natural conditions, population changes, economic development, and national policies on land use, so as to better maintain the ecological security of geologically fragile karst areas.
Table 4.
The amount of multi-year economic and population changes in Ceheng County.
Conclusions
The land use in Ceheng County was dominated by forest land, followed by cultivated land. From 2010 to 2019, cultivated land and grassland reduced, and construction land and forest land increased, but the changes in garden land were not significant. The core type of land use change in Ceheng County is cultivated land, which accounts for 66.05% of the total outflow. Overall, forest land accounts for the highest proportion of total outflow of cultivated land (36.96%). The proportion of construction land to the total outflow of cultivated land were the highest in 2010- 2013 and 2013-2016, 42.46% and 31.78%, respectively. The proportion of forest land in the total outflow of cultivated land is the highest in 2016-2019 (38.83%). Land use changes were most pronounced in Pomei, downtown, Qiaoma, Rongdu, Yata, and Baikou towns. It should be noted that the urban area did not experience any conversion of forest land to cropland. The county’s economy grew positively, but population and industrial enterprises declined. Key economic indicators showed linear growth, while primary and secondary industries had nonlinear growth. Correlation analysis highlighted positive links between specific land use changes (e.g., cultivated to grassland, forest land) and secondary industry and industry (P<0.05). The change from grassland to cultivated land correlated positively with population (P<0.05). Population, secondary industry, and industry were key factors impacting land use.

