

Introduction
Sustainable development is one of the major objectives of economies, and countries around the world are extensively undertaking effective initiatives to achieve the predetermined 17 sustainable development goals (SDGs) by 2030 [1, 2]. According to a report by the International Energy Agency (IEA), energy is one of the major sources of CO2 emissions, reaching a record high of 33.1 Gt in 2019. This highlights the fact that this transition in energy consumption around the world adds to the mounting threat posed by climate change. However, there is a growing understanding that sustainable economic growth with low-carbon emissions may have beneficial impacts on society, the environment, and the economy [3, 4]. Therefore, to achieve sustainable economic development, it is important to highlight the green growth and energy transition of all economic stakeholders, including individuals, firms, and the government [5].
Energy transition (ET) is a continuous process that critically contributes to economic development and the welfare of society. It has also been extensively linked to sustainable development [6]. Therefore, energy transitions have attracted the attention of researchers worldwide. ET is an ongoing process of switching from traditional to modern and renewable energy sources [7]. ET is not a simple and leading method for modeling energy. To achieve this, it is necessary to understand the framework that highlights how policies, energy infrastructure expansion, human behavior in the energy market, environmental implications of energy sources, and secure supply of energy are interdependent while seeking new technologies [8]. Moreover, there are many challenges faced worldwide, including high energy demand, climate change, and depletion of natural resources. Thus, it is important to find alternative, environmentally friendly, and cost-effective energy sources [9]. Sustainable ET is not just switching from traditional energy sources to new and highly efficient energy sources; it is also a big challenge to ensure that the societal and environmental costs, benefits, and risks associated with the shift are well managed in a way that can be considered sustainable [6]. However, the adoption of advanced technologies and business models may facilitate the achievement of energy efficiency, cost-effectiveness of energy sources, improvement of energy storage, and efficient distribution networks [10]. This not only lowers CO2 emissions, but an effective business model with an efficient framework also opens up new economic prospects, promotes energy independence, generates new business opportunities, and increases employment in the rapidly expanding sustainable energy industry [11]. Green energy development leads to a sustainable future by altering the generation and consumed [3]. Therefore, collective efforts by individuals, firms, and governments are necessary to promote sustainable energy transition and lower the impact of climate change by investing in green energy innovations [12].
Natural resources (NAR) are important elements for achieving sustainable development [13] and promoting ET. For example, the availability of natural resources such as wind, water, biomass, and solar energy greatly affects the shift to clean and modern energy sources [14]. NAR provides sustainable and environmentally friendly sources of renewable energy (RE), which lowers dependency on non-renewable energy (NRE) sources and assists in countering the impacts of climate change [15, 16]. This will further improve human welfare and contribute to the preservation of stable ecosystems for future generations. Moreover, the NAR also sources raw materials for manufacturing RE technologies, such as solar panels, storage batteries, and wind turbines [17]. For example, glass, silicon, and aluminum are necessary for manufacturing solar panels, and steel and scarce earth metals are used in the manufacturing of wind turbines. Thus, NAR exploitation may have severe negative impacts on the environment and society [18]. Moreover, the storage batteries used for RE may generate considerable waste and environmental pollution [19]. Therefore, it is important to preserve these NAR by efficiently using them with the lowest possible waste during consumption. Similarly, these scarce NAR are unevenly distributed across the world, which leads to geopolitical implications such as disputes among nations regarding the accessibility, control, and distribution of NAR [20]. This may require sustainable NAR management, efficiency, and the development of more sustainable production methods.
Another important factor significantly influences the energy structure. It includes environmental policies (EVPs) that affect green economic growth and pave the way for sustainable ET [21]. Countries’ major socioeconomic and environmental issues can be addressed through effective EVP [22]. At the same time, these EVPs may have both favorable and adverse impacts on nations’ economic growth and social development. For example, effective EVPs can generate economic and employment opportunities in the green energy sector. For instance, policies such as tax incentives may encourage the adoption of clean energy, which fosters innovation in the energy sector and promotes sustainable energy [23]. Additionally, EVPs contribute to social development by lowering the impact of water and air pollution on human health [24]. Considering the negative impact of EVPs, it may be observed that these policies significantly affect industries that depend highly on fossil fuels [25]. These policies can significantly affect employment in areas where these industries operate and absorb the local labor force [26]. However, EVPs may cause social inequality because the transition cost may be overborne by low-income groups [27]. Thus, it is very important to develop EVPs that enhance economic growth and generate social equity without compromising environmental sustainability.
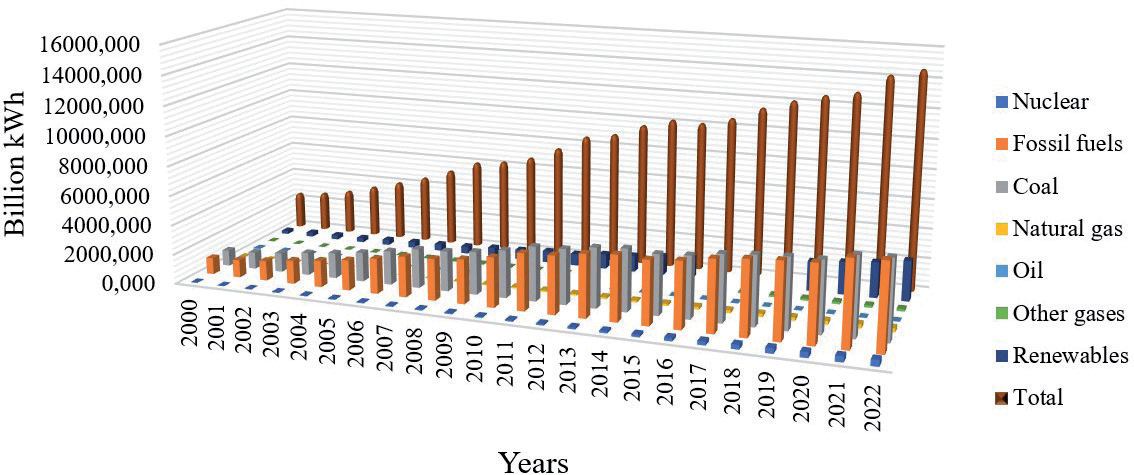
Since the reforms and opening up, China has experienced rapid economic growth and industrialization, which has increased energy demand. Fig. 1 shows the energy generated from different energy sources. As shown in Fig. 1, fossil fuels constitute a major share of energy sources among all other energy sources. The use of renewable energy has been increasing; however, its position has not yet been marked among all energy sources.
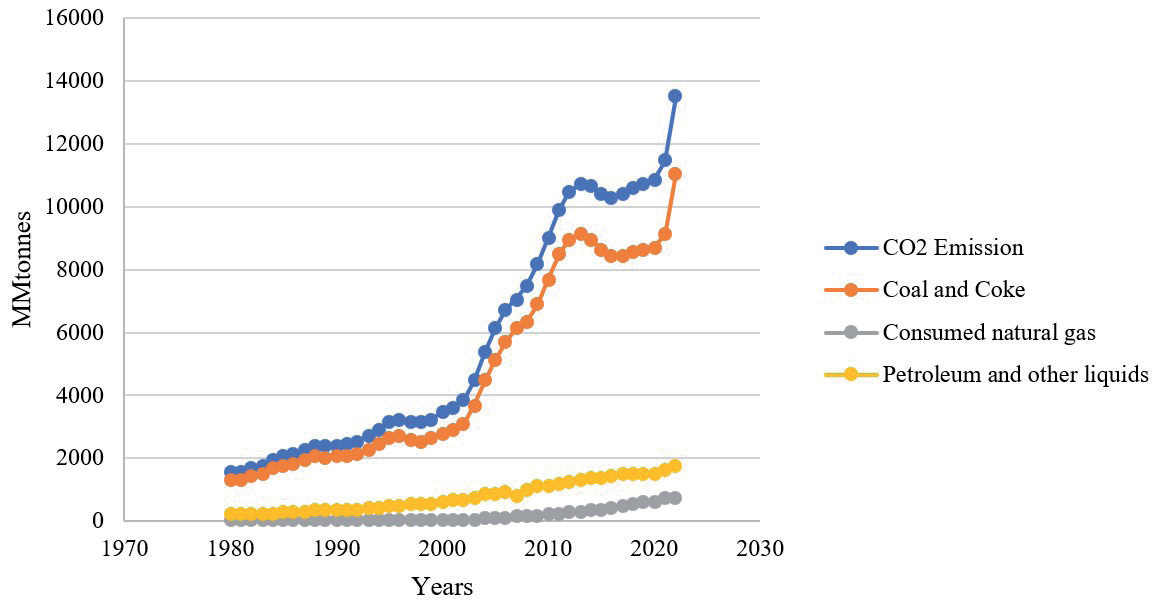
The growing energy consumption gap and consumption of the country has grown to 0.68 billion tons of standard coal, and China has become one of the major energy-importing countries [28]. The continuous economic growth of a country highly depends on its energy [29]. The energy consumption in China is expected to increase in the coming years. Continuous energy demand may cause serious imbalances between energy demand and supply in the future [30]. Moreover, the disproportionate energy consumption has severe environmental implications. Coal is one of the major sources of energy in China [31], as shown in Fig. 2, and it contributes significantly to CO2 emissions. Moreover, coal combustion generates sulfur dioxide and dust, which accounts for 80-90% of the total emissions. The environmental implications of energy consumption, along with the ongoing economic growth of China, have emerged as a major issue in recent years. Therefore, the country is extensively focused on the conservation of resources and the development of an environmentally friendly society. In this regard, China demands the transformation of the energy structure and lowers the environmental implications of traditional energy sources to achieve sustainable development, because traditional energy sources cause major GHG emissions [9]. Accordingly, China has focused on ET through RE development [32].
Effective EVP must be executed to reduce the hurdles and challenges in achieving sustainable ET in the country. In this regard, the country must consider green energy technologies, conservation of natural resources, and solid environmental policies alongside economic growth to foster sustainable development and ET. This study contributes to the existing knowledge by providing fresh insights into the links between green energy technologies (GET), environmental policies (EVPs), natural resources (NR), green growth (GG), and energy transition (ET) in China at different quantiles. Moreover, the application of the Fourier quantile causality test (FQCT) provides a more comprehensive and thorough understanding of the dynamic relationships among variables. The current study uses the most recent data to analyze this complex relationship among the aforementioned variables. Moreover, this study also incorporated the moderating impact of EVPs on the relationship between GET and NR with GG and ET. Finally, the application of FQCT provides reliable results in conjunction with spectrum analysis, and it also considers structural breakdowns, position, quantity, and shape that do not have to be predetermined in advance.
Review of Literature
The economic growth of a country is highly dependent on energy technologies, and the development of GET accelerates sustainable economic growth [33]. Firms and industries in a country must transform their production methods and improve their sustainable performance to foster a nation’s GG [5, 34]. The adoption of advanced technologies with high efficiency in energy consumption [35] contributes significantly to sustainable ET, and faster adoption of RE can be realized. If a nation has more economic resources, it can invest more in innovation alongside higher economic development [10, 36]. In this way, the nation can easily cover the cost of RE generation [37]. Additionally, economic growth increases environmental degradation [38], necessitating environmental patents and imposing green taxes to preserve the environment [3].
Irandoust [39] has found the unidirectional causality between energy technologies and RE consumption by using the vector autoregressive model. Their findings could not reveal the causality between energy and economic growth. The findings of Hu et al. [40] revealed the positive impact of RE and energy technologies on the economic development of India. Pece et al. [41], Alp et al. [42], and Yang et al. [43] also found the positive impact of innovations on the economic growth of CEE countries. Similarly, Ullah et al. [44] found the favorable role of technology advancements in ET by applying the CS-ARDL model that causes pollution-free G7 economies. Ramzan et al. [12] have used the bootstrap rolling-window, and found the positive role of technological advancements and economic growth on ET in the UK. Chen et al. [45] analyzed the panel of BRICS countries from 1993 to 2019 and found a positive long-run impact of environmental innovations on BRICS economies’ GG.
In the case of NR, it is highly admired that the economic growth is majorly dependent on the endowment of NR [46]. Economies need NR for their economic development [16, 47], and they also play an important role in achieving a sustainable environment [17, 14]. However, the depletion and exploitation of NR majorly contribute to environmental pollution [18]. In this context, the inefficient and unbalanced consumption of NR around the world causes serious environmental issues, including climate change, water scarcity, deforestation, and waste generation [48]. Lee and He [16] found the detrimental effect of NR on GG, and described that this relationship between NR and GG may be influenced by the market-oriented institutions. Khan et al. [49] used the panel data of the OECD and found reliable outcomes with the application of various econometric models. They described that the NR, RE consumption, and ET contribute to the environmental quality and adversely affect their economic growth. Xu et al. [50] have used the second-generation panel data technique and analyzed the links of GG, RE, NR, and green innovation with the economic performance of BRICS countries. They stated the heterogeneous impact of GG on environmental performance of the BRICS economies. They found a negative impact of green innovation on environmental performance, while NR and RE have a significant impact on the environmental performance of the economies.
Huang [19] has examined the influence of NR and economic growth on ET in China and found the positive impact of both variables on ET by applying the error correction model and ARDL model. However, they could not focus simultaneously on the impact of EVPs on ET and GG. Zhang et al. [51] have found the negative impact of NR on GG by applying slack-based measures and global Malmaquist-Luenberger, and GMM regression on the panel of 77 different economies. Cheng et al. [52] also found the negative impact of NR on the economic growth of China, based on the panel of 30 provinces from 2003-2016. Gyamfi et al. [20] used the panel of G7 economies and found the significant negative impact of NR rents on environmental quality.
In addition to the aforementioned literature, there are various additional factors that affect RE consumption. The most important of them are EVPs formulated and applied by the governments [21, 53, 54]. The stringency of EVP in order to lead the economy toward the GG [55], through the adoption of advanced and environmentally friendly practices, may lead to the conservation of NR to counter climate change, which fosters the ET [56]. On the other side, the implementation of EVPs exerts an additional cost to the firms and consumers in the form of low productivity and competitiveness [25]. However, these impacts can be overcome through EVP stringency, leading firms to adopt advanced technologies in order to increase their efficiency and market competition [24]. This increases economic growth, which further paves the way to develop clean and environmentally friendly technologies [23].
Concerning the EVPs and their role in economic development, studies show that the EVPs have the potential to boost the economic growth of a nation. The EVPs may foster high-quality sustainable economic development along with the high adoption of innovation and a high level of competition [57, 58]. On the opposite side, a lack of green EVPs may cause unbounded growth, which has a great impact on the environment in terms of excessive pollution, resulting in a big environmental calamity. It creates a big challenge for the economies to achieve sustainable economic growth [59]. They described the negative impact of green policies on economic growth. Hamaguchi [60] has used the R & D based growth model and examined the impact of EVPs on economic growth. They have conducted a numerical analysis by using the endogenous labor supply. They found the beneficial impact of policies on the growth rate and welfare. The GG of an economy requires effective environmental technologies grounded on institutional policies regarding the environment. Wu and Zhang [61] highlight the importance of EVPs regarding environmental preservation, and advanced technologies in fostering the GG and environmental sustainability.
Table 1.
Data description.
Concerning the EVP stringency also has a crucial role in fostering the GG and ET. The stringency of EVP needs the innovation of the technologies related to the environment, and economic organization’s structure, which greatly affect the GG of an economy [61]. In the context of stringency index measurement, the EVP stringency index developed by the OECD is widely used, which extensively explains the multidimensionality of environmental rules and regulations [62, 63]. Additionally, nations also impose environmental and energy taxes [26], which lower the use of traditional and dirty energy sources. Bashir et al. [27] analyzed the impact of environmental taxation on green technology innovation. They found the favorable impact of taxation on the adoption of green technology by applying robust econometric models, such as quantile regression, fully modified ordinary least squares, and DOLS. Tang et al. [64] used the Chinese data to explore the role of a carbon tax in environmental preservation. They found carbon taxes are beneficial in reducing environmental pollution, but negatively influence the economic growth of China. In regard to different EVPs applied around the world, Adebayo and Ullah [65] described the positive impact of Chinese government policies regarding the environment and energy on sustainable economic growth.
In the case of ET, Shahzad et al. [66] have used the EVP stringency index along with the environmental taxes and technological innovation and examined their impact on electricity generation in developed nations. Wolde-Rufael and Mulat-Weldemeskel [67] have analyzed the favorable impact of environmental taxes and RE on environmental preservation, and sustainable growth. In terms of the moderating impact of environmental taxes, Doğan et al. [68] have found a significant moderating impact between the NR rents, RE, and energy consumption. Wang et al. [69] also endorsed the strict EVP stringency to foster the RE consumption. Conversely, Bashir et al. [27] and Dogan et al. [26] found the negative impact of environmental taxes on RE consumption in 25 EU nations.
The aforementioned review of literature has provided robust evidence regarding the lack of research examining the dynamic relationship of GET, EVN, NR, GG, and ET in China. All the earlier studies have only focused on these variables individually, but there is a lack of literature that entails all of these variables together, especially in the case of China. Moreover, the current study also analyzes the moderating role of EVP. Therefore, the current study is planned to explore this research gap by applying the Fourier quantile causality, which will provide a comprehensive understanding of the complex relationships among the variables for developing effective policies for China to foster sustainable development and ET.
Materials and Methods
Data Description
The current study aims to explore the individual impact of GET, EVN, NR, and the moderating role of EVP on GG and ET in China. For this purpose, we used the yearly data from 1996 to 2020. Table 1 describes the variable used for the study analysis. For GG, we have considered the GDP (current US $) adjusted to environmental multi-factor productivity. The data regarding the indicators of the GG, the number of patents regarding RE technologies, and the EVP stringency index were assessed at the Organization for Economic Cooperation and Development (OECD). The data regarding ET and NR rents were obtained from World Development Indicators (WDI).
Methods
As we have the data from only one country (China), we transformed the yearly data into quarterly form by employing the quadratic match-sum technique. This technique extensively reduces the need for extensive data transformation, and optimally considers the seasonality of a transformation from lower to higher frequency [70]. To avoid the misspecification error, we transformed the data first by applying the logarithmic form.
Granger [71] has proposed the causality technique which is further widely adopted around the world. In the last decades, many studies have used the Granger causality test along with other time series econometric techniques like VAR [72-74], but could not consider the structural break. Then, Enders and Jones [75] used Gallant’s Fourier estimates to modify the Granger causality test in order to eliminate the problem of omission of a structural break. Therefore, the current study used the Toda-Yamamoto Fourier test after following Nazlioglu et al. [76] and Enders and Jones [75] while relaxing the assumption of constant intercept as presented in Eq. (1).
where, Y depicts the endogenous variables including GET, EVN, NR, EVP, GG, and ET, t shows the time. α (t) describes the time-based intercepts, ξ1 depicts the coefficients to be estimated, and l show the lags length. The dmax shows the integration order and εt signifies the error term. We applied the Fourier estimates on α (t) to address the problem of structural breaks as shown in Eq. (2).
Where “f” depicts the frequency that is used to minimize the sum of squared value. The symbol “T” and “t” shows the observations and time trend, respectively. The symbol "κ1f" and "κ2f" depicts the estimation of the degree and links between the frequencies. We placed Eq. (2) into Eq. (1) to deal with the structural break by applying the Toda and Yamamoto [72] causality as shown in Eq. (3).
The F-statistics [77] are employed to authenticate the significance levels of trigonometry used in Eq. (3). The application of Fourier estimation in the technique proposed by Toda and Yamamoto [72] is possible if the coefficients are not equal to 0. To justify the hypothesis of no-causality, the Fourier coefficient must not be equal to 0.
There is a limitation of the Toda and Yamamoto Fourier approach, as it is unable to deal with the tail and non-linear causality. We have applied the modified method proposed by Cheng et al. [78] to address this limitation. For this purpose, the bootstrap Fourier causality in quantile (BFCQ) was applied, which uses the quantile autoregression technique. Therefore, after the integration of Cheng et al. [78] techniques, the Eq. (5) describes the BFCQ.
(5)
Where, Z depicts the covariates matrix, and f * and p * shows the frequencies and lag length, respectively. To test the no causality null hypothesis, the following equations were developed.
Table 2.
Unit root test.
Where, ξ(ς) shows the coefficients for the ςth quantile vectors in eq.7. The matrix of variance and covariance of coefficients is presented by ϖ. To confirm the causal effect at a specific quantile, the Wald test must exceed its critical values to reject the null hypothesis as shown in eq.6.
Results
The foremost step before testing the causality is to determine the highest integration order of variables. For this purpose, we applied two techniques, such as ADF and DF-GLS for identifying the stationarity of the variables in order to determine the integration order. The outcomes of the ADF and DF-GLS methods highlight that originally all variables were not stationary at level, but turned stationary at their 1st difference. Therefore, the variables are integrated at their 1st difference, i.e., I (1) for all models’ specifications (Table 2).
After specifying the highest integration order of the series of “1”, we applied the F-test to determine the significance of the Fourier function. The optimal lag (p*) and frequency (f*) were fixed at 6 and 4 after following the suggestion of Cheng et al. [78]. The F-test confirms the significance of the Fourier function as the F-test value is greater than the critical values obtained through bootstrapping even at 1% for both types of the models (GG and ET models). therefore, it describes that the Fourier function is applicable for analyzing the causal effects in both the GG model and the ET model. It means the application of the Fourier function is more reliable in analyzing how various variables affect the GG and ET as compared to the other methods (Table 3).
Causality Test Regarding Green Growth
Table 4 presents the findings of Fourier quantile causality regarding GG, which describe the unidirectional causality among the variables. Likewise, the GET has a significant and positive impact on the GG. For example, at the 30th, 50th, and 70th percentile, the GET continuously has a significant impact on GG as moving further up to the higher quantile. However, the most consistent and strong impact of GET on GG was found at lower quantiles as compared to the higher quantiles. It emphasizes that the GET may play an important role in fostering the GG particularly where the growth is very low. The NR also has unidirectional causality at the 30th and 50th quantile, which endorses that at the lower and median level of data, the NR has a significant large effect on GG. The findings emphasize the big impact of NR on the GG at the median quantile. However, the varying impact of NR on GG has been observed, potentially depicting the diminishing role in fostering the GG at higher quantiles. In the case of EVP, it is observed that the environmental policies significantly have a big impact on GG by moving from median to higher quantiles. There is a strong effect of EVP on GG at the higher quantiles which highlights the important role of EVP in fostering the GG.
The substantial but insignificant positive moderating role of EVP between GET and GG at the lower quantiles (10th and 30th) was observed. However, at the higher quantiles (50th, 70th, and 90th) the synergistic impact of EVP and GET on GG highlights the importance of synergy between EVPs and GET in fostering the GG in the country. On the other hand, the synergistic impact of EVP and NR at the 10th quantile, Wald statistics 5.865 demonstrates the insignificant interaction impact of EVP and NR on GG. However, at the 30th, 50th, 70th, and 90th quantiles, the significant and increasing interaction impact of EVP and NR on GG underscores the importance of the synergy of EVP and NR in fostering GG in the country.
Causality Test Regarding Energy Transition
Table 5 shows the findings of the Fourier quantile causality test regarding ET. The GET has unidirectional causality and a significant positive impact on ET at all quantiles. The GET has a strong increasing impact as moving from lower to higher quantile. it underscores the crucial role of GET in fostering the ET. it emphasizes that the higher the green technologies may facilitate the process of energy transition. The NR only have a significant positive impact on ET at higher quantiles like 70th and 90th. A similar pattern was observed in terms of the causal impact of EVP on ET.
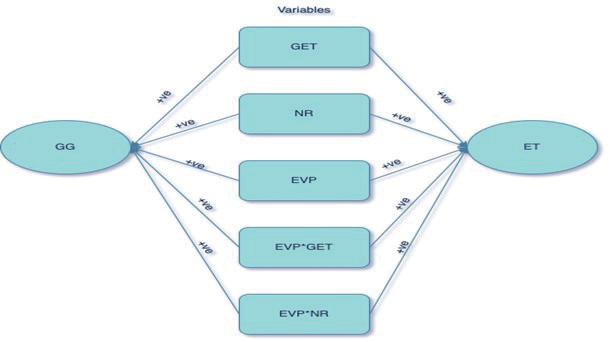
Regarding the interaction impact of EVP and GET on ET, the substantial impact of synergy between variables on ET at a lower quantile was observed by this impact was insignificant. However, the synergistic impact of EVP and GET on ET was significant and very strong at higher quantiles. A similar pattern was observed in terms of the synergistic impact of EVP and NR on ET. Fig. 3 describes the summary of findings graphically.
Table 3.
Determining the significance of the Fourier function.
| Models | ||
|---|---|---|
| GG | ET | |
| f* | 2.16 | 2.33 |
| p* | 6 | 6 |
| F-test value | 14.032* | 12.775* |
| Critical values | ||
| 1% | 12.046 | 9.362 |
| 5% | 10.245 | 7.372 |
| 10% | 8.352 | 6.948 |
Table 4.
Fourier quantile causality test for green growth.
Discussion
Sustainable development is a long-term phenomenon [79] that highlights the importance of two different concepts, GG and ET, in maintaining the balance between economic growth and environmental protection. Lowering air pollution and using resources efficiently are the prime concerns of GG, which focuses on the growth of an economy without compromising the environment while using natural resources [80, 81]. GG also demonstrates investments in RE, clean technologies, and energy efficiency. Similarly, ET refers to switching from traditional energy sources to clean and modern energy sources, such as RE sources, including wind, solar, and hydropower. This transformation reduces GHG emissions, which primarily cause climate change [82]. Sustainable ET is not just switching from traditional energy sources to new and highly efficient energy sources; it is also a big challenge to ensure that the societal and environmental costs, benefits, and risks associated with the shift are well managed in a way that can be considered sustainable [6]. China is experiencing continuous economic growth and high energy consumption. To achieve GG and sustainable ET, a country needs effective environmental policies, efficient use of natural resources, and clean energy technologies. Thus, the current study aimed to analyze the dynamic relationships among GET, NR, EVP, GG, and ET.
Table 5.
Fourier quantile causality test for Energy Transition.
The findings of this study reveal that the impact of GET and NR on GG is not deterministic. Economically, the country depends on heavy industrial sectors, including cement, steel, and manufacturing [83]. These industrial sectors are very energy intensive [84] and require substantial investment in transforming their traditional practices. This poses a major challenge in the adoption of sustainable practices because of the uncertainty of obtaining sufficient returns on investment. This makes the industrial sector hesitant to fully commit. Moreover, the compatibility of existing infrastructure with new technologies hinders the adoption of GG practices [85]. Therefore, the country invests heavily in R&D, but the pace of technological innovation may vary across countries owing to technical, economic, and regulatory differences [86].
Regarding NR, China experiences an uneven distribution of resources across the different regions of the country [87]. Moreover, past industrial production activities may cause major challenges in fostering the GG. This may require significant capital, resources, and time for fostering the adoption of green practices. The industrialization history of China demonstrates the extensive use of energy sources and major environmental implications [88]. This has charged the country with heavy environmental costs and ecological overload, leading to challenges in transforming economic activities [89]. Similarly, environmental inequality across the regions of China is an indication of its long-run unbalanced regional development [90]. Additionally, awareness among the public plays a crucial role in accepting the GG initiatives [91], which also varies across the regions. Similarly, the GG transitions in the country may disturb the traditional industries, which need reskilling programs for the workers. Therefore, the interaction between economic, technological, environmental, and political factors causes the nondeterministic impact of GET and NR on the GG. This may necessitate a comprehensive approach that focuses on the diverse and sometimes conflicting aspects for achieving the GG in the country. In this regard, the EVPs play an important role in intensifying the impact of GET and NR in order to foster long-term GG in the country. The findings regarding the moderating role of EVP between the GET, NR, and GG demonstrated the crucial role of comprehensive EVP in aligning the GET and NR toward achieving the GG. Hassan et al. [92] describe that the progression of green development policies in the manufacturing industry of the country emphasizes the need for aligning manufacturing and environmental policies, which accelerates the policy creation process and enhances the development of systemic policy tools. Wu and Zhang [61] also endorsed the positive impact of environmental policies and environmental technologies in fostering the GG. Similarly, Xu et al. [93] also highlight the crucial role of the interaction of EVP stringency with government interventions regarding clean environmental technologies to promote the GG in the country.
In the case of ET, the GET has strong causality and has a significant major impact on ET. It highlights that the GET is very important for achieving sustainable ET. The transformation of energy sources to green energy sources lowers the impact of climate change [94, 95]. Moreover, large economies like China rapidly adopting the RE may lead to major environmental leapfrogging [96]. The findings also revealed the unidirectional causality of NR and having a strong impact on ET at the highest quantiles. When these two aspects of ET interact with EVPs, their impact on ET becomes more intense and stronger. It might be possible to say that the EVP facilitates the firms to get access to NR to adopt the GET [44]. Governments prioritize the climate by establishing targets for low emissions and executing environmentally friendly approaches [69]. Applying the carbon tax properly lowers the consumption of fossil fuels [97]. Similarly, enhancing awareness among society may contribute to getting the rapid outcomes associated with EVPs in order to promote GET adoption and RE consumption.
Conclusions
Economies make efforts to achieve sustainable development, but they face many challenges in maintaining the balance between economic growth and the environment. China has experienced rapid economic growth, along with an increasing demand for energy consumption. As energy majorly contributes to GHG emissions, energy transition necessitates the execution of effective initiatives to foster the transformation of traditional energy sources to clean energy sources. In this regard, the country has focused on resource conservation and an environmentally friendly society. In order to achieve GG and sustainable ET, the current study highlights important insights regarding the role of GET, NR, and EVP stringency in fostering GG and ET.
This study applied the bootstrap Fourier Granger causality test to examine the impact of GET and NR on GG and ET from 1996Q1-2020Q4. Moreover, this study also revealed the moderating role of EVP stringency among the variables in fostering GG and ET. We use five quantiles with equal intervals (0.10, 0.30, 0.50, 0.70, and 0.90). The findings reveal that all the variables have unidirectional causality with GG and ET. The outcomes regarding GET in the case of GG demonstrate the strong impact of GET at lower quantiles, which emphasizes that GET can play a crucial role where growth is very low. Generally, GET and NR indicate that both elements are important determinants of GG. This highlights that with investment in GET and in the sustainable management of NR, the country can experience better outcomes for GG. Additionally, at higher quantiles, the synergistic impact of EVP, GET, and NR revealed the crucial role of EVP stringency in intensifying the impact of GET and NR on GG. The significant positive and increasing impact of GET on ET at all quantiles highlights that a higher GET facilitates the process of ET in the country. On the other hand, only the significant impact of NR at the 70th and 90th quantiles on ET shows that better-than-average resource endowment promotes ET. This also demonstrates the critical role of NR in fostering ET progress in the country. Therefore, the findings reveal that regions with high GET and exponentially well-endowed NR may accelerate the ET process. In the case of ET, a strong and intense synergistic impact of EVP, GET, and NR was observed. This implies that EVP stringency plays a more deterministic role in fostering substantial progress in ET.
To promote GET, China must foster the development of green technologies. For this, the government may increase funds to encourage innovation, which leads to a low-cost and effective GET. Similarly, the government may exempt the tax burden on businesses to foster GT adoption. Additionally, the government may provide subsidies or financial incentives to purchase and install new modern technologies that simultaneously foster ET and GG. Some regions of China have abundant NR and the government may develop policies to foster the integration of renewable natural resources into the national energy grid. Regional strategies may foster the development of GG and ET. For example, the coastal region may focus on the generation of energy from wind, while the sunny region may focus on the development of solar technologies, which also leads to GG. Regarding EVP stringency, government and environmental agencies may strictly observe firms with regard to emission standards developed to lower emissions. Moreover, the national grid must be upgraded by adopting smart grid technologies to integrate the RE sources. Similarly, the government could develop a comprehensive framework to lower carbon consumption by setting targets.

