


Introduction
Salt stress is a significant abiotic challenge that disrupts crop development, reduces yields, and negatively impacts overall plant health. Its detrimental effects manifest in various forms, including morphological changes like stunted growth, chlorosis, and poor seed germination [1-3]; physiological disruptions such as reduced photosynthesis and nutrient imbalances [2, 4]; and biochemical alterations including oxidative stress, electrolyte leakage, and membrane destabilization [5, 6]. Salinity stress affects plants in two main phases: an initial osmotic stress phase and a toxic ion accumulation phase. Osmotic stress occurs early, as
Introduction
Salt stress is a significant abiotic challenge that disrupts crop development, reduces yields, and negatively impacts overall plant health. Its detrimental effects manifest in various forms, including morphological changes like stunted growth, chlorosis, and poor seed germination [1-3]; physiological disruptions such as reduced photosynthesis and nutrient imbalances [2, 4]; and biochemical alterations including oxidative stress, electrolyte leakage, and membrane destabilization [5, 6]. Salinity stress affects plants in two main phases: an initial osmotic stress phase and a toxic ion accumulation phase. Osmotic stress occurs early, as increased salt concentration around the roots decreases water potential, limiting water uptake by plant cells and inhibiting growth [1-3]. With prolonged exposure, toxic ions like sodium and chloride accumulate, further impairing nutrient uptake and causing significant damage to plant tissues [5, 6].
Salvia officinalis (sage), a perennial herb from the Lamiaceae family, is highly valued for both its culinary and medicinal applications [7]. Under salinity stress, S. officinalis experiences significant reductions in plant height, chlorophyll content, and essential oil yield that collectively impair photosynthesis and accelerate leaf senescence [8-10]. Physiological and biochemical responses to salt stress in sage include suppressed shoot elongation, diminished leaf water content, and general growth inhibition. These effects are primarily attributed to osmotic limitations, ion toxicity, and impaired nutrient uptake. Prolonged salt exposure further disrupts photosynthetic capacity through stomatal closure and ion-induced damage to chloroplasts. In response, S. officinalis accumulates compatible solutes such as proline and soluble sugars, which help retain water and support cellular function. However, under severe or prolonged stress, these protective mechanisms are often insufficient to fully mitigate damage [11]. Salvia miltiorrhiza’s salinity stress disrupts ion homeostasis by increasing Na⁺ levels while depleting essential ions such as K⁺ and Ca²⁺, leading to reduced growth and chlorophyll b content. Antioxidant responses also shift under salt stress, with decreased superoxide dismutase activity and increased catalase activity, alongside elevated levels of osmolytes like sugars and proteins, contributing to osmotic balance and partial stress alleviation [12]. Other Salvia species, including those in the Perovskia subgenus, demonstrate pronounced root sensitivity to salt stress, often exhibiting greater root biomass loss than shoot biomass loss. Salt exposure also modifies the composition of essential oils, with more salt-tolerant species showing higher water retention and nutrient uptake, reflecting their physiological and biochemical adaptability [13]. Collectively, Salvia species employ a suite of adaptive strategies ‒ such as osmolyte accumulation, antioxidant modulation, and altered secondary metabolism ‒ to counter salinity stress. Nonetheless, their resilience remains constrained by the intensity and duration of the stress. This interplay of stress responses not only impacts plant survival and productivity but also affects the medicinal quality of these important herbs [11-13]. Salinity can also markedly affect the plant metabolome, altering both primary and secondary metabolites. These changes underscore the role of metabolite reprogramming in mediating plant adaptation to environmental stressors [1, 10-16]. Understanding these metabolic dynamics is crucial for optimizing the cultivation and utilization of S. officinalis in saline environments, with implications for both agricultural performance and product quality in herbal medicine and culinary use.
This study aimed to investigate the metabolomic alterations in S. officinalis leaves subjected to different levels of salinity. We hypothesize that increasing salt concentrations induce specific changes in the plant’s metabolite profile, which are closely associated with physiological indicators such as chlorophyll content. Moreover, we propose that certain metabolites may serve as biomarkers of salt tolerance by participating in key processes such as osmotic adjustment, oxidative stress mitigation, and ion homeostasis. A comprehensive understanding of these metabolic and physiological responses will inform strategies for enhancing the cultivation, stress resilience, and medicinal value of S. officinalis in saline environments.
Materials and Methods
Plant Growth Conditions and Salinity Stress Treatment
We grew S. officinalis seedlings under controlled conditions with 14 h of light (80 μmol m⁻² s⁻¹, 21°C) and 10 h of darkness (20°C), maintaining 55-60% relative humidity. Six-week-old plants were subjected to salinity stress after transplanting into a peat moss:perlite:vermiculite (2:1:1) soil mix. We irrigated the plants three times a week with 5 (control, tap water), 25, 50, 100, 150, or 200 mM NaCl solutions for up to 8 days. We collected leaf samples at 2, 4, 6, and 8 days of treatment [17].
Physiological Pigments: Quantification of Chlorophyll, Anthocyanin, and Carotenoids
We analyzed photosynthetic pigments by extracting 20 mg of fresh leaf samples in 1 mL of cold 80% acetone, incubating in the dark for 1 h, and centrifuging at 13,000 rpm (4°C) for 10 min (Sigma 204, Germany). We measured the absorbance of the supernatant at 470 nm, 645 nm, and 663 nm using a spectrophotometer (SCO Tech, Germany) to determine chlorophyll a, chlorophyll b, and carotenoid concentrations, following the methods described in [18] and [19]. To determine anthocyanin content, we homogenized 20 mg of leaf tissue in 1 mL of methanol:HCl:water (90:1:1), incubated it in the dark for 1 h, and centrifuged at 16,240×g for 15 min at 4°C. We measured absorbance at 529 nm and 650 nm [20].
Oxidative Stress Markers: Hydrogen Peroxide
(H2O2) and Malondialdehyde (MDA)
Measurements of H2O2 Content
We measured leaf H₂O₂ content using the method described in [21]. Briefly, we homogenized 0.1 g of frozen leaf material in 0.1% (w/v) trichloroacetic acid on ice, centrifuged at 15,000 g for 15 min at 4°C (Sigma 204, Germany), and collected the supernatant. We mixed 0.5 mL of supernatant with 0.5 mL of 10 mM potassium phosphate buffer (pH 7.0) and 1 mL of 1 M KI. After gentle mixing, we measured absorbance at 390 nm using a spectrophotometer (SCO Tech, Germany) and determined H₂O₂ concentration from a standard curve.
Determination of Lipid Peroxidation
We assessed lipid peroxidation by measuring malondialdehyde (MDA) following the method in [22]. Briefly, we homogenized 50 mg of tissue in 1 mL of 80% (v/v) ethanol on ice, centrifuged at 16,000 g for 20 min at 4°C (Sigma 204 centrifuge, Germany), and mixed 0.5 mL of supernatant with 0.5 mL of 20% (w/v) trichloroacetic acid containing 0.65% (w/v) thiobarbituric acid. We incubated the mixture at 95°C for 30 min, cooled it on ice, and centrifuged it at 10,000 g for 10 min. We measured absorbance at 532 nm and subtracted nonspecific absorption at 600 nm using a spectrophotometer (SCO Tech, Germany). We estimated MDA concentration using an extinction coefficient of 155 mM⁻¹ cm⁻¹.
Salinity Stress Marker: Proline Content and Total Soluble Sugar
Measurement of Free Proline Content
We measured proline concentration using the method described in [23]. We extracted 0.03 g of plant samples in 70% ethanol, then mixed 100 µL of extract with 1000 µL of reaction mixture (1% ninhydrin, 60% acetic acid, and 20% ethanol). After heating at 95°C for 20 min, we measured absorbance at 530 nm using a spectrophotometer (SCO Tech, Germany). We calculated proline concentration using a calibration curve (0.04-1.5 mM) and expressed it as µmol proline g⁻¹ fresh weight (FW).
Estimation of Total Soluble Sugar
Using the anthrone method, we quantified the total soluble sugar (TSS) content [24]. We homogenized 200 mg of fresh tissue in 80% ice-chilled ethanol, centrifuged at 5000 rpm for 10 min at 4°C, and adjusted the supernatant volume to 10 mL with 80% ethanol. We mixed 0.5 mL of supernatant with 1.5 mL of anthrone reagent, heated the mixture at 100°C for 10 min, and cooled it on ice. We measured absorbance at 620 nm using a spectrophotometer (SCO Tech, Germany) and determined TSS content using a D-glucose standard curve.
Non-Enzymatic Antioxidant
Determination of Total Flavonoid Content
We assessed the total flavonoid content (TFC) using the AlCl₃ method [25]. We homogenized 100 mg of leaf samples in 5 mL of 80% methanol, shook the mixture at 200 rpm for 2 h, and centrifuged at 8000×g for 5 min (Sigma 204 centrifuge, Germany). We repeated the extraction and combined the supernatants for TFC measurement [26]. For quantification, we mixed 100 µL of extract with 100 µL of 2% AlCl₃, 20 µL of glacial acetic acid, and 200 µL of methanol, incubated for 30 min at room temperature, and measured absorbance at 425 nm using a spectrophotometer (SCO Tech, Germany). We used a quercetin standard curve (0.5-20 µg mL⁻¹) for calibration.
Determination of Total Phenolic Content
We measured the total phenolic content (TPC) using the Folin-Ciocalteu method [27, 28]. We mixed 100 µL of 70% methanolic leaf extract with 750 µL of diluted Folin-Ciocalteu reagent, incubated for 10 min, then added 750 µL of 2% sodium carbonate. After incubating for 45 min in the dark at 20°C, we measured absorbance at 765 nm using a spectrophotometer (SCO Tech, Germany). We calculated TPC using a gallic acid standard curve and expressed it as mg gallic acid equivalents per g fresh weight (mg GAE/g FW).
Results and Discussion
Photosynthetic Pigment Content
Photosynthetic performance is closely associated with the concentration of pigments such as chlorophyll a (Chl a), chlorophyll b (Chl b), total chlorophyll (Chl a + b), and the Chl a/b ratio, all of which vary with development, senescence, and environmental stress.
Table 1.
Effects of salinity stress on the chlorophyll content (mg g-1 FW) of S. officinalis leaves. The impact of different salinity stress levels and time points compared to the control. Data represent mean values ± SD, n = 3. Different letters denote statistically different means (Tukey’s test; P≤0.05)
Fig. 1.
Carotenoid accumulation levels in S. officinalis leaves under varying salinity stress conditions are presented. The effects of different salt concentrations and exposure durations were analyzed compared to the control. Data are expressed as mean ± SD, with n = 3 biological replicates. Means followed by different letters indicate statistically significant differences based on Tukey’s post hoc test (P≤0.05).
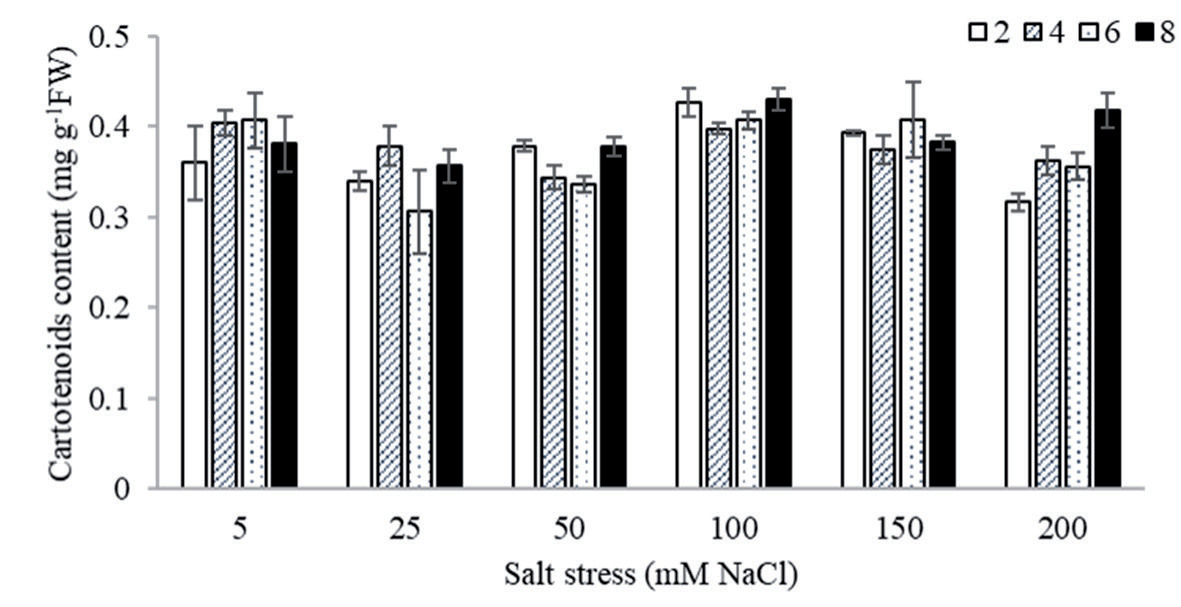
Fig. 2.
Anthocyanin accumulation levels in S. officinalis leaves under varying salinity stress conditions are presented. The effects of different salt concentrations and exposure durations were analyzed compared to the control. Data are expressed as mean ± SD, with n = 3 biological replicates. Means followed by different letters indicate statistically significant differences based on Tukey’s post hoc test (P≤0.05).
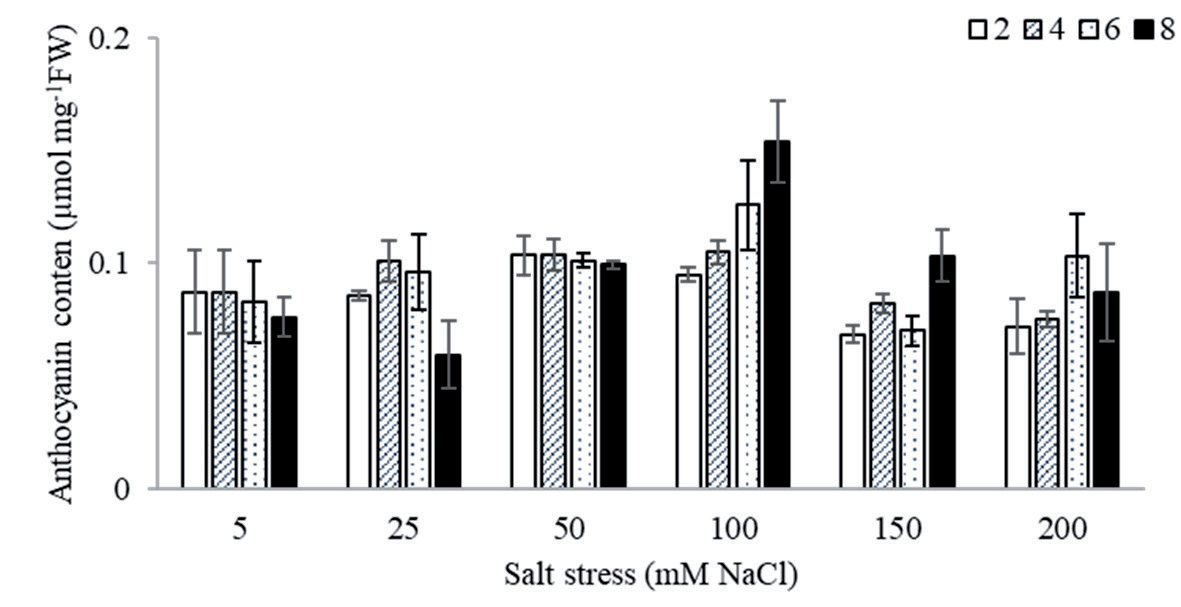
S. officinalis leaves exhibited a significant reduction in Chl a content in response to increasing salt stress and prolonged exposure durations, with the most notable declines — up to 40-50% — occurring under 150 and 200 mM NaCl treatments between days 2 and 6, compared to the control. In contrast, Chl b content remained relatively stable, showing no significant changes regardless of salt concentration or exposure time (Table 1). Similarly, carotenoid levels were not significantly influenced by either salinity or duration of exposure (Fig. 1). As a result, the chlorophyll-to-carotenoid ratio remained unchanged, suggesting that the overall pigment balance was maintained under stress conditions. Furthermore, anthocyanin content showed no notable variation across treatments, remaining within the normal physiological range throughout the experiment (Fig. 2).
Oxidative Stress Markers
Oxidative stress markers are essential for evaluating the effects of abiotic stress on plant growth and development. These markers include the accumulation of H2O2 and the measurement of lipid peroxidation using indicators like MDA.
Hydrogen Peroxide Level
The effects of salinity stress on H₂O₂ content in S. officinalis leaves are shown in Fig. 3. H₂O₂ levels increased significantly under all salt treatments, with the most pronounced elevation being observed at lower concentrations (25 and 50 mM NaCl), where levels rose 2.4-fold compared to the control. Moderate increases were recorded under 100 and 150 mM NaCl, reaching up to 1.8-fold depending on the duration. At the highest concentration (200 mM NaCl), a delayed but notable rise in H₂O₂ was observed after prolonged exposure, with levels increasing to 1.7-fold after 8 days. These results indicate that salinity induces oxidative stress in sage leaves in a dose- and time-dependent manner.
Fig. 3.
H2O2 contents in S. officinalis leaves under salinity stress. The effects of different salt concentrations and exposure durations were compared to control conditions. Data are presented as mean ± SD, with n = 3 biological replicates. Different letters indicate statistically significant differences among treatments according to Tukey’s post hoc test (P≤0.05).
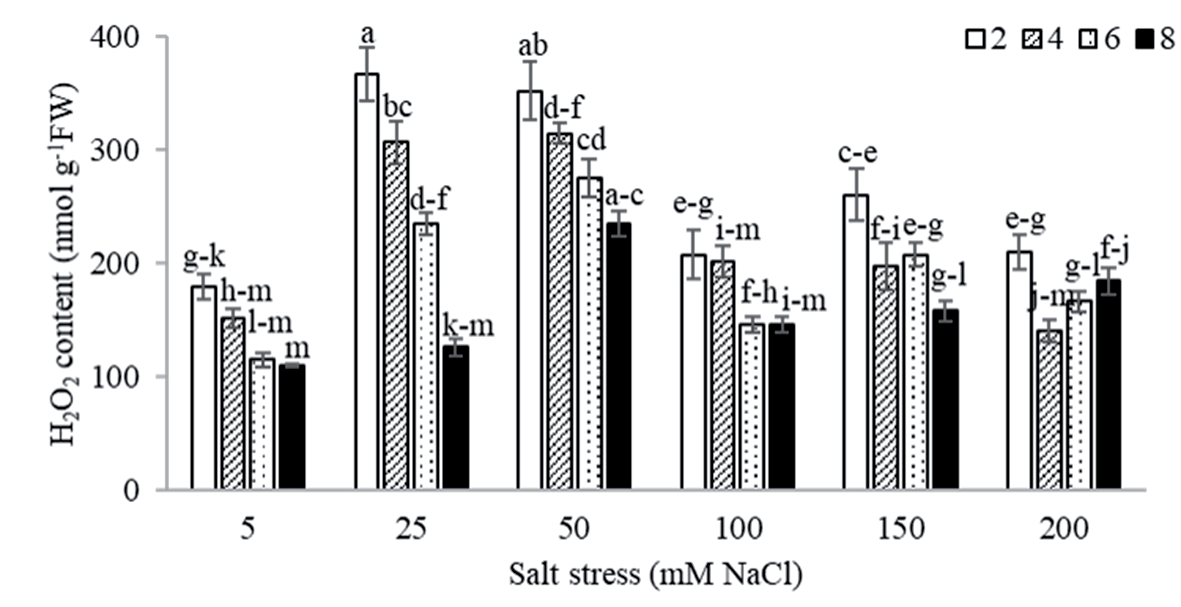
Fig. 4.
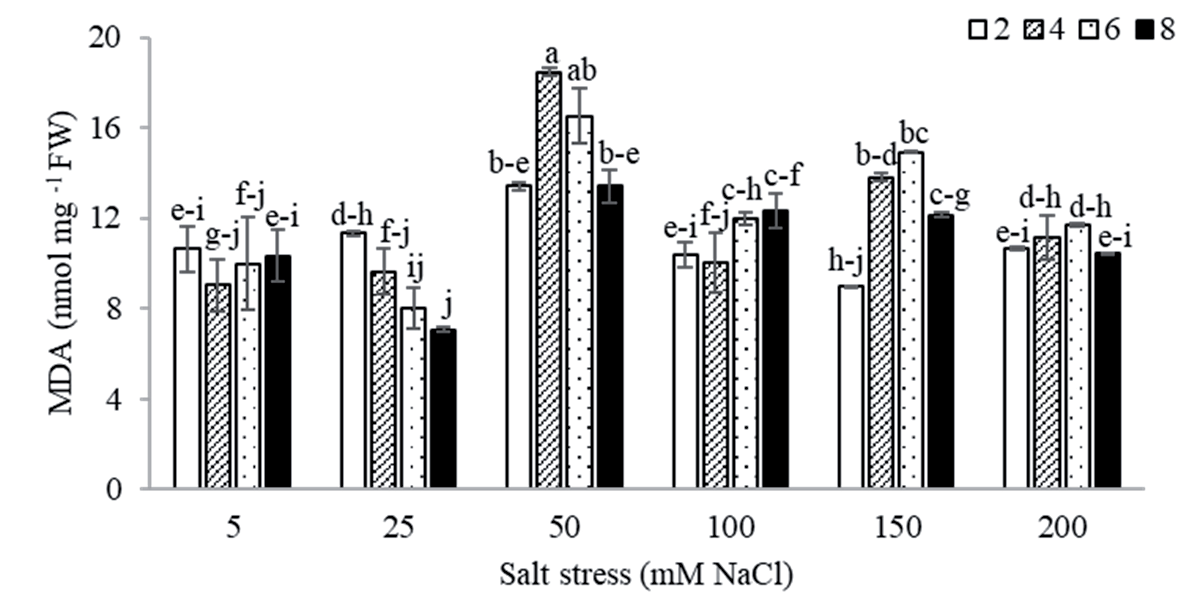
MDA levels in S. officinalis leaves under salinity stress. The effects of varying salt concentrations and exposure durations were assessed relative to the control. Data are expressed as mean ± SD, with n = 3 biological replicates. Different letters indicate statistically significant differences among treatments based on Tukey’s post hoc test (P≤0.05).
Lipid Peroxidation Level
Lipid peroxidation in S. officinalis leaves, assessed via MDA content (Fig. 4), showed a significant increase in response to salt stress, particularly under 50 mM NaCl, where MDA levels rose to 2-fold. Moderate elevations were also observed at 100 and 150 mM NaCl, reaching up to 1.5-fold depending on exposure time. At 200 mM NaCl, MDA levels increased modestly, with a 1.2-fold rise after 4 and 6 days. These results indicate a dose- and time-dependent increase in lipid peroxidation under salinity stress, suggesting enhanced oxidative damage with increasing stress intensity.
Free Proline Content
The findings indicated a significant increase in free proline levels in S. officinalis leaves after prolonged exposure (6 and 8 days) to salt stress (Fig. 5). Notably, proline accumulation was progressively enhanced with increasing NaCl concentrations, reaching up to 3.6-fold under 200 mM. This dose-dependent rise suggests that proline acts as a key osmoprotectant under high salinity stress.
Total Soluble Sugar
Our results indicated a significant increase in total soluble sugar levels in S. officinalis leaves under high salt stress (Fig. 6). At 100 mM NaCl, the sugar content increased by up to 1.5-fold, while treatments with 150 and 200 mM NaCl also showed similar increases (1.2- 1.4-fold) at 4, 6, and 8 days compared to the control. This consistent elevation suggests a role for soluble sugars in osmotic adjustment under prolonged salt exposure.
Total Flavonoid Content
Total flavonoid content, serving as a marker of non-enzymatic antioxidant capacity, was significantly upregulated in S. officinalis leaves subjected to low-to-moderate salinity levels (25-100 mM NaCl), particularly during early exposure periods (2-6 days) (Fig. 7). The most substantial induction occurred at 25 mM NaCl after 2 days, with TFC increasing up to 6.8-fold relative to the control. Higher salt concentrations (150 and 200 mM) elicited a modest (1.5- to 2.4-fold) but notable increase in TFC, predominantly at earlier time points (2 days), suggesting a transient flavonoid-mediated oxidative stress response under acute salt exposure.
Fig. 5.
Free proline content in S. officinalis leaves under salinity stress. The effects of different NaCl concentrations and exposure durations were evaluated relative to the control. Data are presented as mean ± SD, with n = 3 independent replicates. Different letters indicate statistically significant differences among treatments, as determined by Tukey’s post hoc test (P≤0.05).
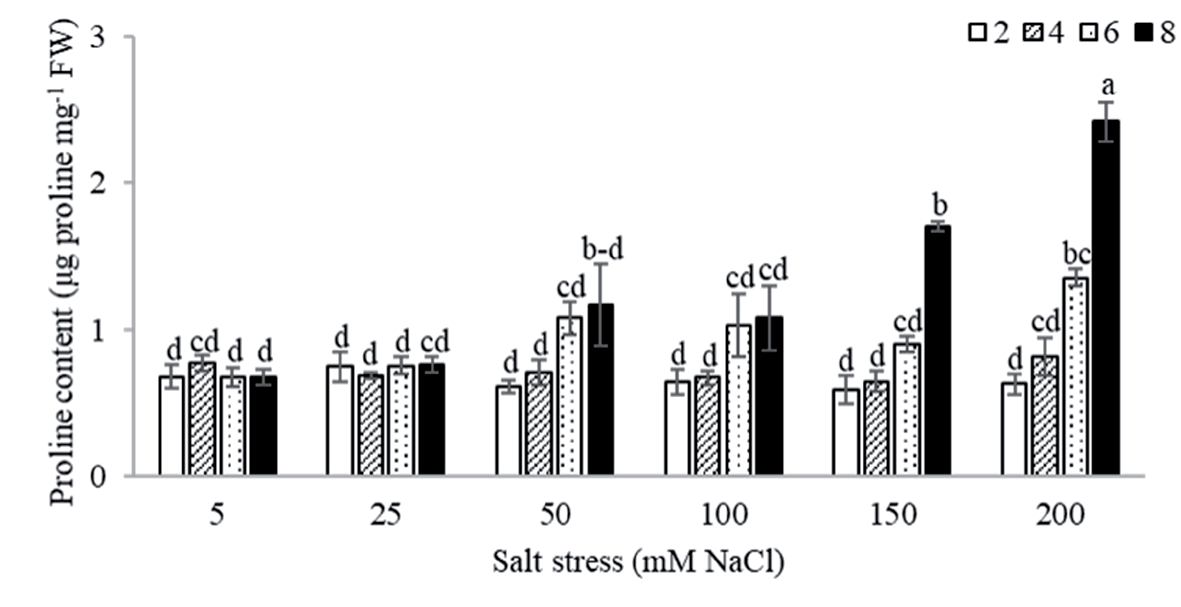
Fig. 6.
Total soluble sugar content in S. officinalis leaves under salinity stress. The effects of varying NaCl concentrations and exposure durations were analyzed compared to the control. Data are expressed as mean ± SD, with n = 4 biological replicates. Different letters indicate statistically significant differences among treatments according to Tukey’s post hoc test (P≤0.05).
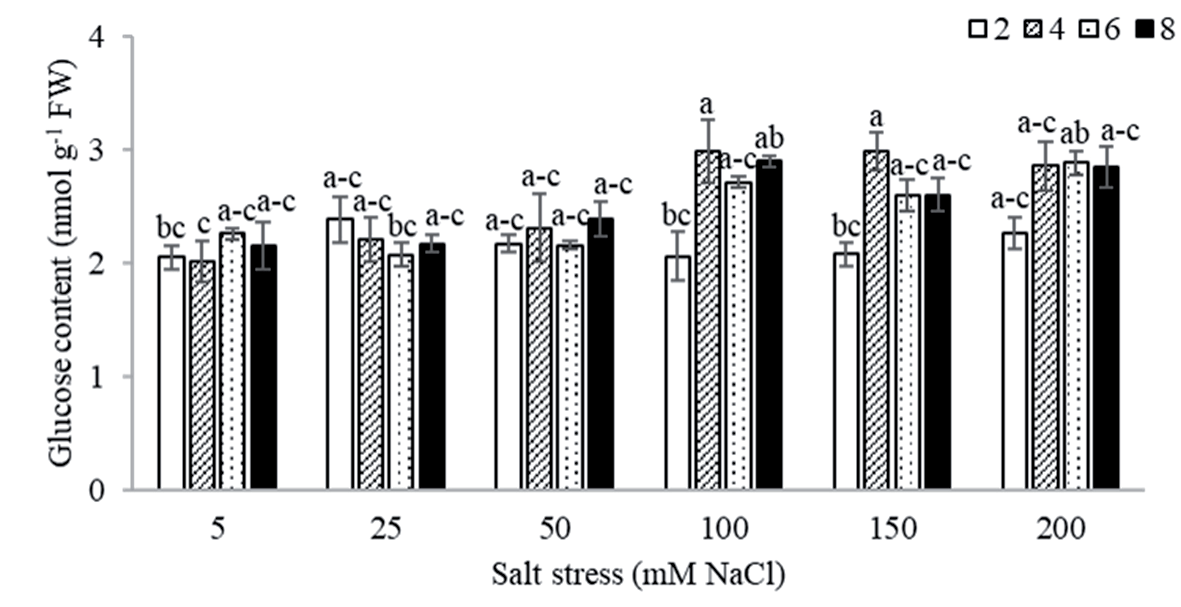
Fig. 7.
Total flavonoid content in S. officinalis leaves under salinity stress. The effects of different NaCl concentrations and exposure durations were evaluated relative to the control. Values are presented as mean ± SD, with n = 5 biological replicates. Different letters indicate statistically significant differences among treatments based on Tukey’s post hoc test (P≤0.05).
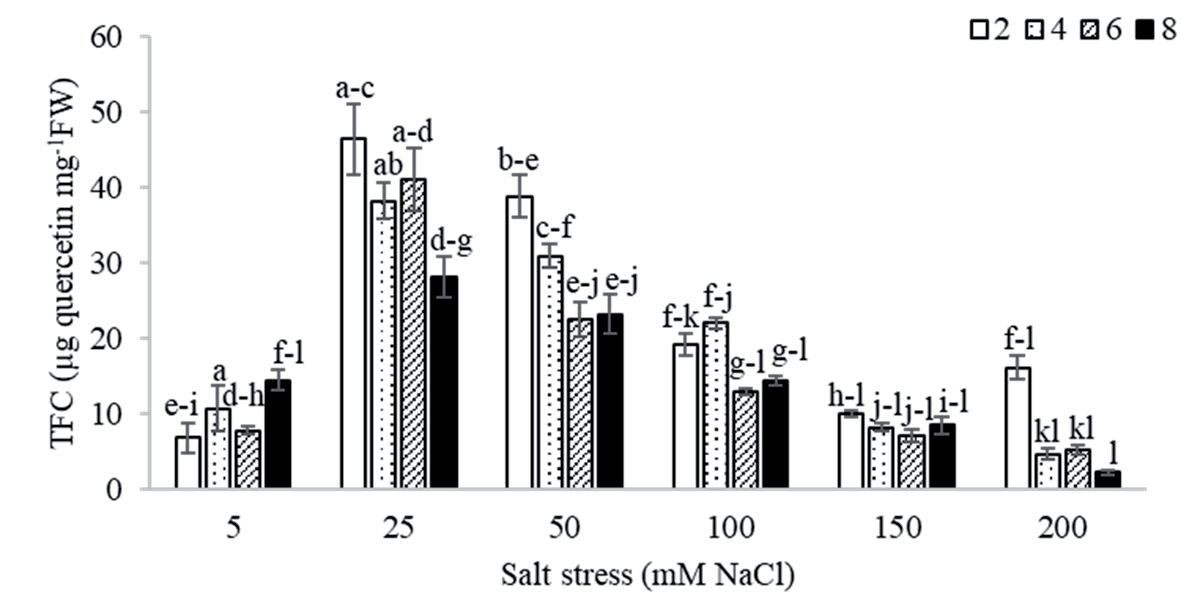
Fig. 8.
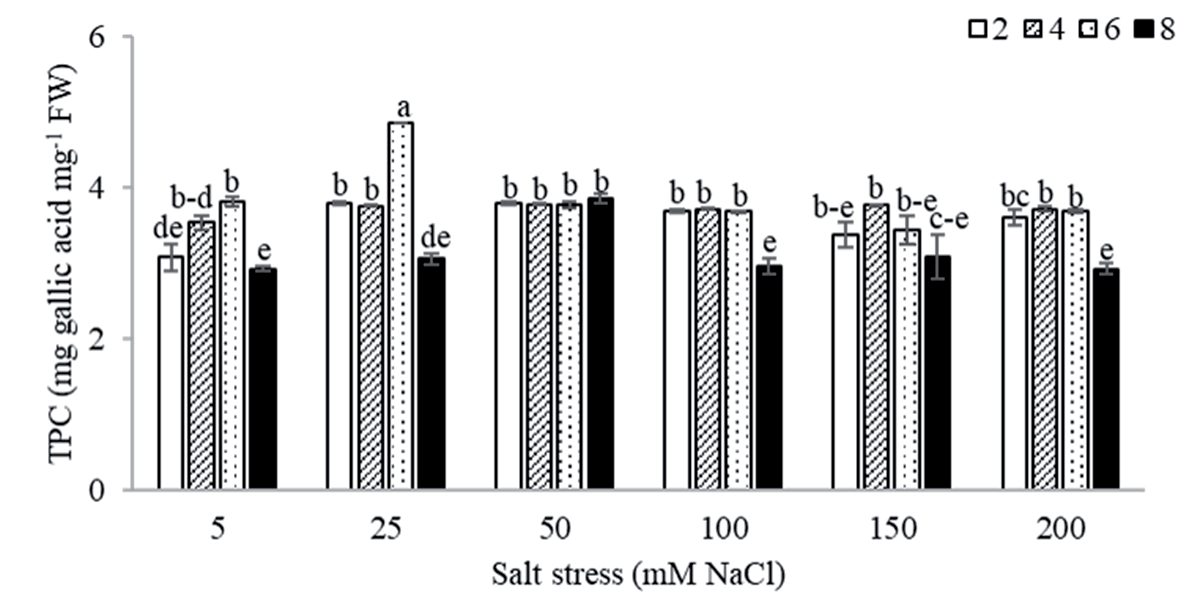
Total phenolic content in S. officinalis leaves under salinity stress. The effects of varying NaCl concentrations and exposure durations were assessed relative to the control. Data are presented as mean ± SD, with n = 6 biological replicates. Different letters indicate statistically significant differences among treatments, as determined by Tukey’s post hoc test (P≤0.05).
Total Phenolic Content
Total phenolic content was evaluated as a marker of non-enzymatic antioxidant capacity in S. officinalis leaves under salt stress (Fig. 8). Short-term exposure (2 days) to low salinity levels (25-100 mM NaCl) resulted in a modest but significant increase in TPC, with values reaching approximately 1.2-fold compared to the control. This early phenolic response suggests an activation of antioxidant defense mechanisms under mild salt stress conditions.
Discussion
Salinity stress exerts broad and detrimental effects on plant performance by disrupting key physiological processes, ultimately reducing growth, productivity, and yield [1, 29, 30]. It affects approximately 7% of global land and 33% of irrigated areas, limiting plant development by lowering water potential and inducing both physiological and morphological alterations [8]. The metabolomic response of S. officinalis to salinity is modulated by environmental conditions and the intensity of salt stress [8, 31].
This study demonstrated a significant reduction in chlorophyll content — particularly chlorophyll a (Chl a) — in response to increasing salinity, which agrees with previous findings in other crop species [1, 9, 32]. Under 200 mM NaCl, Chl a levels declined by up to 50%, highlighting its sensitivity to salt-induced oxidative stress and impaired photosynthetic function [9, 33]. The accumulation of Na⁺ and Cl⁻ ions can disrupt pigment homeostasis and contribute to the overproduction of reactive oxygen species (ROS), damaging thylakoid membranes and interfering with chlorophyll biosynthesis [34, 35]. In contrast, chlorophyll b (Chl b) content remained largely unaffected, possibly due to its peripheral role in light-harvesting complexes and comparatively lower susceptibility to oxidative damage [36, 37]. Similarly, carotenoid levels remained stable under salinity stress, consistent with prior studies [38, 39], suggesting a role in maintaining pigment balance and photoprotection. The unchanged chlorophyll-to-carotenoid ratio across treatments may reflect an adaptive strategy to preserve light-harvesting efficiency and oxidative balance, as previously observed in Triticum aestivum [40]. Anthocyanin content also remained stable, in agreement with studies reporting limited salinity-induced variation in these secondary pigments [41].
Salt stress also induced oxidative stress responses, as indicated by elevated levels of hydrogen peroxide and lipid peroxidation in S. officinalis leaves. A time-and salt dose-dependent increase in H₂O₂ was observed, with the highest accumulation occurring under mild salt stress (25-50 mM NaCl), possibly reflecting an early signaling or defense response [42, 43]. At moderate levels (100 mM NaCl), H₂O₂ levels plateaued, whereas higher concentrations (150 and 200 mM) triggered renewed accumulation. This biphasic response may indicate a transient acclimation phase and enhanced oxidative damage at higher stress levels [44]. As measured by MDA content, lipid peroxidation also increased with salinity, peaking under 150 mM NaCl. A slight reduction in MDA at 200 mM NaCl suggests either a suppression of metabolic activity or increased membrane damage, impairing further peroxidation [45- 48].
A marked accumulation of osmolytes — specifically free proline and total soluble sugars — was observed in response to salinity. These compounds contribute to osmotic adjustment and protection against oxidative stress [49]. Proline levels increased significantly with both salt concentration and exposure duration, particularly under 150 and 200 mM NaCl, indicating a strong stress-adaptive response [50-52]. Although the exact molecular pathways were not assessed, these patterns are consistent with prior findings associating proline accumulation with abiotic stress severity [1, 53, 54]. Soluble sugars also showed moderate increases under salinity, though to a lesser extent than proline, suggesting a supportive role in osmoprotection and carbon storage [30, 55, 56].
This study also evaluated the effects of salt stress on total flavonoid content and total phenolic content, two key indicators of non-enzymatic antioxidant capacity. Under mild to moderate salinity (25-100 mM NaCl) and short-term exposure, both TFC and TPC were significantly elevated, suggesting activation of antioxidant defenses. Flavonoids, well-documented for their ROS-scavenging activity, increased significantly after 2-8 days of treatment, particularly at lower salt concentrations, indicating an upregulation of flavonoid biosynthesis as an early stress response [57]. These findings align with studies that show mild abiotic stress enhances secondary metabolite production as part of a protective mechanism [10, 16]. Conversely, the decline in TFC under severe salt stress likely reflects a threshold beyond which antioxidant capacity is compromised.
Similarly, TPC levels increased significantly under low salinity conditions (25-100 mM NaCl) following short-term exposure (2 days), suggesting rapid activation of phenolic biosynthesis to counter initial oxidative stress [29, 58]. However, TPC levels did not continue to rise under prolonged or severe stress, in contrast to TFC. This differential response indicates distinct regulatory controls governing the biosynthesis of these antioxidant compounds. Further transcriptomic and enzymatic studies are required to elucidate the underlying molecular mechanisms that drive these divergent accumulation patterns under salinity stress.
Conclusions
This study underscores the significant physiological, biochemical, and metabolic responses of S. officinalis to varying levels of salinity stress. Elevated salt concentrations resulted in a marked decline in Chl a content, while Chl b and carotenoid levels remained relatively stable. This suggests an adaptive mechanism aimed at preserving photosynthetic efficiency under stress conditions. The accumulation of oxidative stress markers — such as hydrogen peroxide and lipid peroxidation products — followed a biphasic pattern, indicating the initial activation of antioxidant defenses at moderate salinity and a reduced capacity to mitigate ROS at higher stress levels.
The levels of osmoprotectants, particularly proline and soluble sugars, increased in a concentration- and time-dependent manner, highlighting their critical roles in maintaining cellular osmotic balance. Among these, proline emerged as the predominant osmoprotectant, showing a more pronounced accumulation than soluble sugars, thereby reinforcing its function in alleviating both osmotic and oxidative damage. Furthermore, the enhanced accumulation of secondary metabolites, including flavonoids and phenolic compounds, under low to moderate salinity stress suggests their involvement in the antioxidative defense system. However, flavonoid levels declined under severe salinity, likely due to metabolic limitations or resource reallocation under extreme stress conditions. Collectively, these findings demonstrate that S. officinalis employs a multifaceted defense strategy against salinity stress, involving pigment regulation, activation of antioxidant mechanisms, osmoprotectant synthesis, and secondary metabolite production. This integrated response underscores the plant’s resilience and offers valuable insights into its adaptive capacity under saline conditions. These insights could inform future efforts to enhance salt tolerance in medicinal and aromatic plants, with implications for both agricultural sustainability and pharmaceutical applications. Further research is warranted to elucidate the molecular and genetic mechanisms underlying these stress responses and to develop targeted strategies for improving salinity tolerance.

