

Introduction
Soil organic matter (SOM) is a core component of nutrient cycling and energy flow in ecosystems, playing a crucial role in maintaining soil health and supporting ecosystem multifunctionality [1, 2]. In semi-arid mining areas, long-term open-pit mining has led to extensive removal of surface soil and destruction of vegetation, resulting in severe soil degradation, especially the depletion of SOM [3-6]. These disturbances reduce soil structure integrity, water-holding capacity, and nutrient availability, significantly hindering plant root development and reducing vegetation cover and biomass [7, 8]. Simultaneously, the biological functions of the soil are impaired, as evidenced by declines in microbial biomass, enzymatic activity, and diversity during the early stages of reclamation [9, 10]. For instance, studies have demonstrated that reduced SOM decreases soil water-holding capacity and aeration, thereby affecting plant growth and microbial activity [11]. Moreover, the loss of microbial diversity and alteration of their functions further undermine the recovery capacity of soil ecosystems [12-14].
Microbial metabolism, including processes such as organic matter decomposition, CO₂ fixation, and respiration, plays a central role in the transformation and stabilization of SOM, especially in degraded ecosystems such as opencast coal mining areas [15]. In these regions, extensive excavation and topsoil removal cause severe disruption of soil structure and fertility, leading to the depletion of SOM and degradation of microbial habitats [16, 17]. As a result, reclaimed soils in opencast mines often exhibit low microbial metabolic activity and inefficient carbon turnover, even after vegetation has been re-established. This delayed recovery of microbial function – manifested in reduced carbon substrate utilization and enzyme activity – poses a major challenge to the restoration of soil ecological processes [18]. The accumulation and stabilization of soil organic carbon (SOC) in such disturbed systems depend largely on the structural and functional restoration of microbial communities, making microbial carbon metabolism a critical indicator of reclamation success [19].
Soil bacteria, as key drivers in soil ecosystems, play a crucial role in decomposing organic matter, transforming nutrients, and regulating the soil carbon cycle [20]. Their carbon metabolic capabilities directly impact the fixation and release of organic carbon in the soil, thereby influencing the carbon balance and stability of the entire ecosystem [21]. However, existing research primarily focuses on changes in soil microbial diversity under reclamation models of pure or mixed forests, with limited exploration of the relationship between soil bacterial carbon metabolism and organic matter content [22-24]. Therefore, investigating changes in the carbon metabolic capacity of soil bacteria across different gradients of organic matter is essential for understanding the mechanisms of soil ecosystem recovery in mining areas and guiding effective reclamation. By elucidating how soil bacterial carbon metabolism responds to gradients of organic matter, we can better evaluate reclamation outcomes and promote comprehensive recovery and sustainable management of mining ecosystems.
This study established five SOM gradient levels (1.1%–3.5%) based on previously published field data from reclaimed plots at different restoration stages in the Pingshuo opencast coal mine. These treatments reflect the natural range of SOM concentrations observed over successive reclamation years and thus represent realistic ecological restoration conditions in this semiarid mining region [25–29]. Through a microcosm experiment, we utilized metagenomic sequencing and biochemical analysis to systematically compare changes in soil bacterial community structure, expression levels of carbon metabolism-related genes, and activities of soil carbon-metabolizing enzymes under different SOM gradients. The specific objectives of this study are: (1) To reveal the impact of different organic matter gradients on bacterial communities. (2) To elucidate the effects of different organic matter gradients on the soil bacterial carbon metabolism. (3) To uncover the mechanisms by which soil bacterial carbon metabolism responds to changes in organic matter gradients.
Materials and Methods
Microcosm Experiment
The study area is located in the Ping-shuo open-pit mining district of Shanxi Province (112°10′-113°30′E, 39°23′-39°37′N), which is one of China’s large-scale open-pit coal mines (Fig. S1). After nearly three decades of land reclamation and ecological restoration, significant improvements have been made to the ecological environment of the mining area [30]. Soil samples were collected from a depth of 0-20 cm within the mine area. The samples were sieved through a 2 mm mesh to remove impurities, thoroughly mixed, and stored in self-sealing bags. A portion of the soil samples was preserved at 4°C, while another part underwent air-drying. The measured organic matter content of the collected soil was 1.4%. Soil organic matter (SOM) was determined using the K₂Cr₂O₇-H₂SO₄ oxidation method.
We referred to the SOM content in reclaimed areas of different restoration ages at the Ping-shuo open-pit coal mine and established five SOM gradient levels: 1.1%, 1.4%, 2.0%, 2.5%, and 3.5%. To prepare soils with these five SOM gradients, exogenous organic matter and sterilized river sand were used. The exogenous organic matter was purchased from Zhonghe Agriculture (Jiangsu, China), and the river sand was collected from the study area. The sand was first sieved through a 2 mm mesh and then autoclaved at high temperature for 2 hours to eliminate any indigenous microorganisms. The preparation method is detailed in Table S1.
Initially, the air-dried soil was autoclaved at 121ºC for 30 minutes in three consecutive rounds, each separated by a 3-day incubation interval to eliminate residual microbial activity. Following this, varying proportions of exogenous organic matter and river sand were added to the sterilized soil to prepare potting mixtures with SOM contents of 1.1%, 1.4%, 2.0%, 2.5%, and 3.5%, and the experimental treatments were labeled as S1, S2, S3, S4, and S5. Each treatment was replicated three times. To prepare soil suspensions, 120 g of fresh soil was mixed with 300 ml of sterile distilled water. The resulting soil suspension was inoculated into the sterilized soils with different SOM contents for microbial strain inoculation. The pots were placed in a greenhouse maintained at 25ºC, where disinfected water was added as needed to maintain the soil moisture content of 60%. After a six-week incubation period, the soil samples were stored at 4ºC for further analysis. The main workflow of the experiment is illustrated in Fig. S2.
Bacterial Community Functional Diversity
The functional diversity of the bacterial community, specifically their utilization of carbon sources, was assessed using BiologTM EcoPlates (Biolog Inc., Hayward, CA, USA) as described previously [31]. Briefly, 10 g of fresh soil samples were weighed and mixed with 100 ml of sterile NaCl solution (0.145 mol/l) in a sterile environment. The mixture was covered and shaken for approximately 15 minutes at a speed of 150 r/min. The fresh soil sample was then diluted 100 times and allowed to settle for 10-15 minutes. Subsequently, 150 μL of the suspension was inoculated into Biolog ECO plates and incubated at 25ºC for culture. The optical density (OD) in the wells of the EcoPlates was measured after 144 hours of incubation, when the substrate utilization reached the optimal range. The average well color development (AWCD) was calculated from the OD value for each well, and the McIntosh diversity index was estimated using the method described by Magurran [32].
DNA Extraction and PCR Amplification
Microbial DNA was extracted from 0.25 g of soil using the E.Z.N.A.® Soil DNA Kit (Omega Bio-tek, Norcross, GA, USA) following the manufacturer’s protocol. The V3-V4 hypervariable regions of the bacterial 16S rRNA gene were amplified using primers 338F (5’-ACTCCTACGGGAGGCAGCAG-3’) and 806R (5’-GGACTACHVGGGTWTCTAAT-3’). The PCR program consisted of an initial denaturation step at 95ºC for 3 minutes, followed by 27 cycles of 30 seconds at 95ºC, 30 seconds at 55ºC, and 45 seconds at 72ºC, with a final extension step at 72ºC for 10 minutes. The purified PCR products were quantified according to the manufacturer’s protocol using QuantiFluor® ONE (Promega, Madison, WI, USA).
Illumina MiSeq Sequencing
The products obtained after amplification of the V3-V4 hypervariable region were purified using the Wizard ® SV Gel and PCR Clean-Up System (Promega). The purified amplicons were sequenced on the Illumina MiSeq platform (Illumina, San Diego, CA, USA) following standard protocols by Majorbio Bio-Pharm Technology Co., Ltd. (Shanghai, China).
Processing of Sequencing Data
The raw FASTQ files were filtered by Trimmomatic for quality and combined with FLASH using the following criteria: The operational taxonomic units (OTUs) were clustered at a 97% similarity cutoff using UPARSE (version 7.1, http://drive5.com/uparse/). The RDP Classifier algorithm (http://rdp.cme.msu.edu/) was used to analyze the classification of each 16S rRNA gene sequence against the Silva (SSU123) 16S rRNA database.
Functional Gene Prediction
The film-forming potential of bacteria was determined using the BugBase tool [33] for functional prediction. The closed reference method of QUIME2 was used to group the 16S rRNA sequences into operational taxonomic units (OTUs). The OTU table produced was imported into PICRUSt, and the content of functional genes associated with carbon metabolism was predicted by the Kyoto Encyclopedia of Genes and Genomes (KEGG) [34].
Statistical Analysis
Bacterial diversity was characterized for each treatment by calculating the Shannon index using the ‘Vegan’ package in R. One-way analysis of variance (ANOVA) followed by Tukey’s HSD test to investigate the effect of different treatments on bacterial diversity indices and carbon metabolism. In order to verify the significance and importance of soil physicochemical factors in bacterial beta-diversity, a linear model based on the Bray-Curtis distance matrix was proposed and presented using Canonical Principal Coordinate (CAP) analysis. These analyses, including PCA, were performed with the ordiR2step and the Vegan Package Cap Scale. Furthermore, we conducted a Random Forest (RF) classification analysis to discern the predominant physical and chemical factors influencing soil bacterial abundance and the McIntosh index. In these RF models, physical and chemical factors were employed as predictors. The significance of these indices was measured by the percentage increase in Mean Squared Error (MSE); a higher percentage increase in MSE suggested that the variables were more important. 5,000 permutations of the response variable were used to determine the robust and cross-validated R2 values. The analysis was conducted in R (3.0.2) using the RANDOMFOREST package [35]. Spearman’s correlation analysis was used to explore the relationships between carbon sources, bacterial communities, and the film-forming potential of bacteria. Structural equation models (SEMs) were constructed to explore the direct and indirect effects of all related variables on bacterial carbon metabolism capacity using the maximum likelihood estimation method.
Results
Soil Chemistry Under Varying SOM Levels
The pH was significantly higher in S1 (Table 1; P<0.05). Total nitrogen (TN) and available phosphorus (AP) increased with the rise in organic matter content, whereas ammonium nitrogen (NH4+-N) and total potassium (TK) showed no significant changes across the five treatments (Table 1). Nitrate nitrogen (NO₃⁻-N) and total phosphorus (TP) were significantly highest in treatments S3 and S5, respectively (Table 1). Additionally, available potassium (AK) was lower in treatment S2 compared to other treatments (Table 1; P<0.05).
Table 1.
The chemical properties of soils with different organic matter content.
Effect of Organic Matter on the Bacterial Community
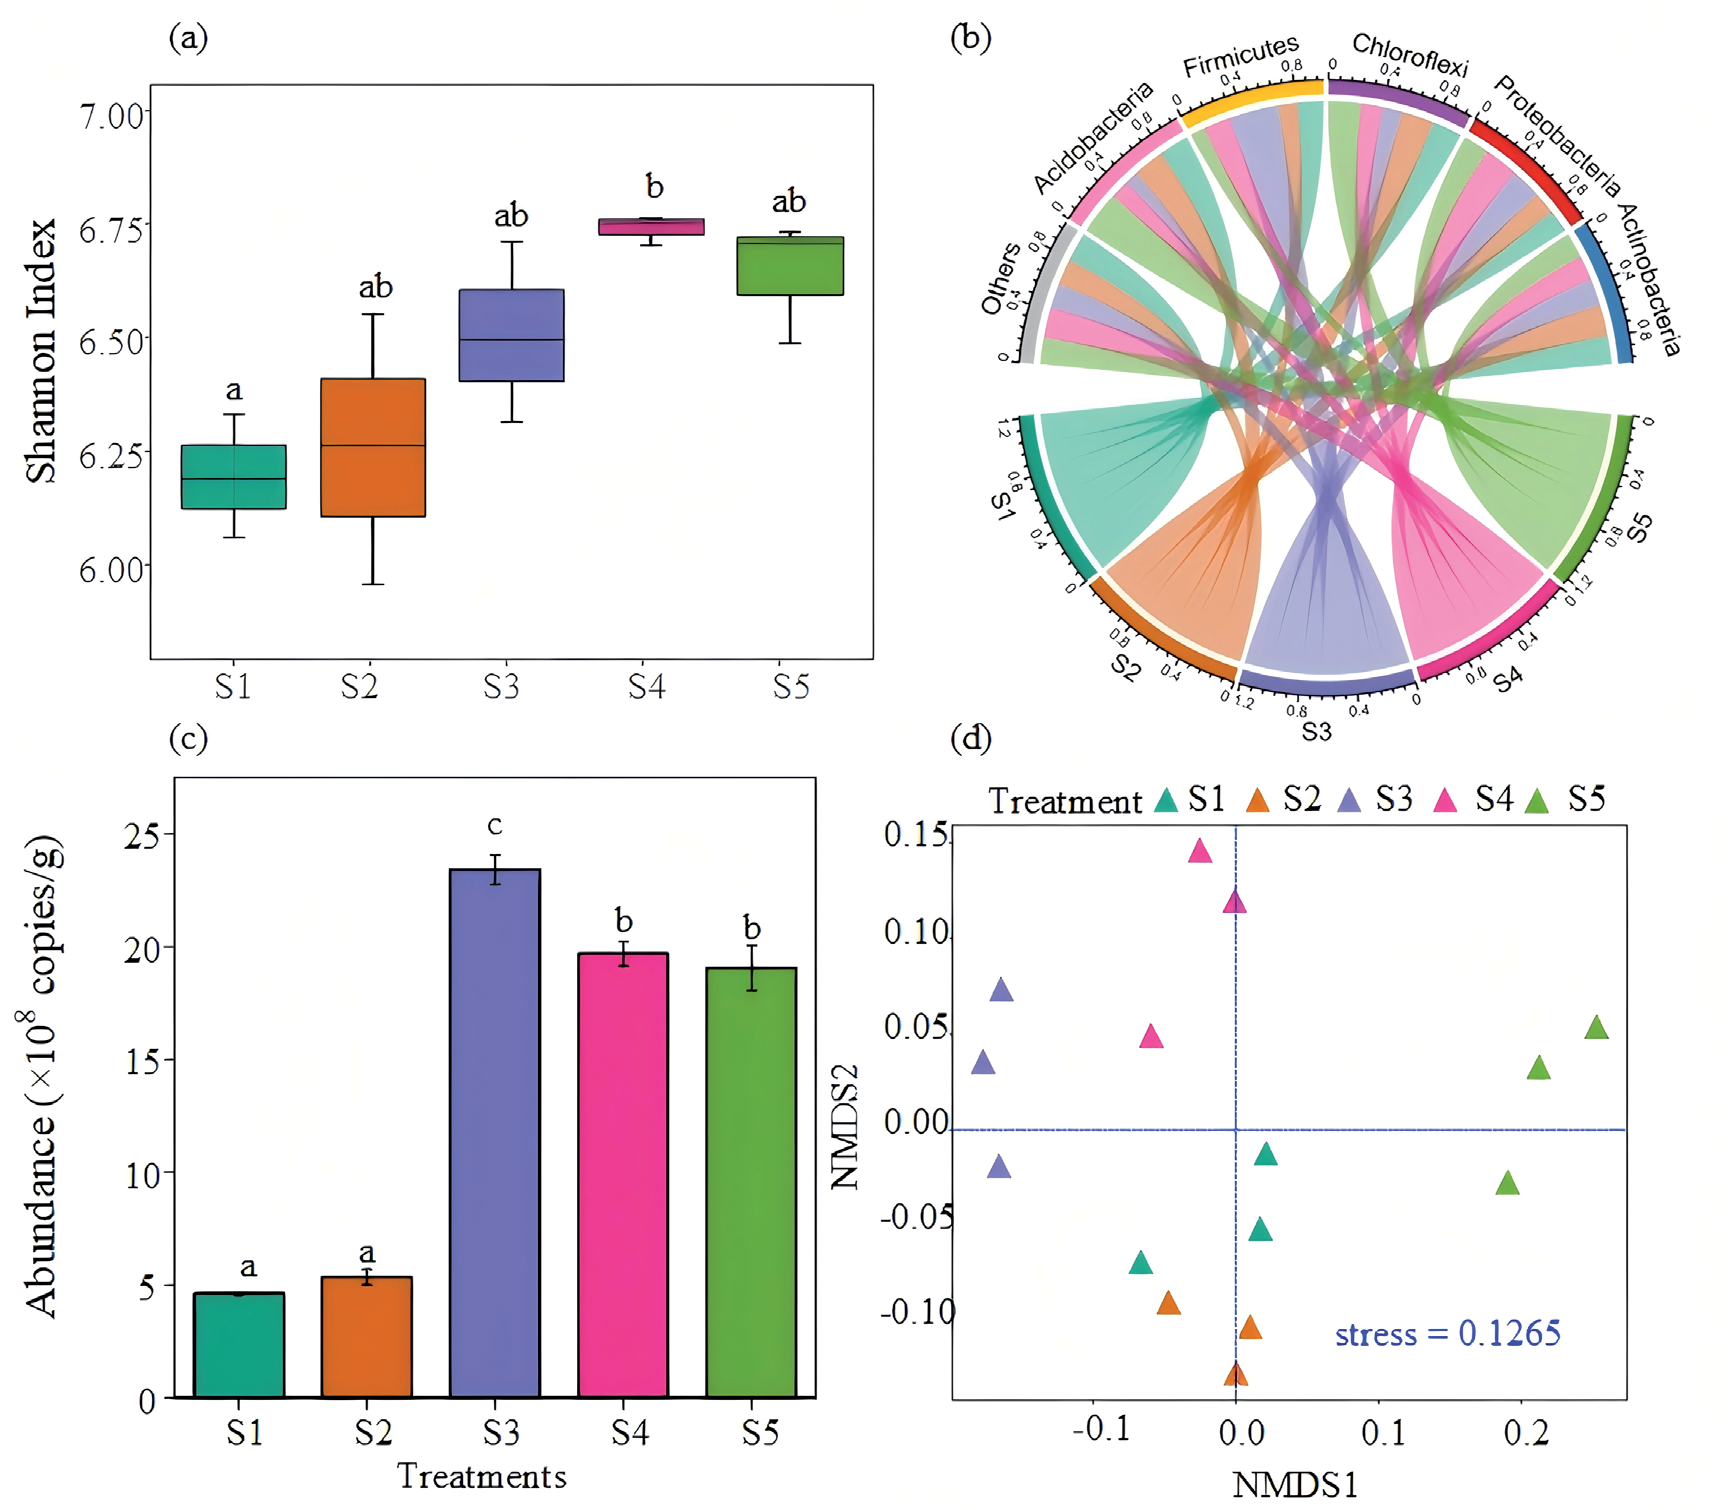
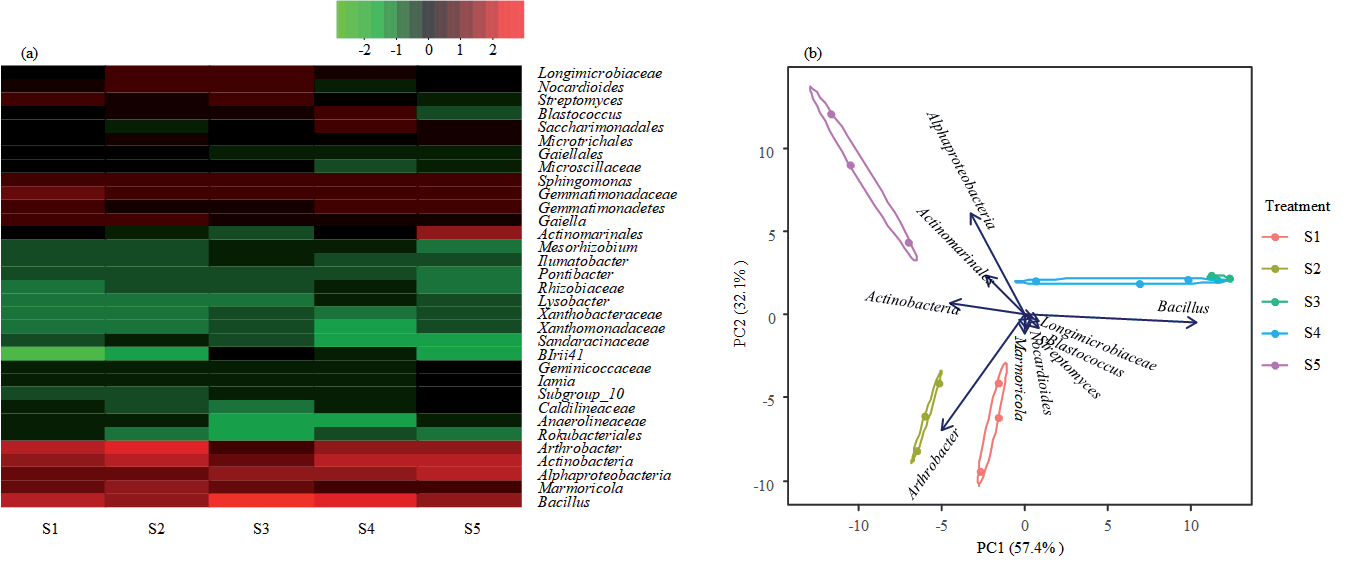
One-way ANOVA and Tukey’s HSD test were used to compare the abundance of 16S rRNA genes in soil samples containing five different levels of organic matter (Fig. 1c). Bacterial abundance significantly increased in treatments S3, S4, and S5 (P<0.05). These organic matter concentrations (2.0%, 2.5%, and 3.5%, respectively) also corresponded with a significantly higher (P<0.05) Shannon index of alpha diversity (Fig. 1a), with the highest index observed in treatment S4 (P<0.05; Fig. 1a). β-diversity was assessed using non-metric multidimensional scaling (NMDS) based on Bray–Curtis dissimilarity, which revealed substantial variations in bacterial community composition among the five soil types (Fig. 1d). Community composition profiling based on relative abundance revealed that 99.18% of bacterial sequences from all samples could be classified into 27 phyla. Among these, Actinobacteria, Proteobacteria, Chloroflexi, Firmicutes, and Acidobacteria were the dominant phyla, collectively accounting for more than 80% of all sequences (Fig. 1b). The genus Bacillus, along with the genera Arthrobacter and Marmoricola and members of the classes Actinobacteria and Alphaproteobacteria, were among the most abundant at the genus level. As organic matter content increased, the relative abundance of Arthrobacter, a major genus within the class Actinomycetes, decreased from 13.81% to 9.26%, while that of Alphaproteobacteria rose from 4.94% to 9.92% (Fig. 2a). Based on principal component analysis (PCA), Actinobacteria clustered close to Alphaproteobacteria, indicating a strong correlation between these two genera (Fig. 2b).
Effect of Soil Organic Matter on Bacterial Carbon Metabolism
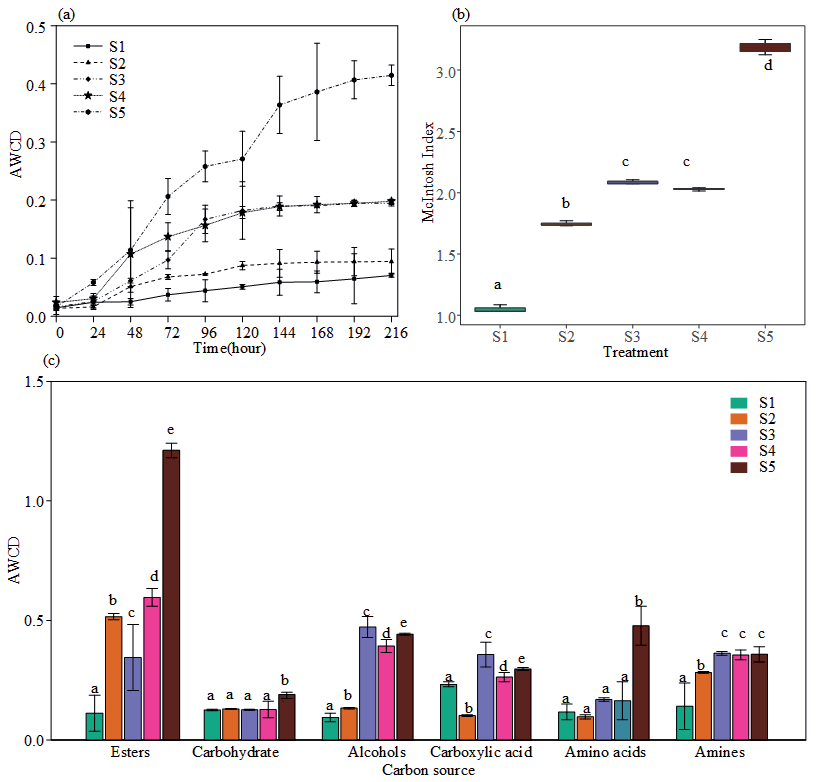
Carbon substrate utilization, assessed here using BiologTM EcoPlates, showed that soil organic matter modified the metabolic potential of the bacterial community (Fig. 3a). The elevated average well color development (AWCD) values observed in S5 (Fig. 3a) suggest that the bacterial communities in soils with 3.5% organic matter exhibited enhanced metabolic activity and more efficient utilization of carbon substrates. To further compare catabolic diversity between treatments, the McIntosh index (U) was calculated after 144 hours of incubation (Fig. 3b). Both the AWCD and McIntosh indices were significantly higher in treatments S3, S4, and S5 (Fig. 3b), indicating a positive correlation between organic matter content and microbial metabolic potential. Carbon sources in the BiologTM EcoPlates were categorized into six major groups: amines, amino acids, carboxylic acids, esters, alcohols, and carbohydrates, to evaluate substrate uptake strategies by the soil microbiome (Fig. 3c). Treatment S5 demonstrated the most effective utilization of all carbon sources, particularly for esters and amino acids (Fig. 3c). In contrast, carbohydrate utilization remained relatively consistent across different levels of organic matter content (Fig. 3c).
Effect of Soil Organic Matter on Bacterial Organic Carbon Decomposition Potential
To further assess the carbon metabolism potential of bacterial communities in soils with varying organic matter contents, PICRUSt was employed to predict the abundance of functional genes involved in carbon metabolism using the KEGG database. 10 specific genes (e.g., beta-galactosidase, beta-glucosidase, alpha-galactosidase, etc.) coding for EC: 3.2.1.-, which represent soil organic carbon decomposition, responded significantly to organic matter contents in soil; detailed information of enzymes is provided in Table S3 (Fig. S3). In S3 and S4, the gene abundance of beta-glucosidase (EC: 3.2.1.21), which breaks down beta-D-glucoside, cellobiose, or cellodextrin into D-glucose, was significantly lower (Fig. 4a). Meanwhile, the gene abundance of beta-glucosidase was significantly negatively correlated to NO3--N, Firmicutes, and Proteobacteria, but positively with Acidobacteria and Chloroflexi (Fig. 4b). α-Amylase (EC 3.2.1.1) had significant positive relationships with pH and Actinobacteria (Fig. 4b). Notably, the abundance of the gene for 6-phospho-beta-glucosidase (EC: 3.2.1.86), a cellobiase that degrades cellobiose 6’-phosphate to D-galactose, was significantly lowest in treatment S4, followed by S3 (P<0.05; Fig. 4a). This enzyme’s gene abundance was significantly correlated with total N, total P, available P, total K, pH, Actinobacteria, and Proteobacteria (Fig. 4b). Additionally, chitinase (EC: 3.2.1.14), which degrades chitin to chitobiose or N-Acetylglucosamine, had significant correlations with dominant bacterial phyla, available P, pH, and NO3--N (P<0.05; Fig. 4b). Furthermore, analysis using the BugBase tool revealed an increase in the relative abundance of biofilm-forming bacteria with increasing soil organic matter content (Fig. 4c).
Fig. 1.
Bacterial diversity and community composition in soils with different organic matter contents. a) Boxplots of the Shannon index of the bacterial community in soils with different organic matter content. b) A circos plot showing the taxonomic distribution of soil bacterial taxa in soils with different organic matter contents at the phylum level. c) The abundance of the bacterial community in soils with different organic matter content. d) β-diversity was analysed by non-metric multi-dimensional scaling (NMDS) based on Bray-Curtis distance metrics at the OTU level and is displayed as a scatter diagram. S1, S2, S3, S4, and S5: soils with 1.1, 1.4, 2.0, 2.5, and 3.5% organic matter, respectively. Labels with different letters denote significant differences in median values among sites (P<0.05).
Relationship Analysis
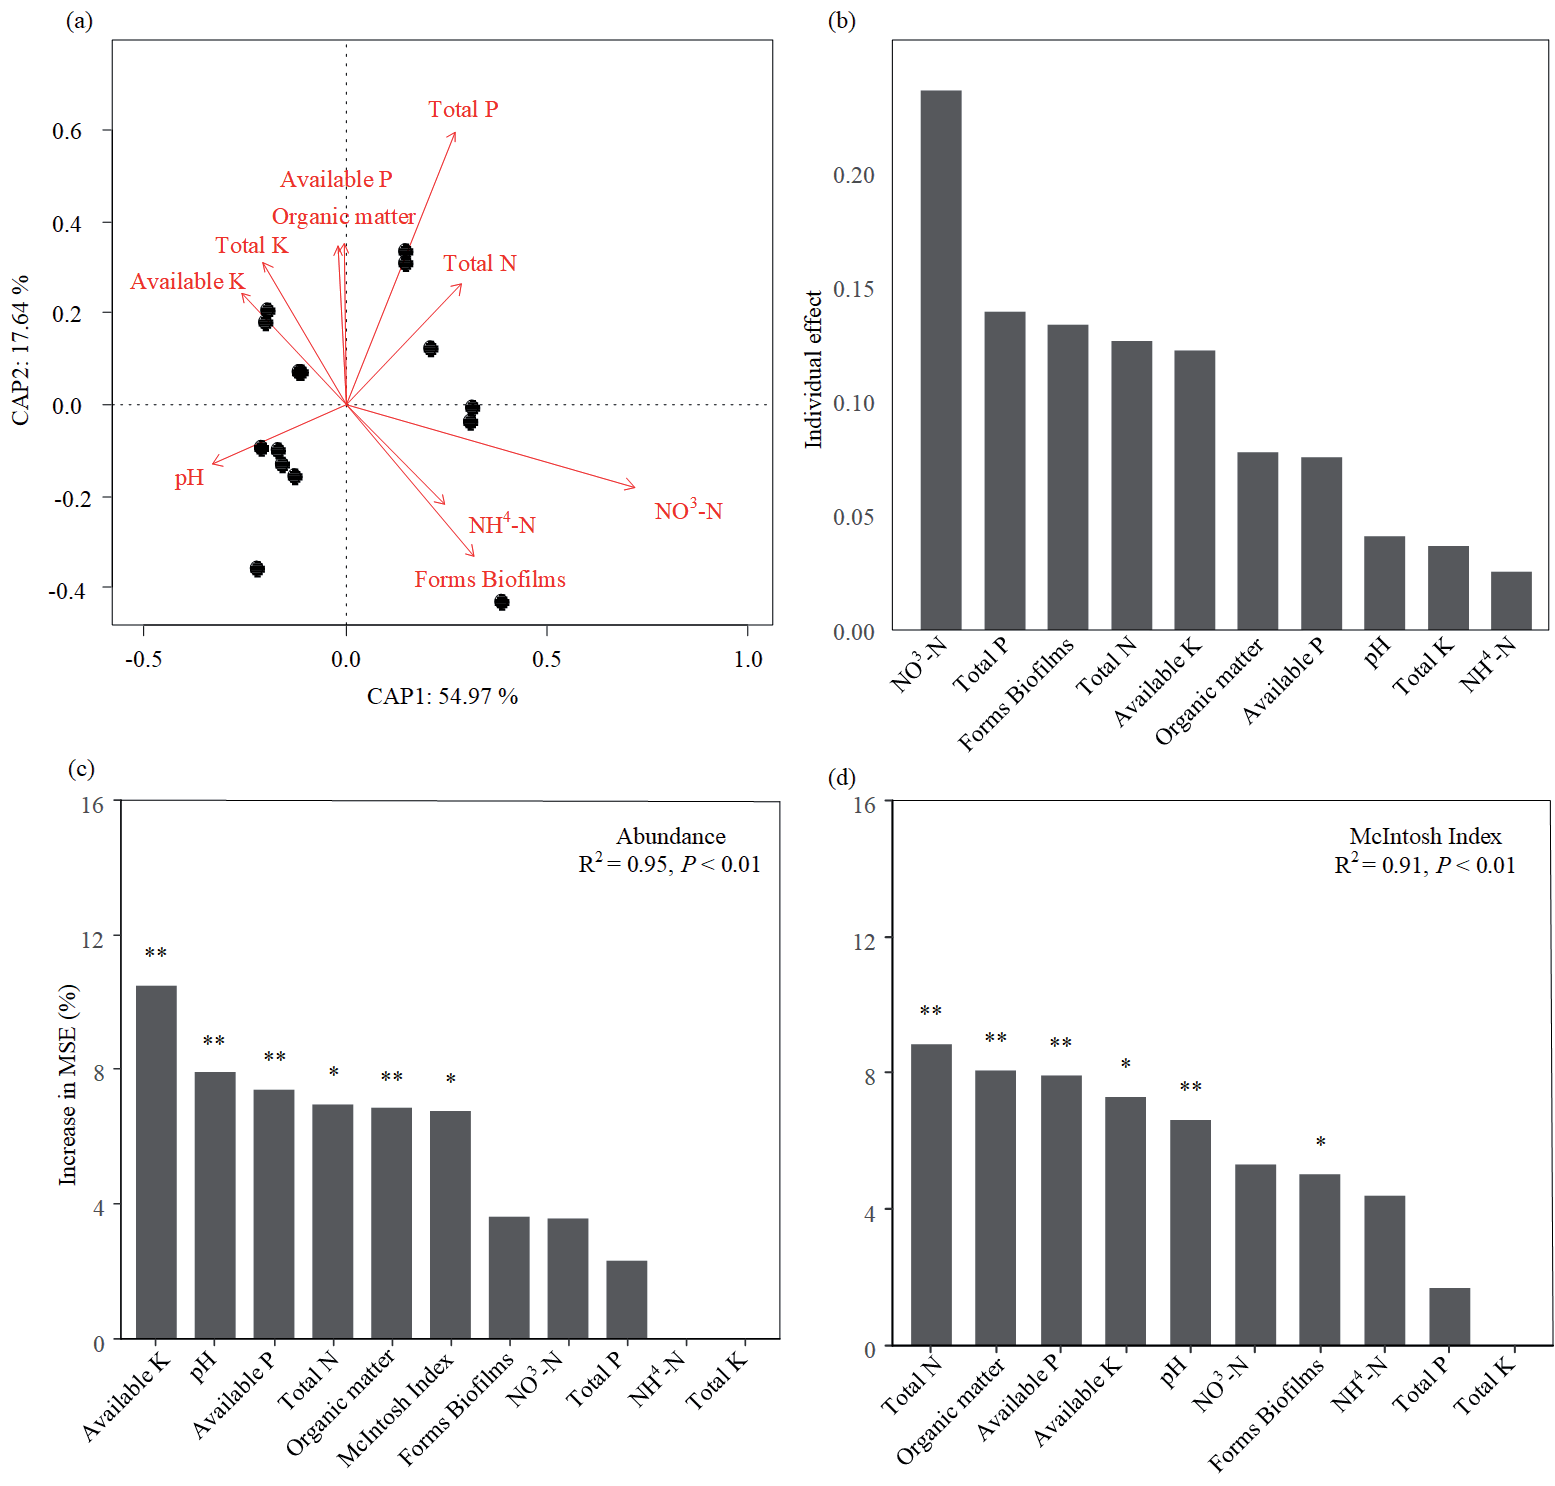
The majority of dominant bacterial genera exhibited a significant correlation with the six types of carbon sources and bacterial functional diversity mentioned above (P<0.05; Table 2). Arthrobacter correlated negatively with the McIntosh index (U), Shannon diversity (E), biofilm formation, and the presence of alcohols, carboxylic acids, and amines (P<0.005). Alphaproteobacteria and Actinomarinales correlated positively with the McIntosh index (U), Shannon diversity (E), esters, carbohydrates, and amino acids (P<0.05). Finally, the McIntosh index (U) and Shannon diversity (E) correlated positively with α-diversity, abundance, and biofilm formation potential of bacteria (P<0.05). In addition, the influence of soil physics and chemistry on the beta-diversity of bacteria was identified by using the CAP. Among the major environmental factors contributing to β-diversity, NO₃⁻-N was the most significant, followed by total P (Fig. 5a, b). Indicating that NO₃⁻-N and total P had a strong effect on driving the β‐diversity of soil bacteria. Conversely, the Random Forest Model hasn’t identified NO₃⁻-N and total P as the main predictors of bacterial abundance and the McIntosh index (Fig. 5b, d). The results of the Random Forest Model indicate that available K, pH, available P, total N, and organic matter were the main predictors of both bacterial abundance and the McIntosh index (Fig. 5c, d).
Fig. 2.
Shifts in bacterial genera in soils with different organic matter content. a) Heatmap of major bacterial genera (> 0.1% abundance). b) PCA of bacterial community structure at the genus level. Arrows represent the ten most abundant genera (i.e., top ten median absolute deviations). S1, S2, S3, S4, and S5: soils with 1.1, 1.4, 2.0, 2.5, and 3.5% organic matter, respectively.
Links Between Organic Matter and Bacterial Carbon Metabolism in Soil
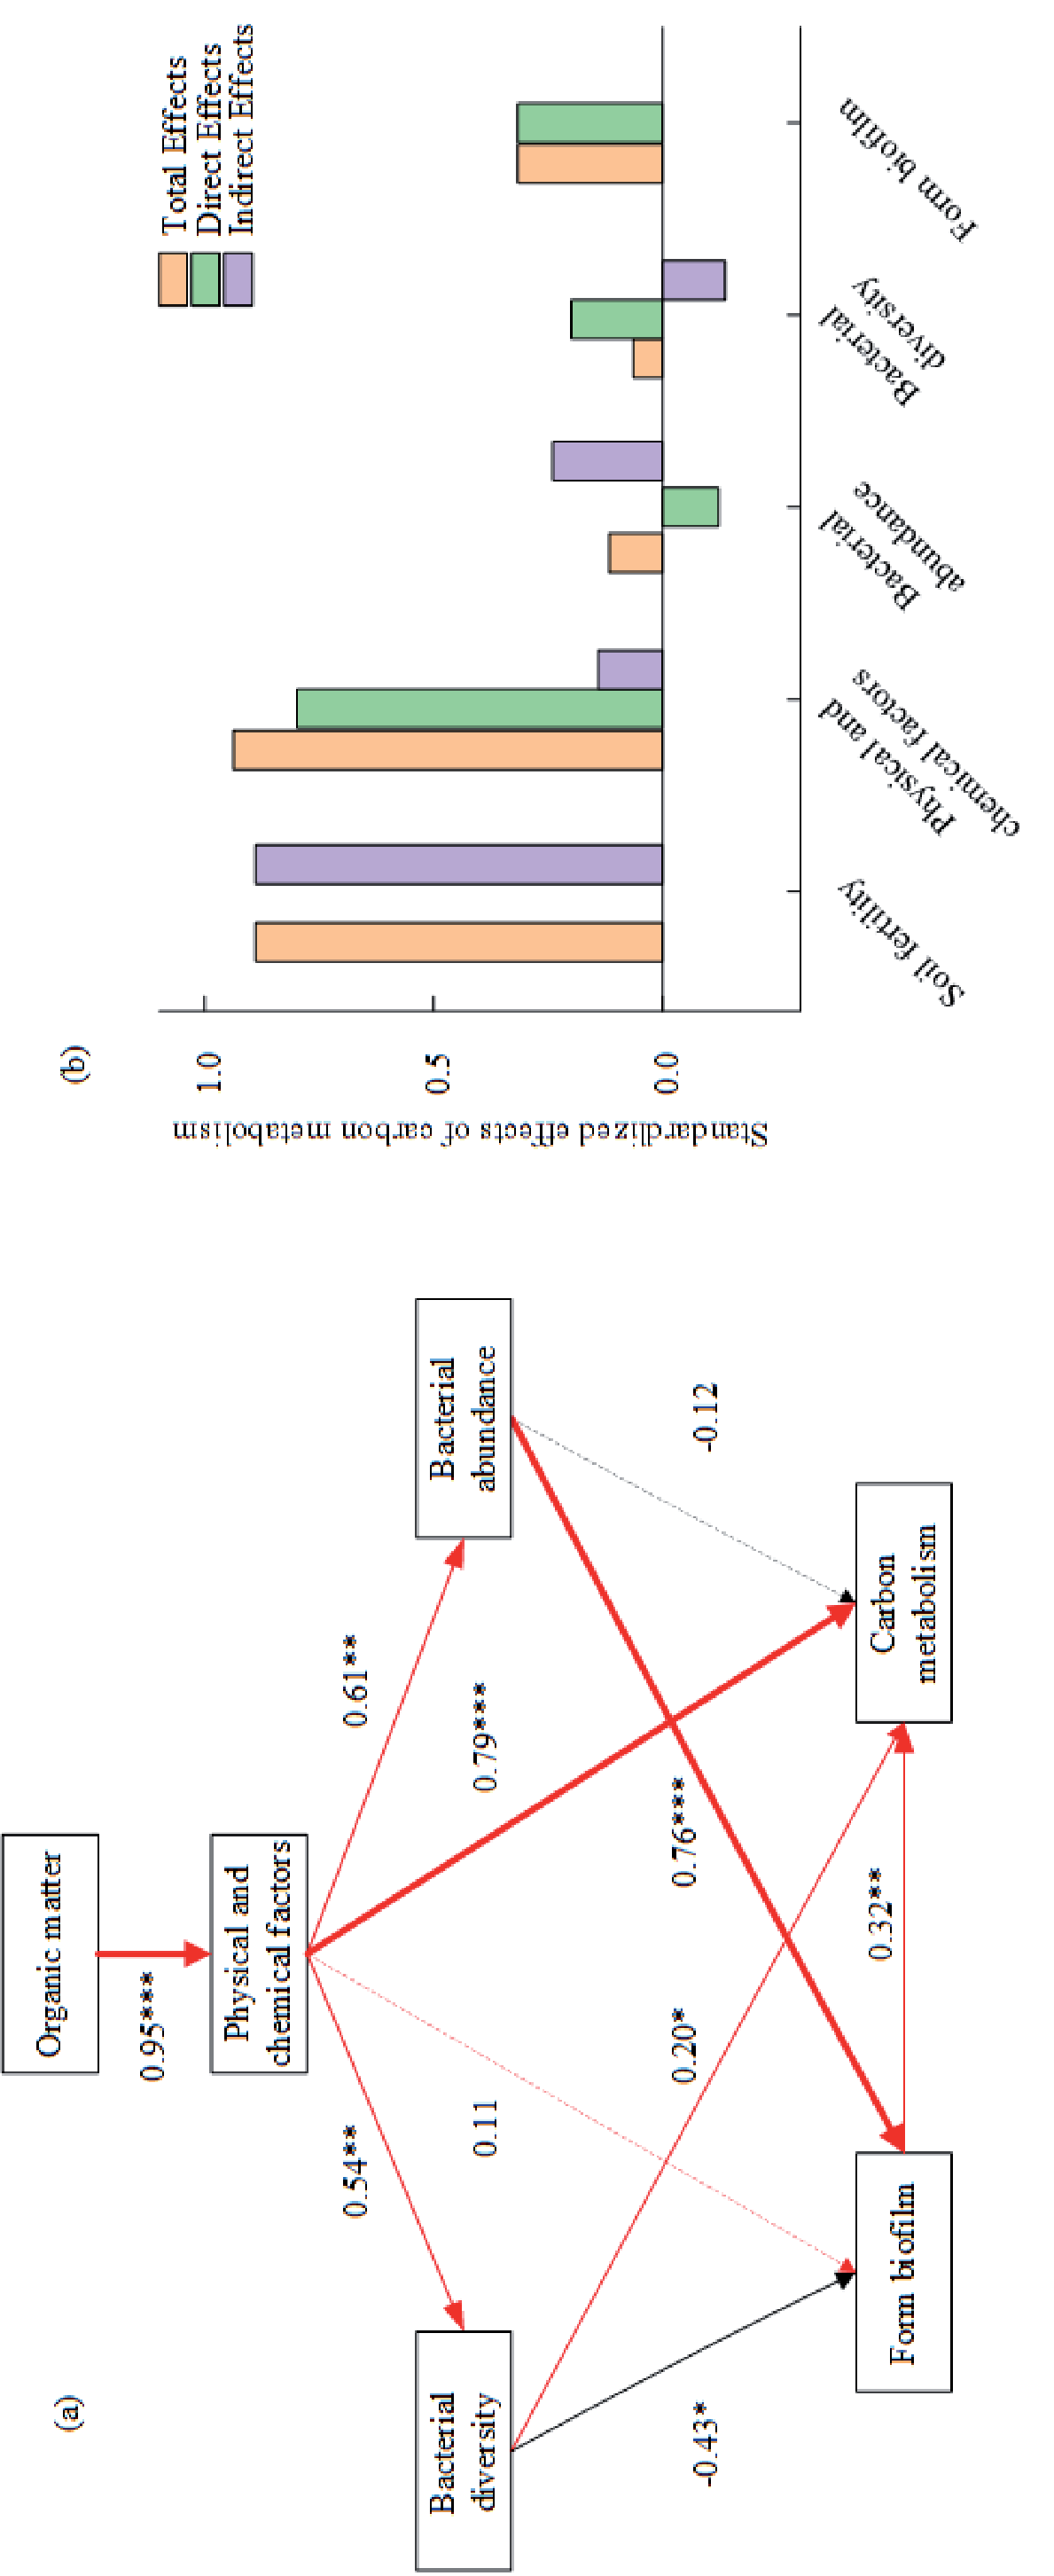
Structural equation modeling (SEM) was employed to investigate the direct and indirect influences of organic matter on bacterial carbon metabolism in soil (Fig. 6). The analysis revealed that organic matter significantly affected both the diversity and abundance of bacteria (P < 0.05). Additionally, a significant correlation was observed between the physical and chemical properties of soil and bacterial carbon metabolism, indicating that organic matter indirectly influenced bacterial carbon metabolism by altering these soil properties. Furthermore, a significant correlation was found between the potential for biofilm formation and bacterial abundance, diversity, and bacterial carbon metabolism (P < 0.05), suggesting that the abundance and diversity of bacteria can impact carbon metabolism through their effect on the abundance of biofilm-forming bacteria. Overall, organic matter was an important driver of carbon metabolism by bacteria in this study.
Discussion
Soil organic matter is important for the maintenance of soil fertility due to its effects on soil physics, chemistry, and biological properties [36, 37]. In this study, bacterial diversity increased significantly with increasing concentrations of soil organic matter (P<0.05; Fig. 1a). Zhang et al. discovered that organic fertilizer could improve the diversity of bacteria in severely saline-alkaline soils by increasing the local concentration of organic matter [38]. These results were confirmed by the significant differences in bacterial community structure observed among soils with varying amounts of organic matter (Fig. 1d). Bacterial biomass was enhanced by higher organic matter content, at least within the optimal growth rate range [39, 40]. Actinobacteria play a crucial role in the decomposition of soil organic matter, particularly macromolecules such as cellulose, hemicellulose, and chitin. This process of degradation releases inorganic nutrients and is an important step in the formation of humus [41]. A significant positive correlation between Actinobacteria and the gene abundance for Chitinase (EC: 3.2.1.14), which degrades recalcitrant carbon (such as chitin to chitobiose or N-Acetylglucosamine), providing further evidence for this result (P<0.05; Fig. 4b, Fig. S3). The positive associations between GH genes and taxa such as Actinobacteria and Alphaproteobacteria suggest that these microbes may facilitate the breakdown of complex carbon compounds under higher SOM conditions. Their correlation with NO₃⁻ and TP further implies a linkage between carbon degradation and nutrient cycling. These patterns underscore SOM’s role in shaping both the structure and carbon-processing functions of soil microbial communities. Meanwhile, Actinobacteria showed a strongly significant and positive relationship with the gene abundance of 6-phospho-beta-glucosidase (EC: 3.2.1.86; P<0.05; Fig. 4b). Cellulose is a complex organic substrate, and the synergy between its different components must be relied upon in the hydrolysis process [42-45]. During the hydrolysis of cellulose, the absence of cellobiase will cause the accumulation of cellobiose and inhibit the hydrolysis of cellulose [46, 47].
Fig. 3.
Assessed carbon substrate utilization in soils with different organic matter contents using Biolog EcoPlates. a) Average well colour development (AWCD) of metabolised substrates in Biolog EcoPlates during a 216-h incubation period. b) Box plot of McIntosh index (U) for bacteria grown in soils with different concentrations of organic matter over a period of 144 h. c) Mean carbon substrate utilisation by bacteria in soils with different organic matter content following a 144-h incubation period. S1, S2, S3, S4, and S5: soils with 1.1, 1.4, 2.0, 2.5, and 3.5% organic matter, respectively. Labels with different letters denote significant differences in median values among sites (P<0.05).
The decrease in the relative abundance of Arthrobacter observed at higher organic matter concentrations (Fig. 2a) suggests that soils poor in organic matter stimulate the growth of Actinobacteria. Changes in the composition of bacteria may be due to competition for organic matter. PCA revealed a strong correlation between Actinobacteria and Alphaproteobacteria (Fig. 2b). The relative abundance of Alphaproteobacteria increased with increasing soil organic matter content (Fig. 2a), confirming the similar results reported by Blanchet et al. [48].
Microbial biomass production efficiency is inherently lower when relying on recalcitrant humic material as a substrate compared to substrates that can be readily degraded [49]. Accordingly, as the content of decomposable organic matter increased from treatments S1 to S5, the metabolic potential of the bacterial community increased. Indeed, land use practices that promote the accumulation of organic matter stimulate bacterial carbon metabolic diversity [50, 51]. Similar results were observed in the present study. The McIntosh index (U) was significantly higher in S3, S4, and S5 (Fig. 3b). Because of the depletion of organic matter, the readily biodegradable fraction is preferentially lost, but the more recalcitrant humic fractions are retained [52]. It would seem reasonable that a soil devoid of sufficient organic matter would support a less metabolically diverse bacterial community. High SOM levels enriched taxa such as Actinobacteria and Alphaproteobacteria, which showed positive associations with the utilization of amino acids and carboxylic acids (Fig. 4). This indicates that SOM-induced community shifts may drive functional differentiation in carbon metabolism, with specific taxa favoring distinct substrates. To identify the main drivers of microbial shifts, CAP analysis * P<0.05, ** P<0.01. indicated that pH, TP, NO₃⁻-N, and biofilm-forming bacteria significantly shaped community structure (Fig. 5a). Random Forest further highlighted these factors as key predictors of bacterial abundance and metabolic diversity (Fig. 5b–d). While CAP captured compositional gradients, RF prioritized functional relevance. Together, they suggest that SOM influences microbial functions by modifying soil properties and enhancing biofilm formation.
Fig. 4.
Effect of soil organic matter on bacterial enzymes involved in carbon metabolism. a) The abundance of dominant enzymes (top 10) involved in organic carbon degradation in soils with different organic matter contents. The color and size of the bubble are proportional to the P-value and relative abundance of each enzyme, respectively. b) Spearman correlations between the relative abundance of specific genes coding for glycoside hydrolases (EC:3.2.1.-) and soil physicochemical factors and dominant bacterial phyla (top 5). Labels with different letters denote significant differences in median values among sites (P<0.05). The P-values of <0.05 adjusted by FDR correction were presented. “*” P<0.05; “**” P<0.01; “***” P<0.001. c) Box plot of biofilm-forming bacterial relative abundance. Box plots illustrate the 25th, 50th, and 75th percentiles; whiskers indicate the 10th and 90th percentiles. S1, S2, S3, S4, and S5: soils with 1.1, 1.4, 2.0, 2.5, and 3.5% organic matter, respectively.
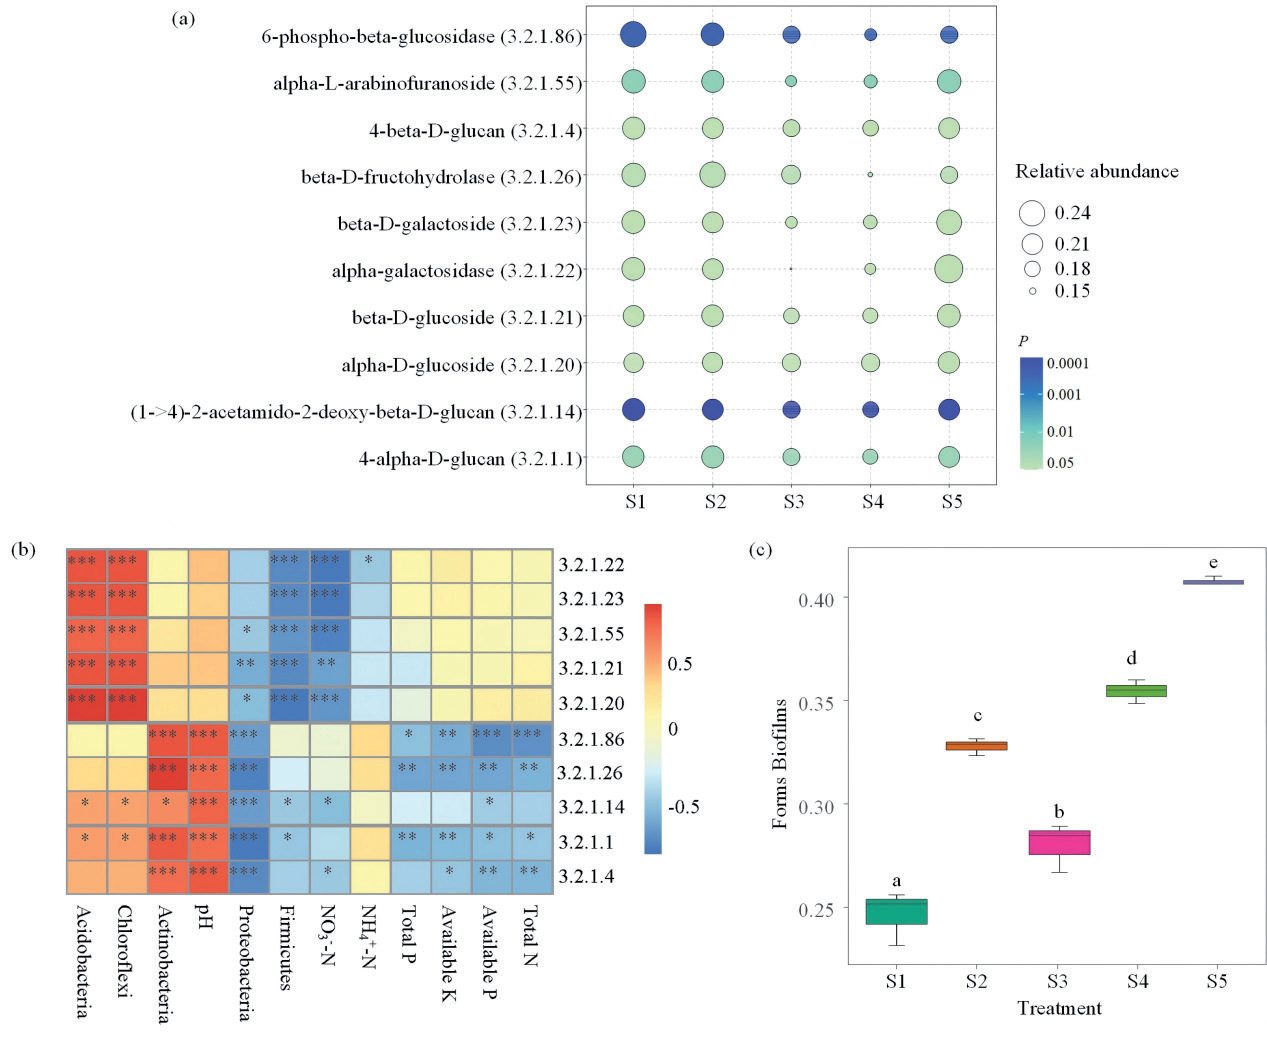
Table 2.
Pearson’s correlation analysis between six types of carbon sources, bacterial abundance, community diversity, functional diversity, and major bacterial genera in soils with different amounts of organic matter.
Fig. 5.
The effect of physical and chemical factors of soil on bacterial community, abundance, and McIntosh index. (a, b) Constrained analysis of principal coordinates (CAP) showing physical and chemical factors of soil that influenced the bacterial community. (c, d) Random Forest analyses identify the most influenced physical and chemical factors of soil on bacterial abundance and the McIntosh index. The predictors include the pH, Total N, NH4 + -N, NO3 - -N, Total P, Available P, Total K, Available K, and organic matter contents. * P<0.05, ** P<0.01.
In natural environments, it is estimated that over 99% of bacteria reside in biofilms. A sessile lifestyle provides several competitive advantages over free-living cells. The development of biofilms also affects the physical and chemical properties of the soil [53, 54]. In this study, the relative abundance of biofilm-forming bacteria was found to increase with higher soil organic matter content, confirming previous results by He et al., who reported that high nutrient input induced biofilm formation. Bacillus and Paenibacillus are major contributors to soil biofilm formation [55, 56]. At the genus level, Bacillus was the main bacterial species in the soil. Its dominance rose further in treatments S3 and S4 but decreased under high-nutrient conditions (Fig. 2a).
Biofilm formation is widely recognized as a driver of microbial community diversity in both natural and engineered environments [57]. In this study, it was positively and significantly correlated with the McIntosh and Shannon indices (Table 2), indicating enhanced microbial richness and evenness. Biofilms create structured microenvironments that facilitate microbial cooperation, resource retention, and tolerance to environmental stress. These features enhance quorum sensing and metabolic complementarity, thereby promoting overall functional diversity. Previous research has shown that diverse bacterial communities improve resource-use efficiency, ultimately supporting soil fertility and ecosystem sustainability [58-60]. In this study, bacterial metabolic activity was clearly influenced by the extent of soil biofilm formation. Furthermore, a significant positive correlation was observed between the biofilm formation potential of bacteria and their carbon metabolism (P < 0.05). After the soil biofilm was formed, the bacterial community with multiple metabolic activities was established. A greater proportion of active microorganisms can accelerate biogeochemical cycles. Organic matter can indirectly affect bacterial carbon metabolism by modifying the abundance of biofilm-forming bacteria. In general, it seems that organic matter plays an important role in bacterial carbon metabolism.
Fig. 6.
Structural equation models showing the direct and indirect effects of fertility, bacterial community, bacterial abundance, and biofilm formation potential on bacterial carbon metabolism in soils with different organic matter content. a) Red and black arrows indicate positive and negative relationships, respectively. Solid and dashed arrows indicate significant and non-significant relationships, respectively. Numbers adjacent to arrows correspond to path coefficients, and the width of the arrows is proportional to the P-value. Significance levels are indicated: *P<0.05.Model fit indices: GFI = 0.661, RMSEA = 0.079, χ²/df = 2.14, CFI = 0.921. b) Standardised overall, direct, and indirect mean effects of carbon metabolism on various parameters based on structural equation models.
Our findings regarding the improvement of microbial carbon metabolic activity under increasing SOM conditions in the semi-arid opencast coal mine are consistent with trends reported in similar mining environments. For example, in the Loess Plateau mining areas, studies have also observed that microbial respiration and substrate utilization increased with soil organic matter recovery during reclamation [61, 62]. However, our observed recovery rate of microbial functions appears slower than in some humid-region mines, such as those in southern China, possibly due to limited moisture availability, more severe soil compaction, or lower microbial inoculum sources in semi-arid regions [63, 64]. Additionally, differences in vegetation cover and reclamation strategies, such as topsoil replacement versus natural succession, may further explain the spatial variation in microbial carbon metabolic potential among mining sites. These findings underscore the importance of integrating both abiotic factors, such as moisture, SOM, and soil texture, and biotic factors, including microbial diversity and vegetation types, when evaluating carbon cycling recovery across different mining areas.
Conclusions
This study elucidates the critical role of soil organic matter in the ecological restoration of mining areas, significantly enhancing bacterial diversity and abundance while facilitating bacterial carbon metabolism through both direct and indirect pathways. As the organic matter content increased, the TN and AP levels rose substantially, accompanied by notable changes in pH, NO3--N, and TP under specific treatments. Organic matter significantly enhanced the carbon metabolic potential of bacterial communities, as evidenced by higher average well color development (AWCD) values and McIntosh indices (U). This is particularly evident in the improved utilization efficiency of esters and amino acids. Functional gene predictions indicate significant variations in the abundances of genes related to carbon decomposition, such as β-glucosidase (EC: 3.2.1.21) and 6-phospho-β-glucosidase (EC: 3.2.1.86), which correlate with changes in organic matter content. The relative abundance of biofilm-forming bacteria also increases with the presence of organic matter, highlighting the pivotal role of biofilms in promoting bacterial community diversity and metabolic activity, as well as enhancing carbon metabolic capacity. These findings suggest that biofilms play a crucial role in the ecological functions of soil. SEM analysis further reveals that organic matter indirectly influences carbon metabolic processes by modulating soil physicochemical properties and the abundance and activity of biofilm-forming bacteria. Overall, this research highlights the importance of organic matter as a key driver of soil bacterial carbon metabolism, providing new insights into the restoration mechanisms of soil ecosystems in mining areas and providing a scientific foundation for optimizing reclamation strategies.

