

Introduction
The fact that the effects of global climate changes experienced today have reached undeniable dimensions reveals the necessity of humanity to act collectively. It has made it important to preserve the current state and leave a habitable world for future generations. Countries, especially in limiting the excessive increase in greenhouse gas emissions, support the issue by organizing conventions, protocols, and studies aimed at measures in this direction through international bodies.
For this reason, steps have been taken to reduce carbon dioxide emissions, which have an 80% share of total greenhouse gas emissions [1]. In this context, the Montreal Protocol, dated 1987, is defined as the most successful and first multilateral agreement on the environment [2]. The turning point in terms of being the first global agreement to explicitly address climate change is the “Framework Convention on Climate Change” (UNFCCC), which was opened for signature at the United Nations Environment and Development Conference held in Rio, Brazil, in 1992.
Then, the Kyoto Protocol and the Paris Agreement (2016), which were established as a result of the “Third Conference of Parties” (COP3) held in Japan in 1997, are of great importance. The Kyoto Protocol has required countries to reduce the amount of carbon they emit into the atmosphere to the levels from 1990 [3]. The long-term goal of the Paris Agreement is expressed as keeping the global average temperature increase below 2ºC compared to the pre-industrialization period and as the continuation of global efforts to keep this increase below 1.5ºC [4]. The phenomenon of climate change occurs because of the increase in the amount of greenhouse gas emissions (GHG) due to human activities and changes in the natural greenhouse gas concentration [5]. The IPCC has strongly warned that failure to make “significant and sustained” reductions in GHG emissions will increase irreversible impacts [6]. Gases such as carbon dioxide (CO2), methane (CH4), and nitrous oxide (N2O), which are among the GHGs and originate from humans, have seen serious increases in their amounts since pre-industrial times and are among the main reasons for climate change. The majority of these increases are caused by human activities, such as fossil fuel consumption, improper land use, and agricultural activities [7, 8]. The temperature increases caused by GHGs in the atmosphere depend on factors such as the heat retention properties of the gases, their amount in the atmosphere, and the residence time in the atmosphere [9]. In this sense, knowing the sources of GHGs, the distribution of emissions by sectors, the contributions of different regions and countries to these emissions, and the fluctuations in these emissions are of great importance to the fight against climate change [10]. All greenhouse gases cause climate change, albeit at different rates. However, CO2 emissions are used as a measure of value in the struggle against climate change because of their high percentage density and their direct human origin.
At this point, seas and oceans protect the world from the negative effects caused by climate change by absorbing excess CO2 in the atmosphere [11]. For this reason, the oceans are the part that needs the most work on the climate change problems caused by global warming. It is stated that the absorption rate of CO2 released due to anthropogenic activities in the last twenty years by the oceans has increased to 20%-30% [12, 13]. Because of the large increase in the amount of GHGs, global air and sea surface temperatures have increased over the past century [14].
The most special of these seas is the Mediterranean, considering its socioeconomic and geostrategic location. Indeed, the Mediterranean region has been more affected by global warming than other parts of the world [15, 16]. The average air temperature in the Mediterranean region, which was 14.5ºC at the beginning of the 20th century, increased to 16.5ºC in this period, and the temperature difference between these periods worldwide was 1.2ºC, in addition, the average summer temperature in the Mediterranean has increased by 2.5-3ºC in 120 years [17]. Because the Mediterranean Sea is a closed sea that warms up more easily than the oceans, seawater cools slowly. The Mediterranean Sea accumulates energy because of heating and spreads this energy into the atmosphere. This situation has caused temperature increases, decreased precipitation, and decreased soil moisture content. It even indirectly increased forest fires in Mediterranean countries [18].
For this reason, climate policies that include countries in this region have become even more important. Firstly, the control of exhaust gas emissions in the transportation industry, which has emerged with stricter public pressure, has brought to light the necessity of controlling emissions in all other sectors as well, as the demand for international trade has increased. According to the Global Sustainable Development Report [19] published by the UN on the subject, creating economic growth only by increasing the consumption of material goods is no longer valid at the global level, and if the predictions come true, global material use will increase from 89 gigatons (Gt) to 167 Gt between 2017-2060. Accordingly, it is stated that gas emissions which cause global warming, such as GHGs, will increase. The European Scientific Advisory Board on Climate Change, established by the European Climate Law, has recommended reducing EU emissions by 90-95% by 2040 compared to 1990 levels, based on a science-based assessment that considers both fairness and feasibility. The Board determined the EU’s greenhouse gas emissions budget (i.e. cumulative emissions) for the period 2030-2050, and it recommends keeping it at a limit of 11-14 Gt CO2-eq, in line with limiting global warming to 1.5ºC (this temperature should never be exceeded or only limited and temporarily exceeded) [20].
These limitations are essential to reduce climate risks and achieve a sustainable future. In this context, the importance of EU policies regarding the protection of the environment and natural resources has increased gradually since the 1980s. Currently, EU nomination candidate Türkiye has already harmonized its environmental policies with EU environmental policies. With the process of harmonization with the EU acquis as a stronger motivation and norm, coordination and harmonization studies with the EU in environmental policies have started since COP 2001.
Ultimately, Türkiye became a member of the European Environment Agency in 2003. During the preparation of the UNFCCC, countries that were considered to have historical responsibilities in terms of GHG emissions in the atmosphere and were therefore required to make efforts to reduce emissions were called “developed countries” and were placed in the Annex-I List of the Convention. Among these countries, those with OECD membership are obliged to provide financial and technological support to developing countries and are included in Annex II of the Convention. For this reason, Türkiye, one of the founding countries of the OECD, is included in both Annex I and Annex II [21]. Therefore, in the five countries included in the study, countries have implemented some measures, whether domestic regulations, international agreements, or EU agreements, and their responsibilities and motivations in the titles are the same.
The Climate Change Performance Index (CCPI), which includes these five Mediterranean countries, is an independent monitoring tool for the climate protection performance of countries, published annually since 2005. This index aims to increase transparency in international climate policies and enables the comparison of countries’ climate protection efforts and progress [22]. With this index, the climate protection performance of the EU and 59 countries, which account for more than 90% of global greenhouse gas emissions, is evaluated in four categories: GHG Emissions, Renewable Energy, Energy Use, and Climate Policy [22, 23].
When the current situations of the five Mediterranean countries mentioned were evaluated using this index [22], for the GHG emissions of the countries, Spain, France, and Greece showed medium performance, and Italy and Türkiye showed low performance. Additionally, when compared to other countries evaluated within the scope of this index, Greece ranks 28th and Spain 18th as medium performers, Italy is ranked 44th and France 37th as low performers, and the last was Türkiye, placed 56th among the very low-performing countries. While they show different performances in the other three CCPI categories (renewable energy, energy use, and climate policy) when detailed within themselves, they differ from each other in the policies they follow. Greece shows medium performance in Renewable Energy, high performance in Energy Use, and low in Climate Policy. According to the previous year, change only occurred in Climate Policy. Also, Greece shows good performance in trend indicators in general. Italy shows low performance in Climate Policy and medium in Energy Use and Renewable Energy. Italy imports wood pellets in high quantities for the heating sector mainly. In the transport area, Italy lacks policies for the decarbonization of transportation.
Also, the fossil fuel policies of Italy are going backward. France has medium performance in the Climate Policy, low in Energy Use and Renewable Energy. The renewable energy target of France needs to be three times higher to comply with the Paris Agreement. After failing with the 2020 renewable energy target, France introduced the Renewable Energy Acceleration Bill, which is a legislative package that focuses on production with offshore wind energy. France has extended the life of its two coal plants, delaying the coal exit from 2023 to 2024. The other country is Türkiye. The country has a low performance in Energy Use, medium in Renewable Energy, and very low in Climate Policy. Türkiye for the GHG emissions announced 2053 as the net-zero target date. In four main CCPI categories, Spain shows medium performance. The country updated the National Integrated Energy and Climate Plan in 2023 and proposed a 32% GHG emissions reduction by 2030.
Trade connections between countries are getting closer with the developing globalization effect and contribute to economic development, but this situation brings with it various environmental problems, such as increasing carbon emissions, global warming, and climate change, as mentioned before [24]. Especially developing countries cause negative effects on environmental pollution and carbon emissions, depending on energy, raw material, and consumption needs for commercial needs and economic development [25]. The alarming increase in carbon emissions globally emphasizes the urgency of the transition towards sustainable and low-emission applications especially in industry [26]. In this context, all countries are responsible for reducing the carbon emissions they cause, and various studies are being conducted to evaluate this situation [27, 28].
One of the main determinants of this emission inventory of countries is the international movement of goods produced [29] in that country and sent abroad or transferred from another country to that country for various reasons, such as welfare. In this study, the effect of container volume, which is concrete evidence of consumption-based commercial goods movements and foreign trade inputs, on CO2 emissions was investigated. The study focused on 5 countries that are commercially and geographically close to each other in the Mediterranean, which is one of the regions most affected by global climate change. Because recently, it is understood that in addition to global scale enterprises, small and medium-sized enterprises have also turned to container transportation for the import and export of raw materials, semi-finished products, and final products. And, The Mediterranean Region, which hosts these commercial attraction centers, is also one of the most important maritime trade areas where container trade takes place.
Data and Method
In this study, while the effect of container volume on CO2 emissions was investigated, the cointegration relationship between the container volume handled and carbon emissions was examined. For this reason, panel data analysis, that is, a method for estimating economic relations using cross-sectional data of the time dimension, was used for the established econometric model. As an advantage over time series, more data was developed by considering five countries. The results were evaluated with a homogeneity test, horizontal cross-section dependence test, unit root test, Westerlund cointegration test, AMG panel-based prediction, and the Dumitrescu Hurlin panel causality test. The existence of cross-sectional data dependency can be explained as positive or negative shocks occurring in one country, while also affecting other countries. Accordingly, the relationship between the increase and decrease in container handling volume and the carbon emission level will help understand the role of these activities in the sample of Mediterranean countries.
Theoretical Framework and Data Descriptions
This article examines whether there is a relationship between container handling volume in TEU (20 Foot Equivalent Units) and CO2 emissions of France, Greece, Italy, Spain, and Türkiye, which are located in the Mediterranean region and have an important place in world maritime trade in terms of container handling, based on annual data in the period between 2000-2019 with using panel data econometrics. These data, which are regularly provided in the World Bank database, are CO2 emissions (metric tons per capita) and Container port traffic (TEU) data from World development indicators [30]. Emission data for this database is provided from Climate Watch Historical GHG Emissions prepared by the World Resources Institute. Handled container data is provided by UNCTAD (UN Trade and Development). In this analysis, the container handling amount (TEU) of the panel is the independent variable, while the dependent variable is CO2 emission data.
All data are taken as a single column on an annual basis. Port container traffic data measures the flow of containers from sea to land transport modes and vice versa in twenty-foot equivalent units (TEUs), a standard-size container. The data relates to both international voyages and coastal shipping. Transshipment traffic is counted as two movements at the intermediate port (one for unloading cargo, the other for loading) and includes empty units. Emission values are created as total emissions with the agriculture, bunker fuels, energy, industrial process, land-use change - forestry, and waste statistics in the database and officially reported data.
When the Table 1 is examined, it is seen that the average CO2 emission of the countries that were subject to the research between 2000-2019 was 6.09 M/T per capita, and the container handling volume was 6,879,854 TEU. In addition, it is understood that the CO2 moderate value is 5.85 M/T per capita, and the container handling volume is 5,917,100 in terms of TEU. The maximum amount of CO2 emissions of the five countries, which are chosen for the research, was detected as 9.44 M/T per capita, while the minimum carbon emission value was 3.093 M/T per capita. The maximum handling value in terms of container handling volume was 17,372,962 TEU, while the minimum value was 672,522 TEU.
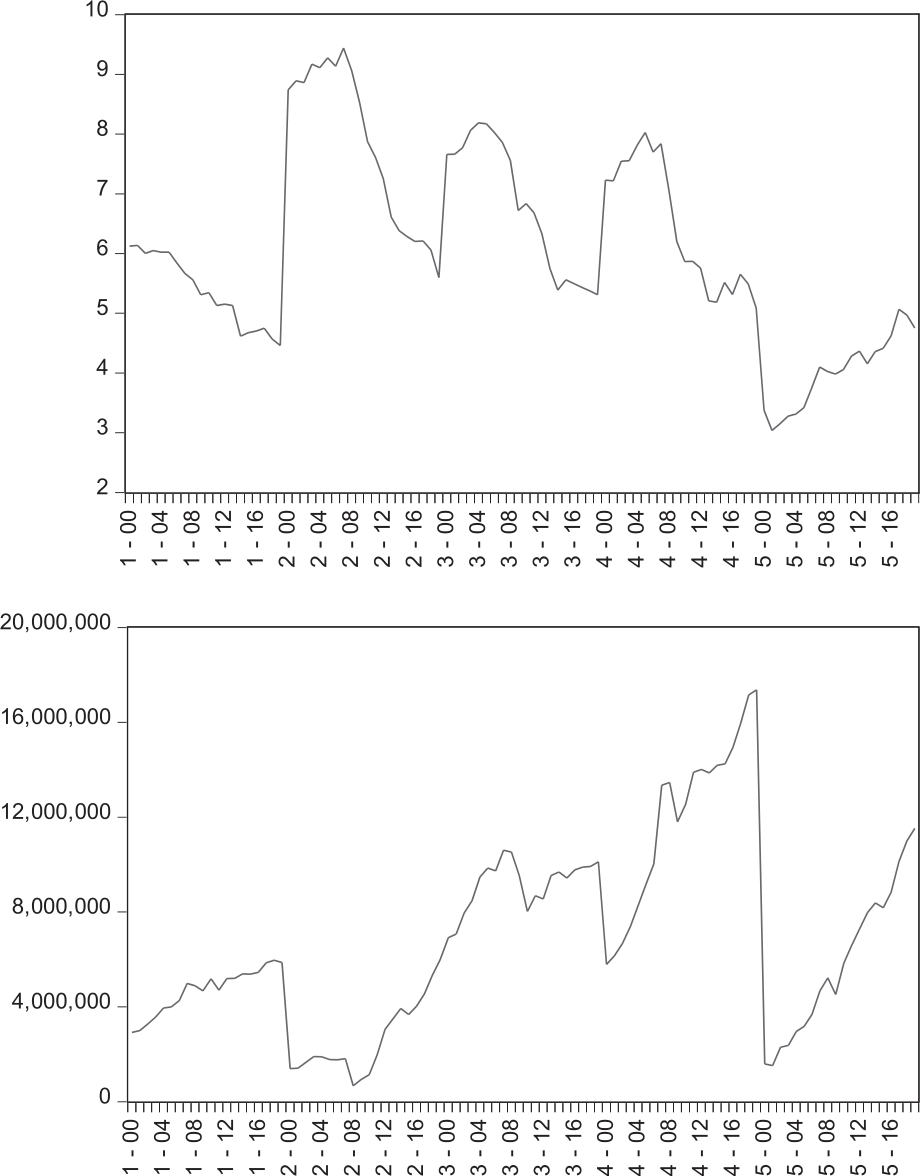
In the first graph in Fig. 1, the X-axis shows countries (1: France, 2: Greece, 3: Italy, 4: Spain, 5: Turkey) and the Y-axis shows carbon emissions (CO2 emissions, metric tons per capita). According to the graph, since 2000, there has been a decreasing trend in France for CO2 emissions. In the other four countries, horizontal and vertical increases and decreases in different periods could be mentioned.
In the second graph in Fig. 1, the X axis shows countries, and the Y axis shows container port traffic. According to the graph, there has been an increasing trend in terms of container handling volume in TEU in Türkiye since 2000, and in the other four countries, the presence of horizontal and vertical increasing and decreasing trends in different periods.
Econometric Model
Panel data analysis is a method of estimating economic relations by using horizontal cross-sectional data that belongs to the time dimension [31, 32]. Therefore, the most important feature of this analysis is that by combining time series and horizontal section series, it enables the creation of a data set with both time and sectional dimensions. Firstly, it should be noted that due to the inclusion of both cross-sectional and time series data in panel data models, an increase in the number of observations leads to an increase in the degree of freedom on the one hand, and on the other hand, a decrease in the probability of a high degree of linear relationship between explanatory variables [33, 34]. In summary, panel data, which is a combination of time series and cross-section series and also called mixed data, is a series containing cross-sectional data of units within a certain time period. In panel data, changes are observed simultaneously across time and units.
The basic model used in panel data analysis is as given below [35, 36]:
𝑌𝑖𝑡: the value of the dependent variable at time t of the ith unit, 𝑋𝑖𝑡: the value of the independent variable at time t of the ith unit, 𝛼𝑖: constant estimated for the ith unit and tth time, which includes individual effects, 𝛽𝑖: it expresses the coefficient of the independent variable, and this system has 𝑁 × 𝑇 pieces of observation.
In this study, the Panel data model was established as follows:
In the model, i refers to the unit number, t refers to the time interval, and ε refers to the error term. 𝑙𝑛CO2𝑖𝑡 represents the dependent variable that represents carbon dioxide emission, 𝛽0, the starting point, 𝛽1, the coefficient of the controller handling series of TEU type, which is the independent variable. lnCO2, the natural logarithm of carbon dioxide emission, and lnTEU, the natural logarithm of the series for container handling volume.
In addition, in order to support the model of the study, the Cobb-Douglas production function was also used in accordance with economic theory when examining the relationship between carbon emissions and container handling. In this context, based on the Cobb-Douglas [37] production function (𝐺𝐷𝑃 = 𝐴𝐾𝛽1𝐿 𝛽2𝑅𝐸𝐶𝛽3), the model was created similarly to the above (Our Panel Model) by applying logarithmic transformation on both sides of the model:
The 𝛼𝑖 term in the model is the constant term representing the effects of the countries that are subject to the study on a panel basis: France, Greece, Italy, Spain, and Türkiye. 𝛽1𝑖 refers to the changing slope parameters of the series regarding the container handling volume in TEU for each country and 𝑢𝑖𝑡 refers to the error term. The expression 𝑙𝑛 shows that the natural logarithm of the series is taken.
Results
Homogeneity Test Results
One of the first tests to be performed in panel data studies is the homogeneity test. Where the dependent variable is carbon emissions, and the independent variable is container handling volume in TEUs. Accordingly, the homogeneity test results for the five countries in the panel: H0: slope coefficients are homogeneous for; the coefficient for Delta Tilde was found to be 10.966 and for Adjusted Delta Tilde was 11.894. Probability values are less than the critical values of 1%, 5%, and 10%. Therefore, the H0 hypothesis is rejected. In this case, the slope coefficients forming the panel are heterogeneous and the H1 hypothesis will be accepted.
Horizontal Cross-Section Dependence Test
In panel data analysis, the independence of horizontal cross-section (countries) units has a great importance on the analysis results. Cross-sectional independence is based on the assumption that all cross-sectional units are affected to the same extent by any shock occurring in one of the units contained in the panel. In addition, it is also assumed that a shock occurring in any country does not affect the other countries present on the panel.
When starting the analysis, it should be tested whether there is cross-sectional dependence in the series. If cross-sectional dependence is present and this is not taken into account, unit-root and cointegration tests will yield deviant and inconsistent results [38, 39]. It was determined that the series related to the volume of handling and the dependent variable carbon emission based on the independent variable TEU were heterogeneous in the context of France, Greece, Italy, Spain, and Türkiye. In the second stage, it should be tested whether there is horizontal cross-section dependence between the series.
Breusch-Pagan Lagrange Multiplier Test hypotheses regarding cross-section dependence are established as follows and tested with the help of the statistical value appropriate to the 𝜒2 distribution with 𝑁(𝑁 − 1)/2 degrees of freedom [35, 36]. 𝐻0 ∶ 𝜌𝑖𝑗 = 𝜌𝑗𝑖 = 0, there is no correlation between units (for all 𝑡s and 𝑖 ≠ 𝑗) 𝐻1 ∶ 𝜌𝑖𝑗 = 𝜌𝑗𝑖 ≠ 0, there is correlation between units 𝜌𝑖𝑗 shows the instantaneous correlation for units i and j [40].
Table 2.
Horizontal cross-section data dependency test for container handling volume and carbon emission.
When the results of horizontal cross-sectional dependence on both carbon emissions and container handling volume series are examined, the probability values of the series are less than 0.05, as shown in Table 2. Therefore, the H0 hypothesis that was established as “there is no horizontal cross-sectional dependence” is rejected. The H1 hypothesis, which is established as “there is a horizontal cross-sectional dependence”, is accepted. According to this result, positive and negative effects occurring in any of the countries affect other countries as well.
Unit Root Test Results
The fact that cross-sectional dependence has been detected between our series indicates that the application of the CADF (Cross Sectionally Augmented Dickey-Fuller) test, which is the second-generation unit root test developed by Pesaran [41], will give more accurate results.
In the CADF unit root test, first, it should be tested whether the series is stationary at the level. In the case where the series is not stationary at the level, it is added to the equation by taking the first-order difference. The general hypotheses established in unit root tests are as follows; H0: Serial is not stationary. H1: Serial is stationary.
The CADF unit root test can be considered an extended alternative to the IPS test in terms of cross-section. The CIPS test statistic is the average of the CADF test statistic. Therefore, CIPS statistics:
is obtained as given. By comparing the obtained test statistic value with the critical table value developed and tabulated by Pesaran [36] through Monte Carlo simulation, it is decided whether the series contains a unit root.
Table 3, since series related to both container handling volume and carbon emission are not stationary at the level, the unit root test was applied by taking the first-degree differences and it was determined that they are stationary.
Westerlund Cointegration Test
When choosing the cointegration test method, it is important whether there is a cross-sectional dependence between the series, as in the unit root test, in addition to whether the model is heterogeneous or homogeneous. In the homogeneity test, this series is heterogeneous, and due to the presence of horizontal cross-sectional dependence in the horizontal cross-sectional dependence test, applying the second-generation panel cointegration tests will give more accurate results. In addition, considering the differences between the series and the fact that they are stationary in the first order, the cointegration relationship between the series was analyzed with Westerlund from the second-generation tests.
This test, based on the error correction model proposed by Westerlund [42], is used in two different ways: with a standard normal distribution that does not include cross-sectional dependence, and with a bootstrap distribution that includes cross-sectional dependence. The test allows for heterogeneity in parameters and for an unbalanced panel data set. It is based on the error correction model given below:
Table 3.
Unit root tests results.
Test statistics are calculated as given below:
Due to the presence of cross-sectional dependence between our series, it is necessary to interpret the cointegration results in the table above according to the Gt and Ga test statistics. According to Table 4, it is seen that the probability values of Gt and Ga (p-value) statistics are statistically significant at the level of 1%. This situation shows that there is a long-term cointegration relationship between the carbon emission and the container handling volume (in TEU) series, whose logarithms and first-degree differences are taken. In addition, the resistance probability values of Gt and Ga test statistics (Robust p-value) are also significant at the level of 1%. This result further strengthens the existence of a long-term cointegration relationship between carbon emissions and container handling volume of the countries that are the subject of this study.
AMG Panel-Based Prediction Results
The dependent variable is the direct carbon emission, and the independent variable is the container handling volume. The AMG prediction results based on the panel that is the subject of this study are given in Table 5.
Dependent Variable: co
Root Mean Squared Error (sigma): 0.7546
Wald chi2(1) = 12.18
Table 5.
AMG estimation results based on the entire panel.
| Index | Coef. | Std. Err. | z | P>|z| |
|---|---|---|---|---|
| teu | -3.44e-07 | 1.64e-07 | -2.09 | 0.037 |
| -cons | 7.951523 | 1.291702 | 6.16 | 0.000 |
Prob > chi2 = 0.0005
Root Mean Squared Error (sigma) = 0.6226
According to the AMG estimation result performed based on the entire panel, it is seen that there is a negative relationship between container handling volume and carbon emissions at a statistically significant level of 5% (p-value: 0.037<0.05). Hence, although the container handling volume increases, the carbon emission level decreases, contrary to expectations. This result is similar to the Environmental Kuznets Curve theory between GDP and carbon emissions. According to the Environmental Kuznets Curve, a negative relationship between carbon emission and GDP occurs after a certain period of time in developed countries. In other words, as the GDP ratio increases, carbon emissions decrease.
The Mediterranean is one of the regions with a significant market share in world container trade. According to the results obtained in the study, when France, Greece, Italy, Spain, and Türkiye, which are included in the panel, are taken into account in their entirety, it is observed that the container handling volume does not increase carbon emission, and there is a long-term and negative relationship between them at a statistical significance level of 5%. In addition, on the carbon emission, which is a dependent variable, the container handling volume, which is an independent variable, has a description ratio also at 62.26%.
Dumitrescu Hurlin Panel Causality Tests
According to the results of Dumitrescu Hurlin Panel Causality Tests conducted to determine whether there is causality between the series and stated in Table 6, it is observed that the container handling volume in terms of TEU is the cause of carbon emission at a significance level of 1% in the entire panel.
Carbon emission is not the reason for the container handling volume. These results support the purpose of this study.
Conclusions
Recently, it is understood that in addition to global-scale enterprises, small and medium-sized enterprises have also turned to container transportation for the import and export of raw materials, semi-finished products, and final products. The Mediterranean Region, as one of the most important maritime trade areas where container trade is carried out, is increasing its strategic status day by day. With the increasing volume of trade in the region, at what rates does emission pollution increase or whether the measures are effective or not, these are some of the topics that public opinion and researchers are curious about. In this context, the research aims to determine whether there is a cointegration relationship between the container volume handled and carbon emissions in the context of France, Greece, Italy, Spain, and Türkiye, the countries in the Mediterranean, which is among the regions most affected by global climate change. In the analyses, due to the presence of cross-section dependence among the series subject to the research, the Westerlund test, one of the second-generation panels cointegration tests, was used, and it was determined that there was a cointegration relationship between the series regarding the carbon dioxide emissions of the relevant countries and the container handling volume in TEU between 2000-2019. Accordingly, it is seen that there is a co-movement and balance between the two series. In addition, the existence of cross-sectional data dependency can be explained as positive or negative shocks occurring in one country also affecting other countries. In addition, according to the results of Dumitrescu Hurlin Panel Causality Tests, the container handling volume in TEU in the entire panel is the cause of carbon emissions at a 1% significance level, however, carbon emissions are not the cause of container handling volume, which also coincides with the practice and the result supports the purpose of our study. According to AMG estimation results, a negative correlation was detected between the two series. Also, AMG estimation results performed based on the entire panel revealed that there was a negative relationship between container handling volume and carbon emissions at a statistically significant level of 5% (p-value: 0.037<0.05). Accordingly, although the container handling volume increases, the carbon emission level decreases, contrary to expectations. This situation is contrary to the traditional belief that increasing the volume of economic activities causes environmental pollution to the same extent. At least it is clear that container trade is not at the top of the list of factors causing carbon emission pollution.
It could be said that the climate policies have been implemented more concretely with the international agreements to which the countries participating in the study adhere and the increasing awareness of climate change. Because, according to all the determined criteria, including CCPI, the emergence of energy-saving technology and the conversion to renewable energy sources have a direct effect on reducing CO2 emissions. In conclusion, it is clear that an increase in maritime trade does not lead to an increase in carbon emission pollution levels, and the implementation of more environmentally friendly policies does not slow down the cycle of economic progress and development in Mediterranean trade. Although more and more countries and industry organizations are committing to achieving net zero emissions, this transition still does not have a mass-binding regulation. Considering that the path to reaching Net Zero in terms of technology is still unclear in many sectors, the situation in maritime can be said to be on the right track as a more environmentally friendly transportation approach, fossil fuel-free or filtered shipping, and green port practices will yield positive concrete results. The IMO (International Maritime Organization) Marine Environment Protection Committee aims to reduce GHG emissions from ships by more than 50 percent in 2050. For this reason, IMO maritime transport, which has the sanctioning power in the sector, has asked ships to take Energy Efficiency measures (EEDI) to reduce GHG emissions into the atmosphere. In addition, it took a more active role in the EU and established DCS (Data Collection System) and wanted to detect and control the current situation by collecting information on the amount of CO2 released into the atmosphere from ships and the energy efficiency of ships. Therefore, he asked them to make an Energy Efficiency Management Plan (SEEMP) for their ships in order to reduce GHG emissions into the atmosphere.
The fact that emissions are falling in the findings should be interpreted as the success of some such actions and stability in operation and should also be used to suggest a policy basis for achieving the Sustainable Development Goals proposed by the United Nations and reinforce initiatives such as the UNFCCC’s Race to Zero campaign. These results will provide a strong motivation for governments to create the necessary policies to reduce GHG emissions by showing that their economic progress will not be damaged. However, from now on, how the EU’s policy of granting the right to emit CO2 in accordance with ETS (Emission Trading Systems) will change this situation should be addressed in future studies.

